"volume" için komut dosyalarını ara
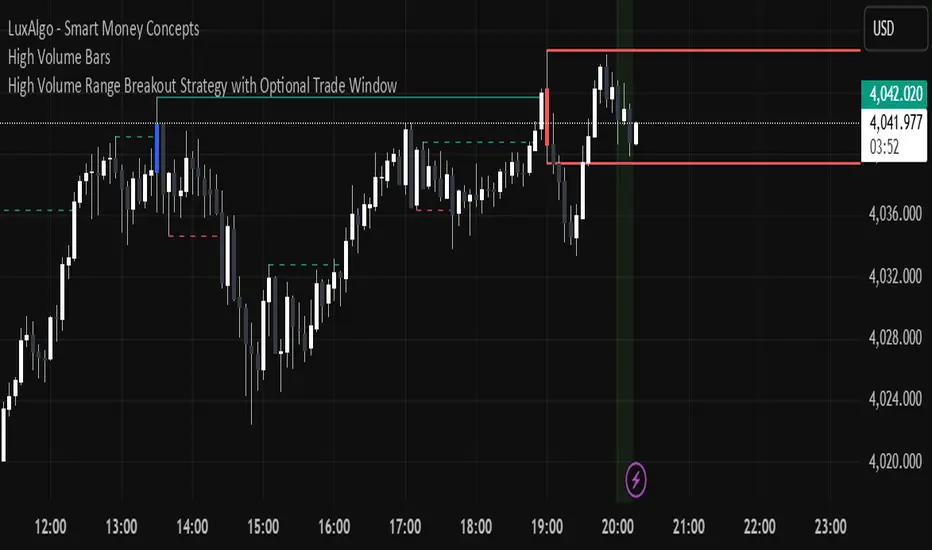
High Volume Candle Breakouts [Engr. Havery]this plots high volume candles on your chart then when a breakout happens, it gives you an alert then place your limits on the active range. goodluck and have fun
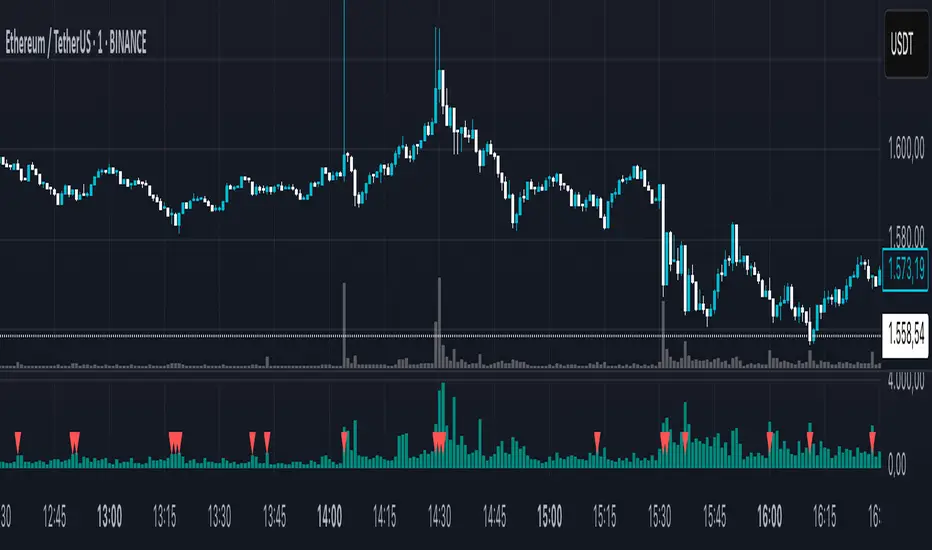
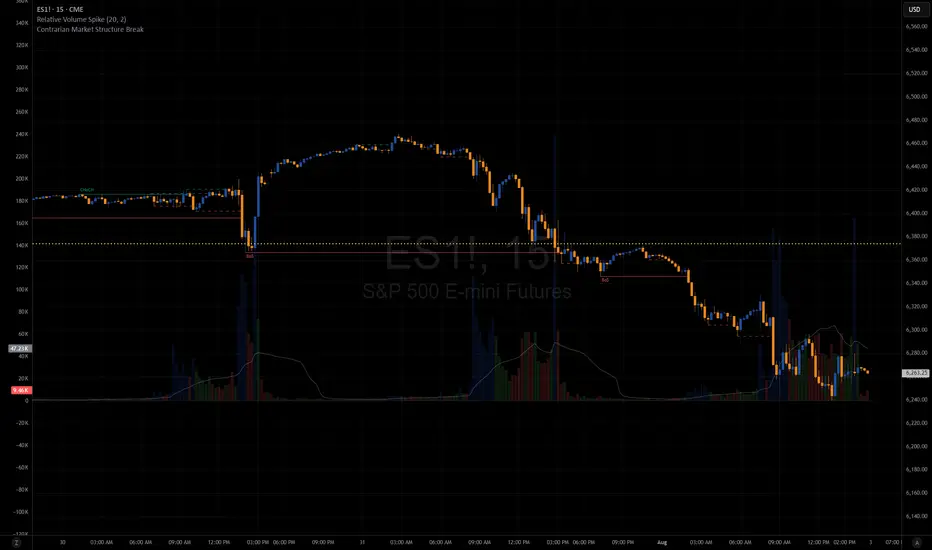
Session Volume Spike DetectorSession Volume Spike Detector (Buy/Sell, Dual Windows, MTF + Edge/Cooldown)
What it does
Detects statistically significant buy/sell volume spikes inside two DST-aware Mountain Time sessions and projects 1m / 5m / 10m signals onto any chart timeframe (even 1s). Spikes are confirmed at the close of their native bar and are edge-triggered with optional cooldowns to prevent duplicate alerts.
How spikes are detected
Volume ≥ SMA × multiplier
Optional jump vs recent highest volume
Optional Z-Score gate for significance
Separate Buy/Sell logic using your Direction Mode (Prev Close or Candle Body)
Multi-Timeframe (MTF) display
Shows 1m, 5m, 10m arrows on your current chart
Each HTF fires once on its bar close (no repaint after close)
Sessions (DST-aware, MT)
Morning: 05:30–08:30
Midday: 11:00–13:30
Spikes only count inside these windows.
Inputs & styling
Thresholds: SMA length, multipliers, recent lookback, Z-Score toggle/level
Toggles for which TFs to display (chart TF, 1m, 5m, 10m)
Per-TF colors + cooldowns (seconds) for Any TF, 1m, 5m, 10m
Alerts (edge + cooldown)
MTF Volume Spike (Any TF) — fires on the first qualifying spike across enabled TFs
1m / 5m / 10m Volume Spike — per-TF alerts, Buy or Sell
Recommended: set alert Trigger = Once per bar close. Cooldowns tame “triggered too often” warnings.
Great with
FVG zones, bank/insto levels, session range breaks, and trend filters. Use the MTF arrows as a participation/pressure tell to confirm or fade moves.
Notes
Works on any symbol/timeframe; best viewed on 1m or sub-minute charts.
HTF spikes appear on the bar close of 1m/5m/10m respectively.
No dynamic plot titles; Pine v6-safe.
Short summary (≤250 chars):
MTF volume-spike detector for intraday sessions (DST-aware, MT). Projects 1m/5m/10m buy/sell spikes onto any chart, with edge-triggered alerts and per-TF cooldowns to prevent duplicates. Ideal for spotting institutional participation.

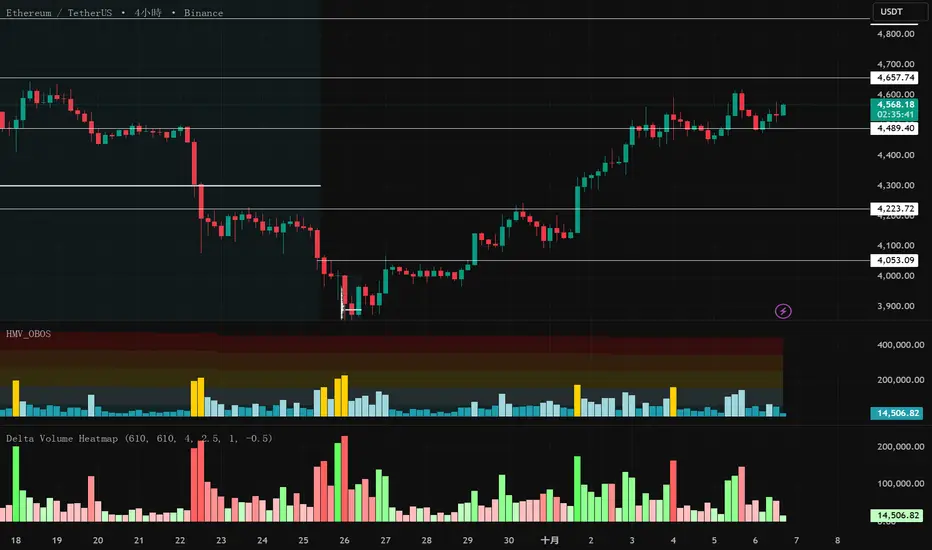
Delta Volume Heatmap Delta Volume Heatmap
The Delta Volume Heatmap visualizes the real-time strength of per-bar delta volume — highlighting the imbalance between buying and selling pressure.
Each column’s color intensity reflects how strong the delta volume deviates from its moving average and standard deviation.
🟩 Green tones = Buy-dominant activity (bullish imbalance)
🟥 Red tones = Sell-dominant activity (bearish imbalance)
This tool helps traders quickly identify:
Abnormal volume spikes
Absorption or exhaustion zones
Potential reversal or continuation signals

Delta Volume Heatmap Delta Volume Heatmap
The Delta Volume Heatmap visualizes the real-time strength of per-bar delta volume — highlighting the imbalance between buying and selling pressure.
Each column’s color intensity reflects how strong the delta volume deviates from its moving average and standard deviation.
Green tones = Buy-dominant activity (bullish imbalance)
Red tones = Sell-dominant activity (bearish imbalance)
This tool helps traders quickly identify:
Abnormal volume spikes
Absorption or exhaustion zones
Potential reversal or continuation signals
Cumulative Relative Volume- Intraday (RVOL)This Indicator checks the current day's cumulative volume at sometime t and compares it to the average cumulative volume traded over the last 14 days, till the particular time t. this helps in identifying how the trajectory of the volume is growing or reducing through the day. if the RVOLS are high and remains high throughout the session, then the intensity of buying is high. along with any price action this could give a confirmation to a breakout or a breakdown

Energy volume indicator sniperL'indicateur donne indique en continue l énergie évolutif acheteur /vendeur
et beaucoup plusse surprise
this indicator combines volume analysis wiith market energy detection to highlight
when the market is building momentum before a breakout.

Low Volume Breakouts [Engr. Havery]Manipulation Happens in high volume candles, so when a Low Volume Breakout happens with the high volume candles. so we enter after the manipulation, breakout then retest

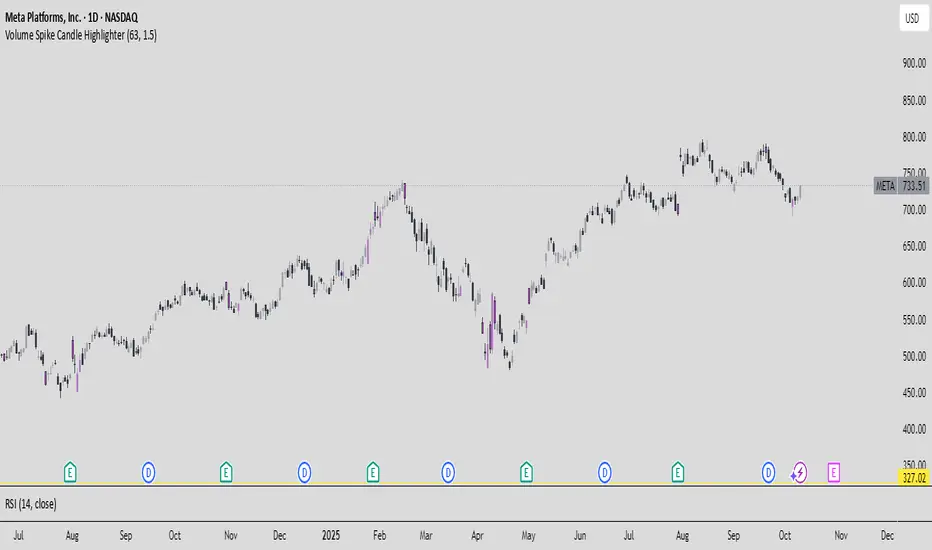
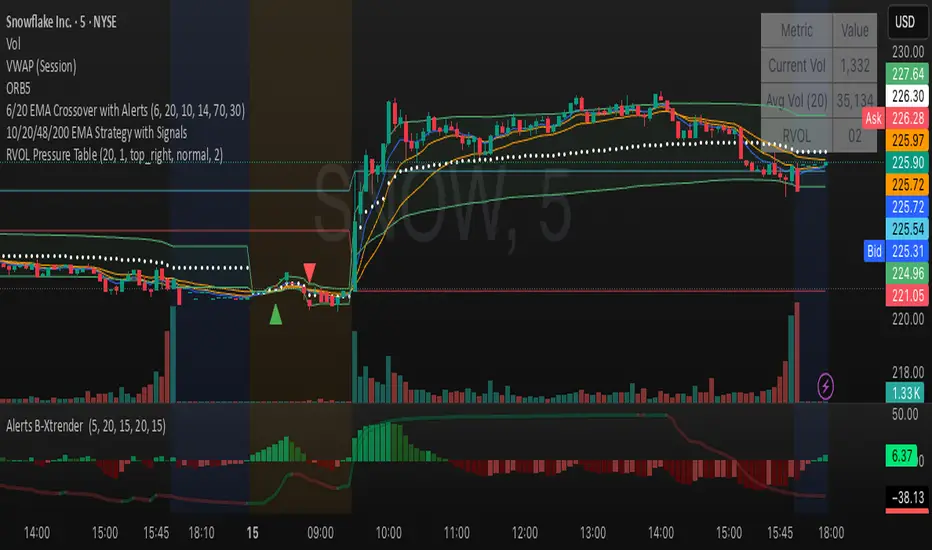
Relative Volume Table with PressureDisplay relative Volume as a table in the top right corner. Turns green when volume is high and price is increasing and red when volume is high and price is decreasing. I use this on D timeframe at the open to screen for stocks breaking out.
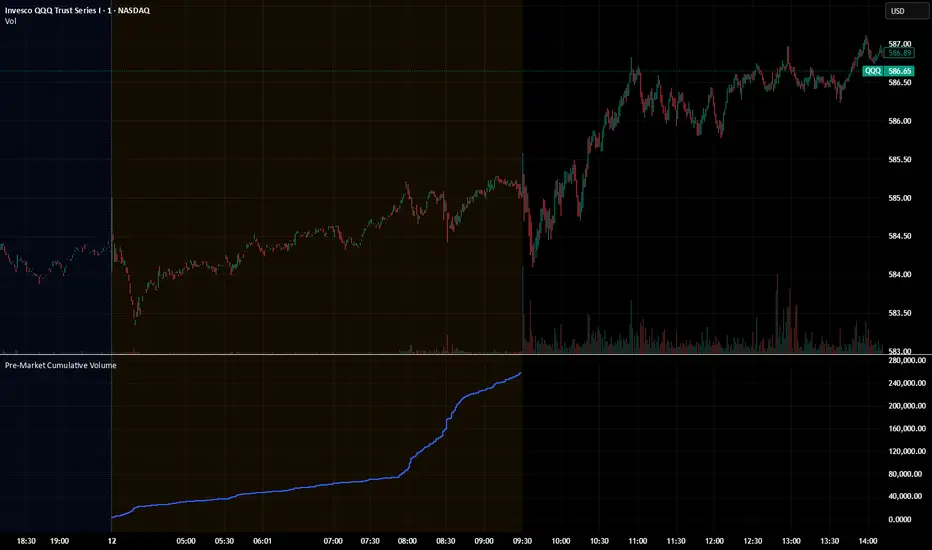
Pre‑Market Cumulative VolumeDescription:
This indicator plots the cumulative trading volume for the pre‑market session on intraday charts. It automatically detects when a bar is part of the extended pre‑market period using TradingView’s built‑in session variables, starts a new running total at the first pre‑market bar of each day, and resets at the beginning of regular trading hours. During regular market hours or the post‑market session, the indicator does not display values.
To use this script effectively, ensure extended‑hour data is enabled on the chart, and select an intraday timeframe where pre‑market data is available. The result is a simple yet powerful tool for monitoring cumulative pre‑market activity.
How to use
Add the script to a chart and make sure you are on an intraday timeframe (e.g., 1‑min, 5‑min). Extended‑hour data must be enabled; otherwise session.ispremarket will always be false.
During each pre‑market session, the indicator will reset at the first pre‑market bar and then accumulate the volume of subsequent pre‑market bars.
Outside the pre‑market (regular trading hours and post‑market), the plot outputs na, so it does not draw on those bars.
Customization (optional)
If you want to define your own pre‑market times instead of relying on TradingView’s built‑in session, you can replace the isPreMarket line with a time‑range check. For example, isPreMarket = not na(time(timeframe.period, "0400-0930")) detects bars between 04:00 and 09:30 (U.S. Eastern time). You can parameterize the session string with input.session("0400-0930", "Pre‑Market Session") to let users adjust it.

Relative Volume (RVOL) + Average Volume [AZ]The script helps you instantly see whether today’s volume is unusual compared to the past (relative volume). It’s built for breakout/fakeout filters, like the 15-minute ORB strategy you’re running.
VSA Volume OverlaySimple. When the VSA volume is above the average volume the line will draw orange. When below average volume plot , it will draw white.

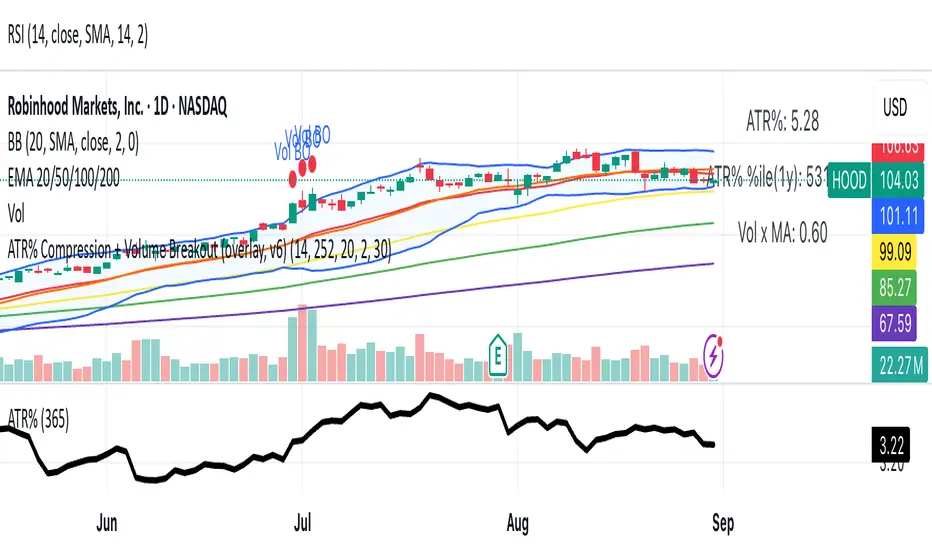
ATR% Compression + Volume Breakout (overlay price panel)this is your signal/alerts tool. It tints compression regimes, marks volume-breakout bars, and fires the two alerts (“Compression Detected” and “Volume Breakout + ATR% Rising”).
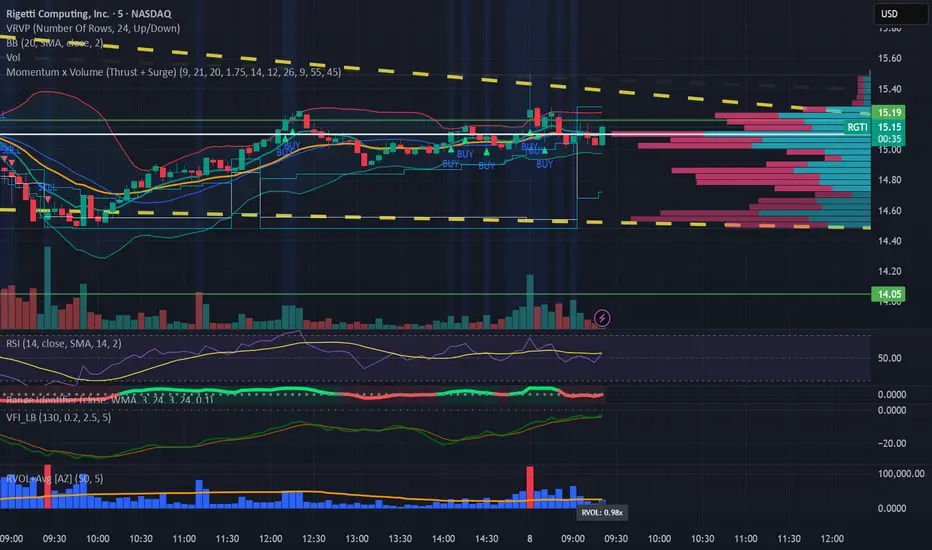
Momentum x Volume (Thrust + Surge)highlights bars where trend, momentum, and volume align. It filters for an uptrend (EMA pair or VWAP), confirms thrust with MACD histogram, measures momentum quality with volume-weighted RSI (vwRSI), and requires a volume surge vs a rolling average before signaling. The goal: surface higher-conviction breakouts and breakdowns while avoiding weak, low-volume moves.

Buy Sell Volume Dashboard (Conditional Colors)Display all data in the box (dashboard) on the top right chart.
✅ Data output:
Buy Volume
Sell Volume
Volume Difference (Buy – Sell)
Buy % / Sell % Dominance
✅ Auto according to the timeframe we open (for example if open 5m, data follows 5m; if daily, follow daily).

PVSRA Volume Suite Combinedcreegrack modfied pvsra volume indicator, all his feature but you are able to see on a smaller screen

M3EDGE™ Relative Volume (RVOL)Relative Volume (RVOL) compares the current volume to its historical average.
🎯 Goal: Spot abnormal flows and anticipate impulsive moves.
🔍 M3EDGE™ Key Reading:
• RVOL > 2.0 → Likely institutional activity.
• RVOL > 1.5 → Heightened surveillance: potential move building.
• Price falling + high RVOL → Stealth accumulation / sell-side absorption.
• Price rising + high RVOL → Confirmed breakout with real flows.
💡 In the M3EDGE™ method, RVOL filters out false signals and validates setups by aligning flow + structure + momentum.
Applied to ETFs or stocks, it reveals what price action alone won’t show

Relative Volume SpikeThis indicator lets you know when a wick has 2x (default value) more volume than the average.
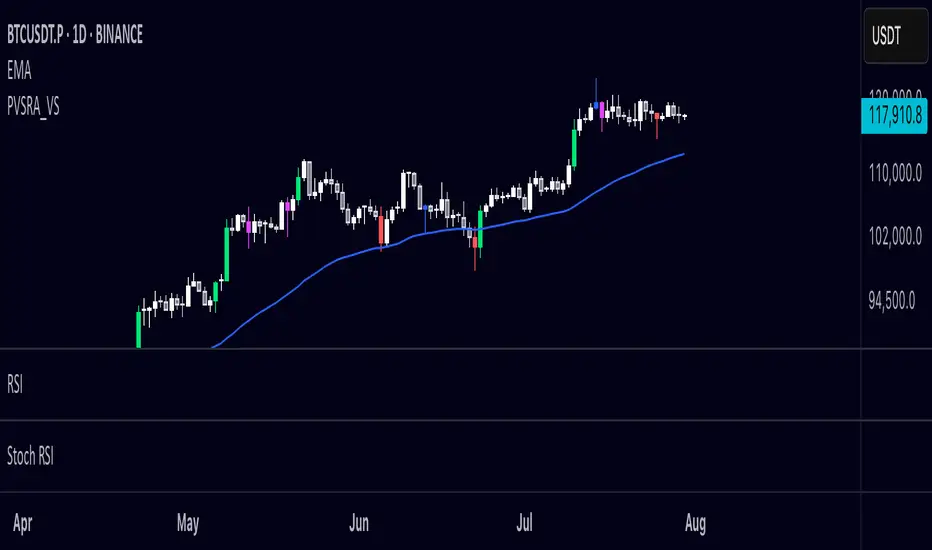
PVSRA Volume Suite OverlayPVSRA Volume Suite v5 is a volume-based candle coloring tool inspired by the original PVSRA system from MT4. It identifies and highlights Climax candles (extremely high volume/spread) and Above-Average volume candles relative to the last 10 bars. Bullish and bearish candles are colored differently based on their volume classification to help spot potential institutional activity or market reversals.
This script also includes a symbol override option, allowing volume analysis from another ticker (e.g., BTC volume on altcoin charts).
📌 Credit to creengrack for the open-source code that informed this TradingView version.
Thank you
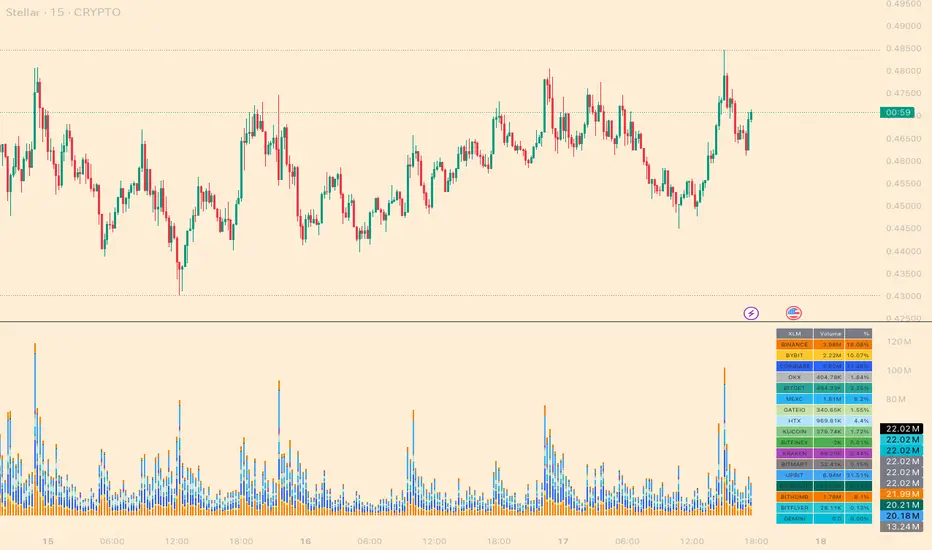
Cross-Exchange Any Volume[nakano]# Cross-Exchange Any Volume
This indicator aggregates the real-time trading volume of a specific crypto asset across multiple exchanges and displays it as a single, stacked column chart. It allows you to grasp the total volume and its composition across the market at a glance.
このインジケーターは、複数の取引所における特定の暗号資産の出来高をリアルタイムで合算し、一つの積み上げ棒グラフに表示します。市場全体の総出来高とその内訳を、一目で把握することができます。
## Features / 主な機能
* **Aggregate up to 20 Exchanges:** Simultaneously calculates and displays the volume from up to 20 user-defined exchanges.
* 最大20の取引所の出来高を同時に集計・表示します。
* **Customizable Exchanges:** Freely customize the exchange prefix for each slot in the settings (e.g., `BINANCE`, `COINBASE`, `BYBIT`).
* 設定画面から各取引所の取引所プリフィックスを自由に変更可能です(例:`BINANCE`、`COINBASE`、`BYBIT`)。
* **Flexible Quote Currencies:** Specify the quote currencies you want to aggregate for each exchange in a comma-separated list (e.g., `USDT,USDC`).
* 取引所ごとに集計したいクォート通貨をカンマ区切りで指定可能です(例:`USDT,USDC`)。
* **Individual Configuration:** Individually configure the color and visibility (On/Off) for each exchange slot.
* 各取引所の色や表示/非表示を個別に設定できます。
* **On-Chart Details:** Display a detailed volume breakdown on the chart as either a Table or a Label. Text size is also adjustable.
* チャート上に出来高の内訳をテーブル形式またはラベル形式で表示できます。文字サイズの調整も可能です。
* **Debug Report:** Includes a date-range-specific cumulative volume report for debugging and analysis purposes.
* デバッグや分析目的で、指定した期間の累計出来高レポートを表示する機能を搭載しています。
## How to Use / 設定方法
1. **Set Base Asset:** In the settings, enter the crypto asset symbol you want to analyze into the `Base Asset` field (e.g., `BTC`, `ETH`, `SOL`).
* 設定画面の`Base Asset`に、分析したい暗号資産のシンボル(例:`BTC`, `ETH`, `SOL`)を入力します。
2. **Configure Exchanges:** For each row (1-20), enable the checkbox for the exchange you want to use. Then, enter the correct exchange prefix (e.g., `BINANCE`) and the desired quote currencies (e.g., `USDT,USDC`). You can also customize the display color.
* 各行(1〜20)で、使用したい取引所のチェックボックスをONにします。次に、正しい取引所プリフィックス(例:`BINANCE`)と、集計したいクォート通貨(例:`USDT,USDC`)を入力します。表示色も自由にカスタマイズできます。
3. **Disable Unused Slots:** For any slots you are not using, simply leave the checkbox disabled. The script will ignore them.
* 不要なスロットは、チェックボックスをOFFのままにしてください。スクリプトはそれらを無視します。
## Notes / 注意事項
* **`request.security` Call Limit:** Pine Script has a limit on `request.security` calls (around 40 per script). If the total number of quote currencies across all enabled exchanges exceeds this limit, the script will stop with an error. For example, `USDT,USDC` counts as two pairs. Please be mindful of the total number of pairs in use.
* **`request.security`の呼び出し回数上限**: Pine Scriptには、スクリプトあたりの`request.security`呼び出し回数に上限(約40回)があります。有効にした全取引所のクォート通貨の合計数がこの上限を超えると、スクリプトはエラーで停止します。例えば、`USDT,USDC`は2ペアとしてカウントされます。有効にするペアの合計数にご注意ください。
* **Debug Report Timeout:** The Debug Report feature aggregates data over every single bar within the specified date range. Using this feature with a long date range on short timeframes (like the 1-minute chart) may cause the script to exceed TradingView's calculation limits and time out. It is recommended to use a shorter time range when enabling this feature on low timeframes.
* **デバッグレポートのタイムアウト**: デバッグレポート機能は、指定された期間のすべてのバーのデータを集計するため、特に1分足などの短い時間足で長期間を指定すると、TradingViewの計算リソースの限界を超え、チャートの読み込みがタイムアウトする可能性があります。この機能を使用する際は、短い期間に絞ってお試しいただくことをお勧めします。
Session VolumeThis script tracks and displays 30-minute volume segments during the Regular Trading Hours (RTH) session. It allows traders to visually compare each time block’s volume today vs. the same block from the previous day, helping spot early signs of strength, weakness, or divergence.
Features:
Tracks 13 blocks from 9:30 AM to 4:15 PM ET.
Compares today's volume against historical volume from the same time block yesterday.
Highlights percentage changes per block.
Summary row totals show overall volume trend today vs. yesterday.
This tool is useful for discretionary traders, auction market theorists, and anyone who incorporates market-generated information into their decision-making.

Climax Volume FilterThis script helps filter out volume spikes caused by sudden market events (e.g. CPI, FOMC), which can distort volume-based analysis.
It identifies and optionally smooths or excludes high “climax” candles to provide a clearer view of natural volume trends during pullbacks and consolidations.
Use it to:
• Avoid misreading volume during news events
• Improve your reading of exhaustion vs. continuation
• Support better entry timing during flag or FVG setups