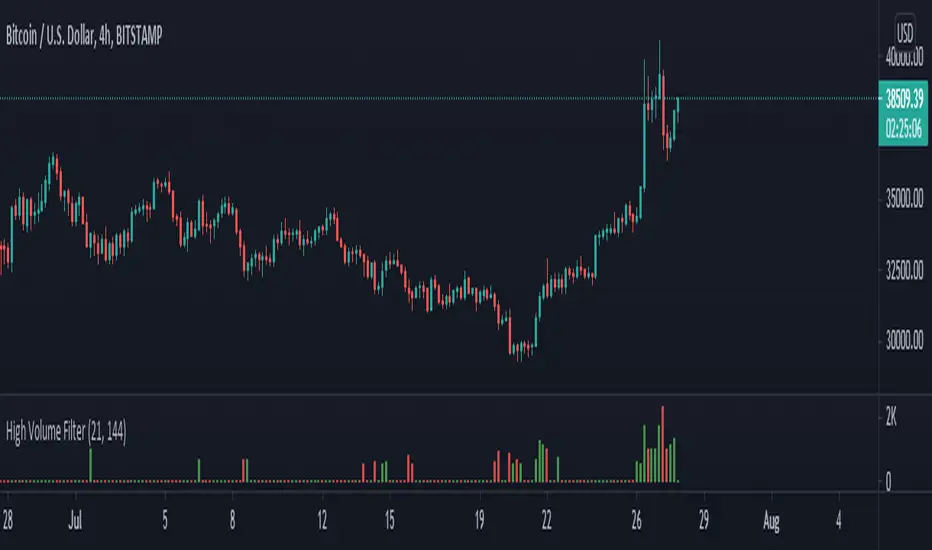
High Volume Filter - Taylor V1High Volume Filter
- Hide Small Volume Bar
- Show High Volume Bar
Able to Change the Filter Average Period
Komut dosyalarını "volume" için ara

Candle Volume ProfileAn updated version of Candle Volume Profile.
Reworked to make it work with every timeframe.
All you gotta do is type in the input a value that is 1/10th of the current timeframe in minutes (example: 6 on the 1h tf, 24 on the 4h, 1 on the 10min tf etc etc)
The redder the part of the candle is, the higher the volume was in that section.
Suggested to either hide the original chart or make the candle body transparent

Cumulative Volume FTX + BINANCE SPOT VS DERVIATIVE VOLUMEShows spot volume green and red and derivative volume as blue.

Symbol VolumeUnlike the built-in Volume indicator and other custom scripts, this one allows to configure the volume symbol and preserves the known look and feel.

Koalafied Volume Extension Bar colours based on extensions from volume Z-Score. Large volume candles can often signal exhaustion or show market strength in reversals or breakouts. Candles not supported by rising volume are coloured black while those that are retain their colouring.

Relative Volume LabelThe indicator shows the current day volume out of the average of the last chosen days.
The result is shown on a label below the last bar.
Users can choose the number of days to include in the average calculation and the label colors.

Plot Other Symbol VolumeThis script plots the volume of another specified symbol.
The standard TradingView 'compare' functionality already covers plotting the various price types.

Delta Volume/Cumulative deltaThis is a slightly modified version of the Delta Volume v2.1 indicator from kernel_phi.
You can read the documentation here:

SWT Volume AlertBased off the built in Volume study. Added an alert condition for when the current bar's volume surpasses that of the previous bar.

Moving Candle VolumeShows which part of the candle was executed with the highest volume.
Different from Candle Volume Profile because more useful for indicators and scripts
VERY IMPORTANT TO CHANGE THE SETTING BASED ON THE TIMEFRAME.
Does not work on any timeframe lower than 20 minutes

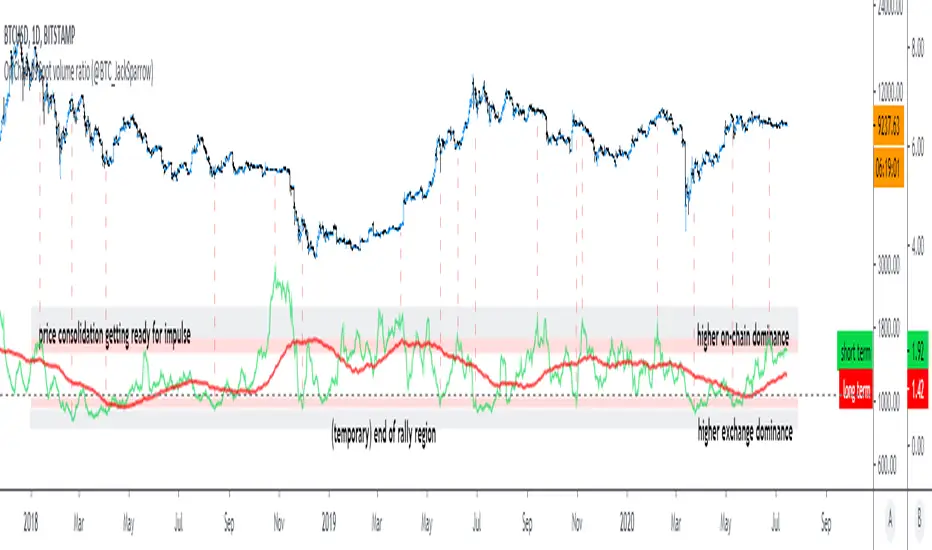
On Chain vs Spot volume ratio (@BTC_JackSparrow)Calculates and displays the ratio between on chain recorded Bitcoin transaction volume and the volume traded over multiple spot exchange pairs - includes all exchanges mentioned by Bitwise Research
Price Weighted VolumeReally simple: VWAP idea applied to volume, to see how much actual value is moving around. Great for assets pegged to fiat like USD, as it then shows how many dollars moved.
It's fun to pair with a long-term VWAP.


Time and sales volume final 1 hello, this is a volume script that depicts the basics of time and sales onto an accurate volume scale. what this can be used for is finding reversal to enter shorts, or puts and strong bullish movement to enter longs or calls. The green indicates buying and red indicates selling inside a candlestick. obviously when securities are exchanged there is an equal amount but this works off relative to the candle close and open to help determine a certain direction.

Specific Bar Volume RatioSimple.
NYSE only.
0930am-1130am only.
The colors are based on the popular Zanger Ratio.
The code compares the current volume (5m candles) to the average of precisely the same candle on the same day over the past 20 trading days.
Below 60 = drying up / low (grey)
Above 60 = below average (orange)
Above 80 = average (pink)
Above 120 = High (magenta)
Above 200 = Extreme (red)
The example you see is in Central time.
Contact me if you are interested.

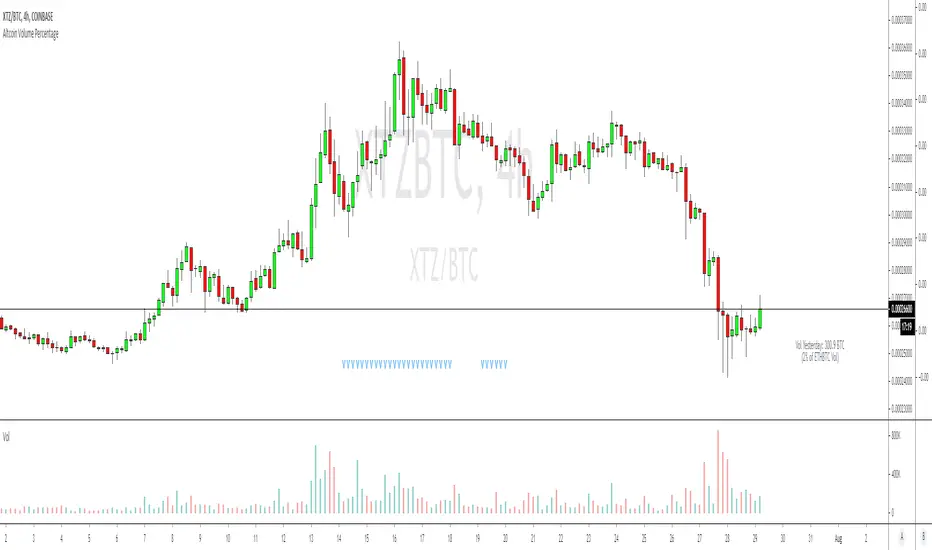
Altcoin Volume StatsShows how much BTC volume an alt has done in the past 24 hours as a label, with a comparison of that volume versus ETHBTC on Binance, as a percentage. Something I have been hoping the good people at Tradingview would add to the interface for years. It also shows some other stats in the data window on the right: i.imgur.com
Big thanks to the talented @Daveatt who helped unbake my noodle with some label code I couldn't figure out.
Tradeer Volume Change Identifier This separate indicator shows classical volume on each bar, but it can also show volume increase in three steps, every step has his own color, default setting is 33% increase by yellow, 66% by red, 100% incerase by white color. For the increase to be displayed it must be also bigger than average volume set in default by 10 MA.

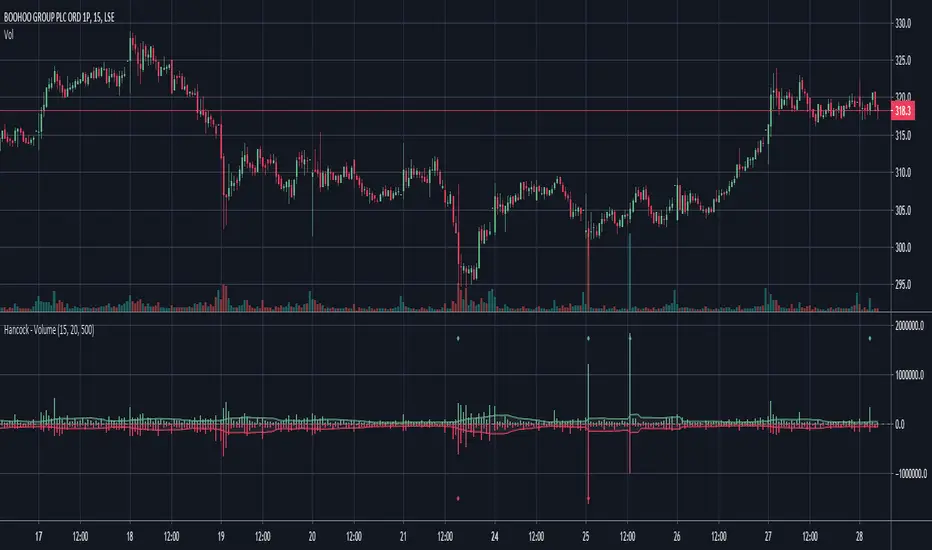
Hancock - VolumeEstimates the buy and sell volume of each candle by using a configurable lower time-frame and displays the volume in a colored histogram.
Happy trading
Hancock
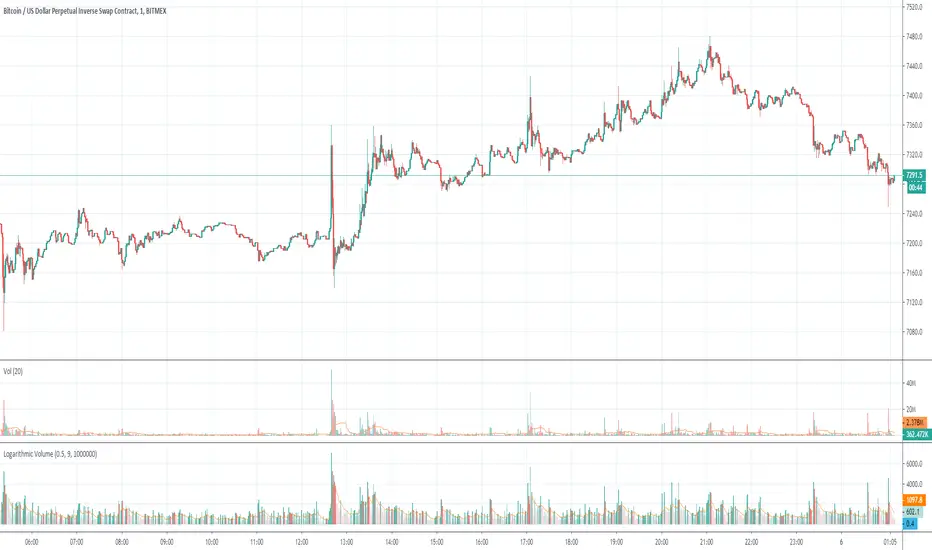
Logarithmic VolumeIn volatile markets, normal indicator suffer from volume spikes that make the rest of plot seem non-existent.
Using logarithmic exponent, this indicator normalizes the volume, so this makes it easier to read.
The obvious drawback is that it does not display the actual volume amount, only a relative value.