"volume" için komut dosyalarını ara

VolumeVolume is a measure of how much of a given asset has been traded in a given period of time. It is a very powerful tool!
Enjoy!

Volume Pairwise Highlight### Volume Pairwise Highlight
**Overview:**
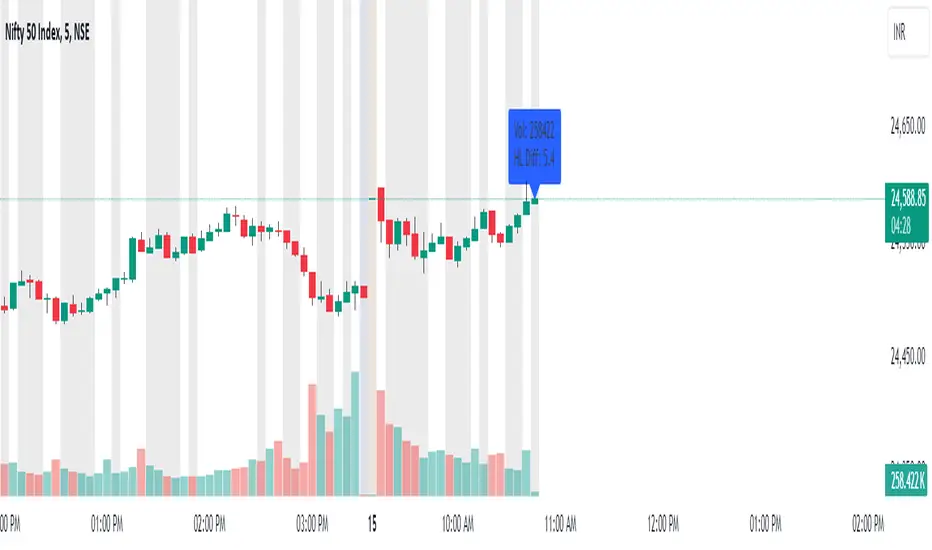
The "Volume Pairwise Highlight" Pine Script is designed to analyze and visualize the relationship between the volumes of consecutive candlesticks in a trading chart. This script calculates the high-low difference of each candlestick and plots it, while also highlighting specific conditions in the volume histogram.
**Key Features:**
1. **High-Low Difference Calculation:**
- The script calculates the difference between the high and low prices of each candlestick.
- This difference is plotted as a histogram on the main chart for easy visualization.
2. **Volume Condition Highlight:**
- The script checks if the volume of the previous candlestick is higher than the volume of the current candlestick.
- If this condition is met, the current volume bar is highlighted in red; otherwise, it is colored green.
- This helps traders quickly identify periods where there was a drop in volume compared to the previous period.
3. **Volume Display:**
- The volume is plotted as a histogram on a separate pane, making it easy to compare volumes across different periods.
- The coloring of the volume bars provides a quick visual cue for significant changes in trading volume.
4. **Information Display:**
- The script dynamically updates and displays the volume and high-low difference values on the chart.
- This provides traders with immediate feedback on the current trading activity.
5. **Optional Moving Average:**
- The script includes an optional moving average of the high-low difference.
- This moving average can be customized in length and helps smooth out the data for better trend analysis.
**Customization:**
- **Volume Threshold:** Customize the volume threshold to highlight specific volume conditions.
- **Highlight Color:** Adjust the highlight colors to suit your visual preferences.
- **Moving Average Length:** Modify the length of the moving average to better fit your analysis needs.
**Usage:**
This script is useful for traders looking to:
- Identify significant changes in trading volume.
- Analyze the volatility of candlesticks through high-low differences.
- Quickly spot periods of declining volume, which could indicate potential changes in market trends.
By providing clear visual cues and detailed volume analysis, the "Volume Pairwise Highlight" script aids traders in making more informed trading decisions.
Volume SMA with Multiple Overlays in Separate PaneVolume plays a pivotal role in our trading. Stock market price movements are randam until and unless same is supported by volume. Voulme is the only leding indicator and can track instituitional activity.
This indicator analyses volume to indentify unsual volumes in the market. it draws there sma lines of last 1200 barrs as follows:
1. sma of 1200 bars represented by blue
2. sma of 1200 bars multiplied by 15, represented by red
3. sma of 1200 bars multiplied by 20, represented by black.
The clor codes and line width can be modified.

Volume Data Table (Real-time & Historical Volume Analysis)Volume Data Table (Real-time & Historical Volume Analysis)
Overview:
The Volume Data Table indicator is a powerful tool designed to provide concise, real-time, and historical volume insights directly on your chart. It aggregates critical volume metrics into an organized, customizable table, making it incredibly easy to identify unusual volume activity, sudden surges, or sustained interest in a particular asset.
This indicator is perfect for traders who rely on volume analysis to confirm price movements, spot potential reversals, or gauge market conviction.
Key Features & How It Works:
Real-time Volume Metrics:
The table prominently displays the volume data for the current (last) candle, including:
Time: The precise time of the current candle's close, formatted in IST (Indian Standard Time - UTC+5:30) for your convenience.
Volume: The total volume for the current candle, smartly formatted in K (Thousands) or M (Millions) for readability.
Change % (Chg%): The percentage change in volume compared to the immediately preceding candle. This helps you quickly spot sudden increases or decreases in trading activity.
Vs 4-Avg % (vs4Avg%): The percentage change in volume compared to the average volume of the last 4 preceding candles. This is crucial for identifying volume surges or drops relative to recent historical activity, which can signal significant market events.
Configurable Historical Data:
Beyond the current candle, you can customize how many previous candles' volume data you wish to display. A simple input setting allows you to choose from 1 to 20 historical rows, giving you flexibility to review recent volume trends. Each historical row also provides its own "Change %" and "Vs 4-Avg %" for detailed analysis of past candle activity.
Intuitive Color-Coding:
Percentage change values are intuitively color-coded for instant visual cues:
Green: Indicates a positive (increase) in volume percentage.
Red: Indicates a negative (decrease) in volume percentage.
Clean & Organized Table Display:
The indicator presents all this data in a neat, easy-to-read table positioned at the top-right of your chart. The table automatically adjusts its height based on the number of historical rows you choose, ensuring a compact and efficient use of screen space.
Ideal Use Cases:
Volume Confirmation: Quickly confirm the conviction behind price movements. A strong price move on high "Vs 4-Avg %" volume often indicates higher reliability.
Spotting Abnormal Volume: Identify candles with unusually high or low volume compared to their recent average, which can precede or accompany significant price action.
Momentum Analysis: Understand if buying/selling pressure is increasing or decreasing over recent periods.
Scalping & Day Trading: The real-time updates and concise format make it highly effective for fast-paced short-term decision-making.
Complements Other Indicators: Use it alongside price action, candlestick patterns, or other technical indicators for a more robust analysis.
Customization Options:
Number of Historical Rows: Adjust Number of Historical Rows from 1 to 20 to tailor the depth of your historical volume review.
Important Disclaimer:
This indicator is a technical analysis tool and should be used as part of a comprehensive trading strategy. It is not financial advice. Trading in financial markets involves substantial risk, and you could lose money. Always perform your own research and risk management.

Volume Histogram with ThresholdsVolume Histogram with Thresholds
Description:
This indicator displays a histogram of volume bars with color coding based on customizable volume thresholds. It helps traders quickly identify potential breakouts and breakdowns by comparing current volume against a moving average of past volume.
Features:
Customizable Average Volume Period – Allows you to set a lookback period for calculating average volume.
Color-Coded Bars for Quick Visual Reference:
Gray: Below average volume (low activity)
Blue: Near average volume (normal activity)
Green: Above average volume (potential breakout/breakdown)
Red: Significantly above average volume (high-confidence move)
Plots an Orange Reference Line – Represents the average volume for easy comparison.
Usage:
Adjust "Average Volume Period" to set the moving average length for volume.
Modify "Above Average" and "High Volume" multipliers to fine-tune breakout/breakdown sensitivity.
Look for green and red bars to confirm strong moves in price action.
This indicator can help confirm the validity of breakouts and breakdowns by visually emphasizing volume surges. 🚀
Explanation of Presets in the Indicator
The indicator comes with three user-configurable settings that determine how volume is analyzed and displayed. Here’s what they do and why they matter:
1. Average Volume Period (Default: 50)
This setting controls the number of past bars used to calculate the Simple Moving Average (SMA) of volume.
A larger value (e.g., 100) smooths out fluctuations and gives a broader view of average volume trends.
A smaller value (e.g., 20) makes the average more responsive to recent volume changes.
2. Above Average Threshold (Multiplier, Default: 1.5)
This defines the first level of volume increase that is considered above average.
If the current volume is 1.5 times greater than the moving average volume, the histogram bar turns green.
You can lower this value (e.g., 1.2) to make the indicator more sensitive or increase it (e.g., 2.0) to filter out smaller spikes.
3. High Volume Threshold (Multiplier, Default: 2.5)
This determines the threshold for what is considered significantly above average volume.
If the current volume is 2.5 times greater than the moving average volume, the histogram bar turns red.
This setting helps highlight extremely strong volume surges, which are more likely to indicate high-confidence breakouts or breakdowns.
How to Adjust These Presets for Different Market Conditions
If you trade high-volatility assets, you might want to increase the multipliers (e.g., 2.0 and 3.5) to focus only on the strongest moves.
If you trade low-liquidity assets, you might need to lower the multipliers (e.g., 1.2 and 2.0) to capture smaller but meaningful volume shifts.
Short-term traders (scalping/day trading) may prefer a lower average volume period (e.g., 20) to get faster signals.
By tweaking these settings, you can adapt the indicator to your trading style and the asset you’re analyzing. 🚀

Volume Spike | viResearchVolume Spike | viResearch
Conceptual Foundation and Innovation
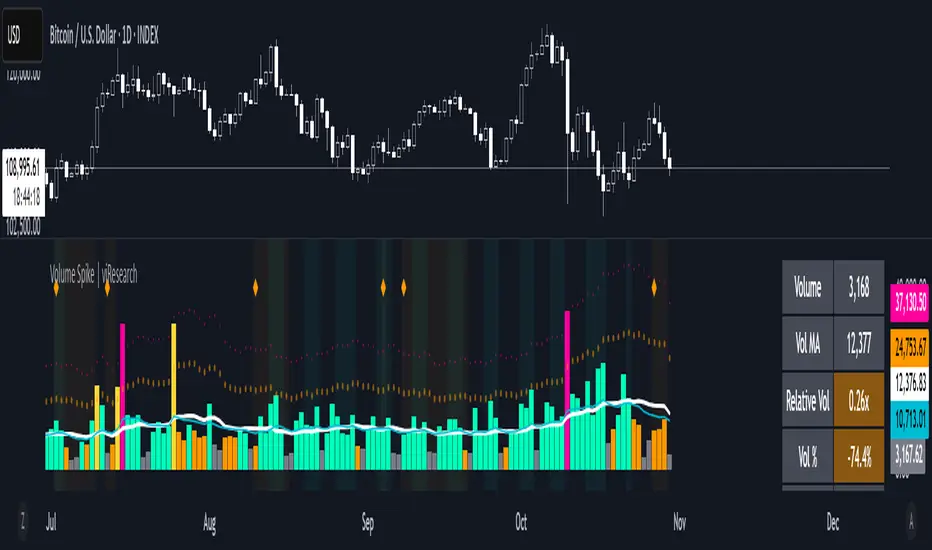
The Volume Spike indicator by viResearch is designed to identify the underlying strength and health of market participation by analyzing volume behavior. Rather than simply detecting high or low volume, this indicator distinguishes between healthy, gradual accumulation and unsustainable volume surges, giving traders a nuanced understanding of market sentiment.
The indicator focuses on the relationship between current trading volume and its moving average, classifying market activity into several key regimes — gradual, consistent, spiking, or weakening. This allows traders to quickly assess whether a price move is supported by solid participation or driven by temporary excitement that may not last.
Core Concept and Analysis Approach
At its core, Volume Spike measures the quality and consistency of trading activity over time. When volume rises steadily and remains within a stable range, it reflects healthy participation and sustainable trends. In contrast, when volume suddenly surges several times above average, it may indicate a climax move, often preceding a short-term top or bottom.
The indicator also incorporates consistency and trend assessments to evaluate whether current volume conditions align with accumulation, distribution, or exhaustion phases — helping traders interpret why a move is happening, not just that it is.
Features and User Inputs
The Volume Spike script includes several key parameters that allow traders to tailor its behavior to different assets and timeframes:
Volume Average Length: Defines the lookback period for calculating the average volume baseline.
Spike Multiplier: Sets the threshold (in multiples of the average) to define a true “spike” in volume.
Gradual Max Multiplier: Determines the upper limit of what is considered healthy, gradual volume growth.
Consistency Check Period: Evaluates how stable or erratic recent volume behavior has been.
Volume MA & EMA Display: Optional overlays for visual comparison against current activity.
These settings allow traders to distinguish between normal volume growth during trend formation and excessive spikes that often signal exhaustion or reversal risk.
Market Interpretation and Use Cases
The Volume Spike indicator provides valuable insights into market conditions, particularly during strong price movements or breakout phases. It can be used to:
Identify Healthy Trend Participation: Gradually rising volume within consistent ranges confirms genuine trend momentum.
Detect Volume Climax Events: Sudden spikes far above the average often mark exhaustion points, signaling caution.
Spot Divergences: When price rises but volume weakens, it can indicate a fading rally or distribution phase.
Evaluate Accumulation vs. Distribution: Volume patterns during down moves reveal whether smart money is buying weakness or selling strength.
Visual Cues and Color Logic
The indicator uses intuitive color coding to make volume interpretation straightforward:
Aqua (Healthy Gradual Volume): Stable, sustainable participation supporting trend continuation.
Pink (Volume Spike): Sharp, excessive surge — a warning of possible exhaustion or reversal.
Yellow (Elevated Volume): Moderate increase, often during breakout confirmation.
Gray (Low Volume): Reduced participation, signaling potential indecision.
Background highlights and on-chart alerts visually reinforce these signals:
Green background: Healthy, consistent volume environment.
Pink background: Warning of sudden volume spikes.
Orange background: Price-volume divergence, signaling weakening conviction.
Strategic Insights and Warnings
A gradual rise in volume typically validates trend strength, while sharp spikes can serve as early warnings of potential exhaustion. Repeated volume spikes near resistance levels may indicate distribution, whereas spikes near lows often suggest capitulation. Monitoring how volume evolves — not just its magnitude — helps traders stay aligned with smart money flow.
Information Table and Alerts
A real-time dashboard displays key statistics such as current volume, relative multiple of average, consistency level, and pattern type. Built-in alerts notify traders of critical situations, including:
Volume Spike on Up Candle — potential short-term top or euphoria.
Volume Spike on Down Candle — possible bottom or panic-driven selling.
Summary and Practical Use
The Volume Spike | viResearch indicator provides traders with a deeper understanding of volume dynamics, highlighting when market activity supports a move and when it signals exhaustion. By combining volume consistency, relative strength, and pattern recognition, it transforms raw volume data into actionable insights.
Use it to confirm breakout quality, detect unsustainable rallies, or identify accumulation zones before reversals occur. Sustainable trends are built on consistent participation — Volume Spike helps you see when that conviction begins to fade or surge beyond control.
Trading example: Spike volume + Oversold Commodity Index For Loop | viResearch
Note: Historical readings are for analytical purposes only and do not guarantee future performance.
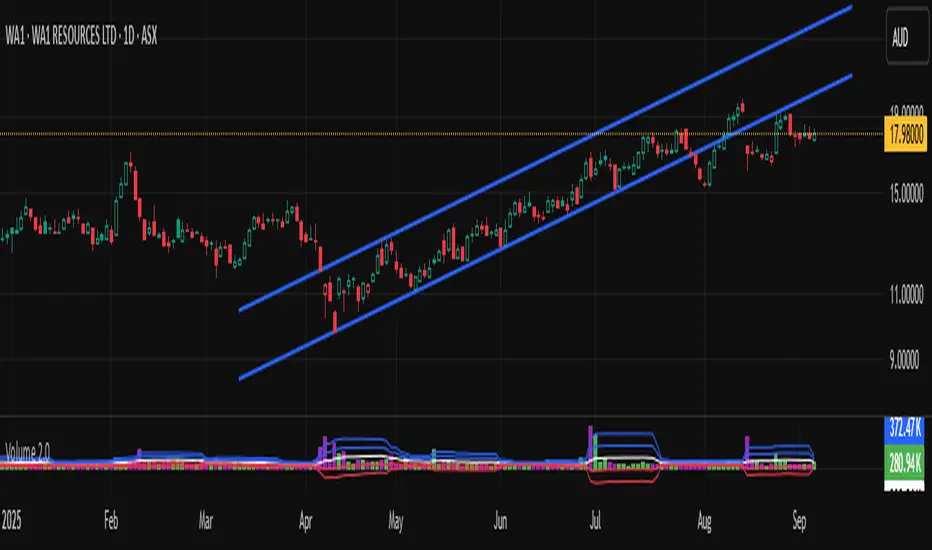
Volume 2.0Volume with standard deviations.
Helps to identify moderately high/low volume and very high/low volume.
Low volume indicates less market participation. High volume indicates higher market participation.
It forecasts potential changes of sentiment.
Volume with standard deviations (n=14).
Helps to identify moderately high/low volume and very high/low volume. Low volume indicates less market participation. High volume indicates higher market participation.
It forecasts potential changes of sentiment. This indicator has to be used with others. It is an adjunct tool, but a powerful one.
NB:
My previous version "Volume" violated the Pine Code house rules, so it got shielded from public view. This is my first experience with writing in Pine Code and publishing. I suspect it was because I didn't publish with a clean chart without other indicators added. My apologies in advance if version 2.0 is again another violation, which will then get shielded again. I am only publishing out of good will to share that's all.
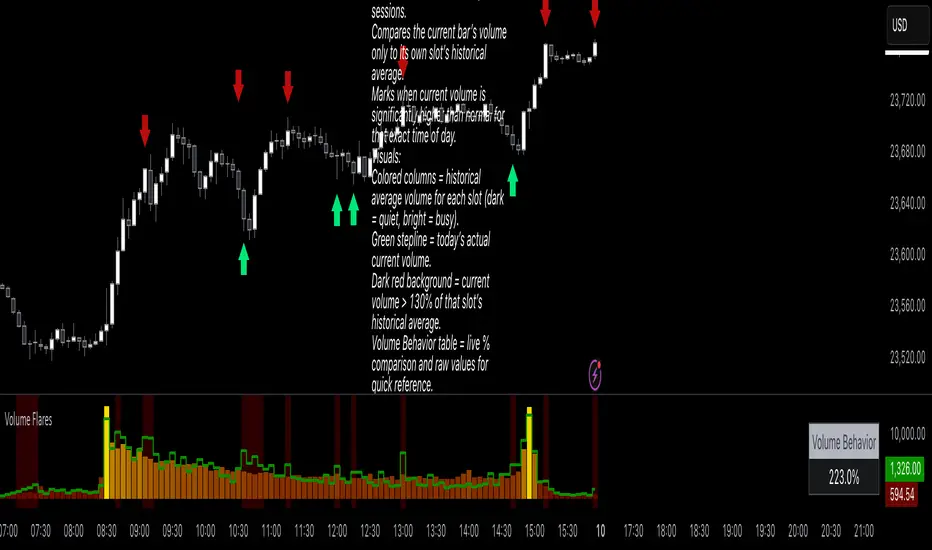
Volume FlaresVolume Flares – Spotting Abnormal Volume by Time of Day
Most volume tools compare current volume to a moving average of the last X bars. That’s fine for seeing short-term changes, but it ignores how volume naturally ebbs and flows throughout the day.
Volume at 9:35 is not the same as volume at 1:15.
A standard MA will treat them the same.
What Volume Flares does differently:
Breaks the day into exact time slots (based on your chosen timeframe).
Calculates the historical average volume for each slot across past sessions.
Compares the current bar’s volume only to its own slot’s historical average.
Marks when current volume is significantly higher than normal for that exact time of day.
Visuals:
Colored columns = historical average volume for each slot (dark = quiet, bright = busy).
Green stepline = today’s actual current volume.
Dark red background = current volume > 130% of that slot’s historical average.
Volume Behavior table = live % comparison and raw values for quick reference.
How I use it:
Red and green arrows on the price chart are manually drawn where the background turns red in the volume panel.
These often align with liquidity grabs, institutional entries, or areas where the market is “louder” than it should be for that moment in the day.
Helps filter out false urgency — high volume at the open isn’t the same as high volume in the lunch lull.
Key takeaway:
This is not a buy/sell signal.
It’s context.
It’s about spotting when the market is behaving out of character for that specific moment, and using that to read intent behind the move.
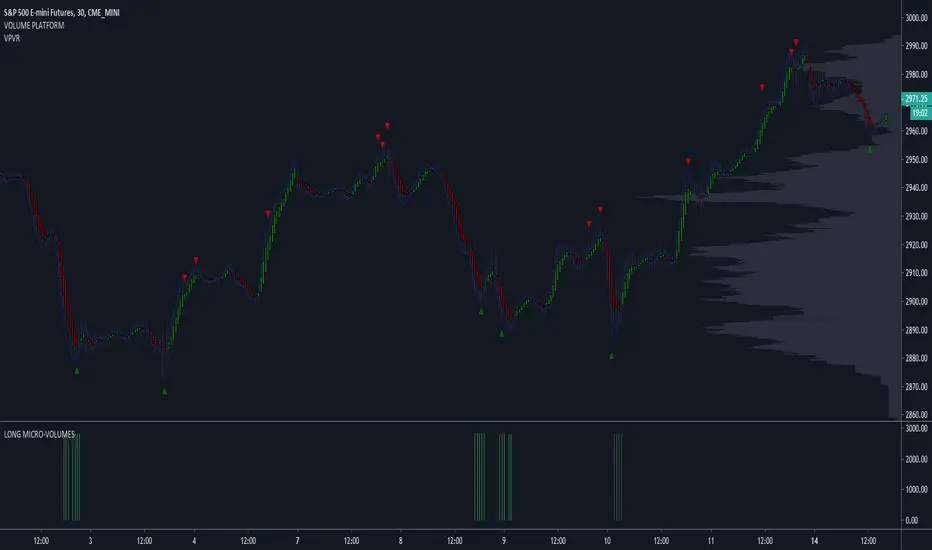
LONG MICRO-VOLUMES 3.0This script - when plotted below the chart - shows most important LONG VOLUMES during the sessions.
Volumes often anticipates turning points and/or show important support levels.
My advice is to plot volume profile too, to complete the view.
The script works with stocks, etf , commodities , futures , forex, spreads.
I use to trade with this tool looking at different time-frames in the same moment.
SHORT MICRO-VOLUMES 2.0This script - plotted on a panel above the chart - shows most important SHORT VOLUMES during the sessions.
Volumes often anticipates turning points and/or show important resistance levels.
My advice is to plot volume profile too, to complete the view.
The script works with stocks, etf , commodities , futures , forex, spreads.
I use to trade with this tool looking at different time-frames.

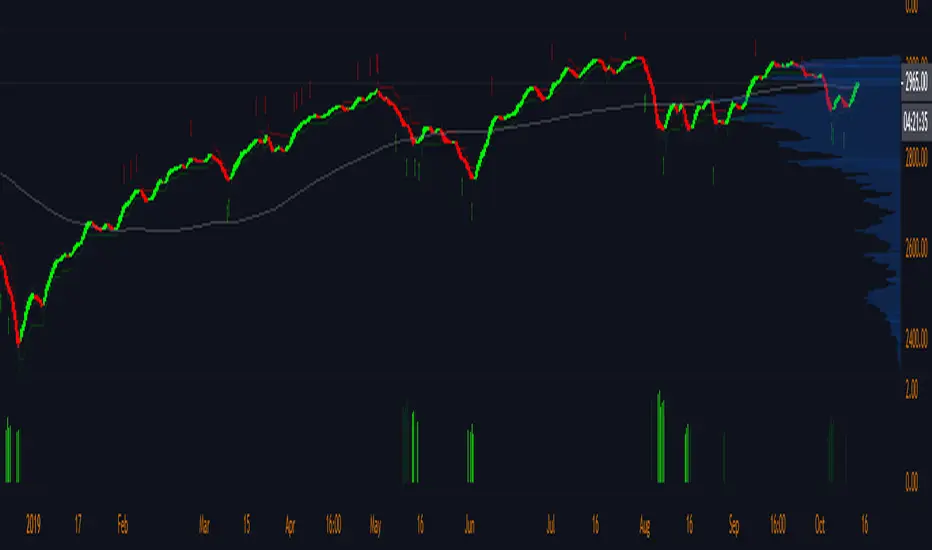
LONG MICRO-VOLUMESThis script - when plotted below the chart - shows most important LONG VOLUMES during the sessions.
Volumes often anticipates turning points and/or show important support levels.
My advice is to plot volume profile too, to complete the view.
The script works with stocks, etf, commodities, futures, forex, spreads.
I use to trade with this tool looking at different time-frames, in the same moment.
Volume Aggregated (Lite)Volume Aggregated (Lite) is a lightweight yet powerful tool designed to provide traders with a consolidated view of trading volume across major perpetual futures markets. Instead of relying solely on the volume of a single exchange, this indicator aggregates and normalizes data from multiple venues, giving a broader and more representative measure of market activity.
Supported Exchanges:
Binance (USDT.P & USDC.P)
Bybit (USDT.P & USD.P)
OKX (USDT.P & USD.P)
Bitget (USDT.P & USD.P)
Coinbase (USDC.P)
Users can toggle each exchange individually, allowing flexible customization depending on which markets they consider most relevant.
Denomination Options:
COINS: Volume expressed in the base currency (e.g., BTC, ETH).
USD: Volume normalized to USD values by multiplying with price.
Why it’s useful:
Volume is a critical component of technical analysis, reflecting market participation and conviction behind price moves. However, relying on a single exchange can create blind spots, especially in crypto where liquidity is fragmented. By combining data from multiple large exchanges, this indicator offers:
A more comprehensive measure of market interest.
A normalized comparison between exchanges with different quote currencies (e.g., USDT, USD, USDC).
A volume stream that can be used as a custom source for other indicators, strategies, or overlays within TradingView.
Practical Applications:
Trend Confirmation: Check if aggregated volume supports price direction.
Breakout Validation: Identify whether breakouts are backed by broad participation across venues.
Divergence Detection: Spot situations where price moves without sufficient cross-exchange volume.
Custom Indicator Input: Since it outputs a clean series, it can be plugged into moving averages, oscillators, or custom-built scripts.
Technical Details:
The script uses request.security() to pull volume data across exchanges and normalizes values when required (e.g., USD-quoted pairs divided by the instrument’s price). It then aggregates all valid inputs into a single stream. The result is displayed as color-coded columns (green for bullish candles, red for bearish), making it easy to interpret at a glance.
This “Lite” version keeps the focus on core functionality: aggregation, normalization, and straightforward visualization—avoiding unnecessary complexity while remaining highly adaptable for custom analysis.

Volume (Advance)Volume (Advance) displays regular volume in red and green candle.
-
Advance feature change volume bar color when volume exceeds previous input bar high volume.
-
Also it plot previous input bar volume EMA on the same chart.

Volumen Consolidado de BTCVolumen consolidado de BTC tomando en cuenta varios exchanges dónde se comercializa.

Volume Stack EmojisVolume Stack visualizes market bias and momentum for each candle using intuitive emojis in a dedicated bottom pane, keeping your main price chart clean and focused. The indicator analyzes where price closes within each bar’s range to estimate bullish or bearish pressure and highlights key momentum shifts.
Features:
Bullish and Bearish States:
🟩 Green square: Normal bullish candle
🟥 Red square: Normal bearish candle
Strong Bullish/Bearish:
🟢 Green circle: Strong bullish (close near high)
🔴 Red circle: Strong bearish (close near low)
Critical Transitions:
✅ Green checkmark: Bearish → strong bullish (momentum reversal up)
❌ Red cross: Bullish → strong bearish (momentum reversal down)
Easy Visual Scanning:
Emojis plotted in the indicator’s own pane for rapid pattern recognition and clean workflow.
No overlays:
Keeps all symbols off the main price pane.
How it works:
For each candle, the indicator calculates the percentage distance of the close price within the high/low range, then classifies and marks:
Normal bullish/bearish: Basic directional bias
Strong signals: Close is at least 75% toward the high (bullish) or low (bearish)
Transitions: Detects when the market suddenly flips from bullish to strong bearish (❌), or bearish to strong bullish (✅), pinpointing possible inflection points.
This indicator is ideal for traders who want a simple, non-intrusive visualization of intrabar momentum and key reversals—making trend reading and market sentiment effortless.

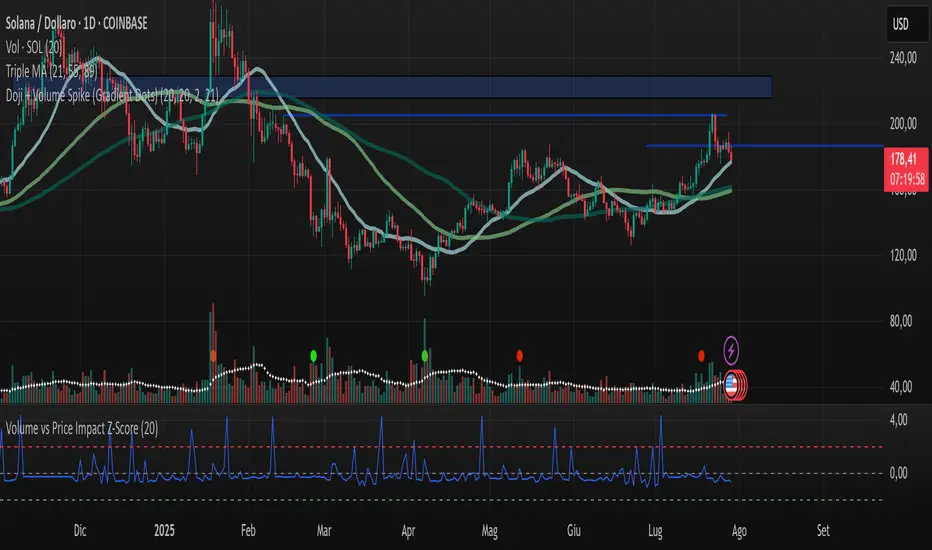
Volume vs Price Impact Z-ScoreVolume vs Price Impact Z‑Score
This indicator measures how disproportionate the traded volume is relative to the price movement of a candle.
Step 1: Volume-to-Price Impact (VPI)
VPI = Volume / (abs(Close - Open) + ε)
(or optionally using High - Low as the price range)
Step 2: Z‑Score Standardization
Z = (VPI - SMA(VPI, length)) / STDEV(VPI, length)
Interpretation:
Z > 2 → High volume with little price movement → possible absorption (accumulation/distribution).
Z < -2 → Large price move with low volume → weak or illiquid move (potential false breakout).
Use cases:
Detecting accumulation/distribution phases.
Highlighting false breakouts or weak price moves.
Supporting entry/exit decisions based on market efficiency (volume vs. price impact).
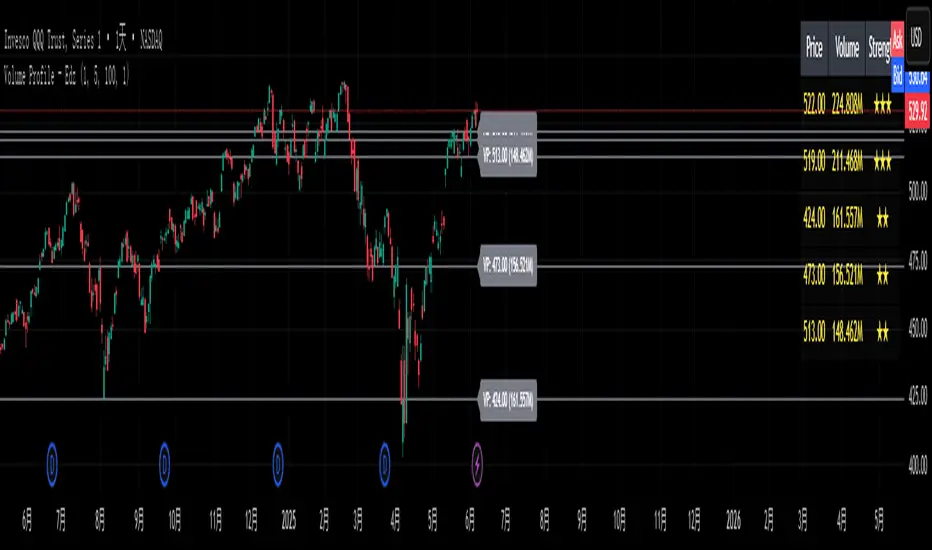
Volume Profile - EdzVolume Profile – Edz is a lightweight indicator that identifies the top high-volume price levels over a recent range of candles, using customizable price binning (priceStep) and lookback length. It highlights the top N volume clusters with horizontal lines, labels, and strength-based star ratings (★–★★★), and displays a compact summary table showing price, volume, and relative strength. Optimized for intraday and short-term trading, this tool updates only on the latest bar for maximum performance and is ideal for spotting volume-based support, resistance, and high-confluence trading zones.
Volume Candle IndicatorVolume Candle is the candle with highest volume, which usually breaking the high of that candle can trigger a potential entry if its in a good place in the chart.
and losing the low of it, can trigger a stoploss if you entered on break of the high.
Credit goes to the creator of heatvolume indicator
I added alerts on breaking the high and breaking the low
Enjoy it on your own responsibility!

Volume FlowVolume Flow
This is an indicator script based on
Calculate the trading volume through the moving average series of indicators. If the long position moving average exceeds the volume moving average, it is considered a strong long signal, if the short position moving average exceeds the volume moving average, it is considered a strong short signal.

Volume Moving AveragesVolume Moving Averages that I find more useful than volume bars, personally.
Default settings:
* Fast line = 3 day lookback
* Slow line = 10 day lookback
Enjoy.

Volume Based Supply & DemandVolume Based Supply & Demand Zone indicator compares the size of volume bars so that if there is a noticeable increase in volume (noticeable here meaning above the indicator threshold) it marks the bar high and low prior to the bigger volume candle.

