Komut dosyalarını "volume" için ara
Volume PressureThis script modified from @the_akechi's VolumePressure
The sum of buying and selling volume is NOT always equal to the total volume using the original script because the 2 columns are overlaid, not stacked

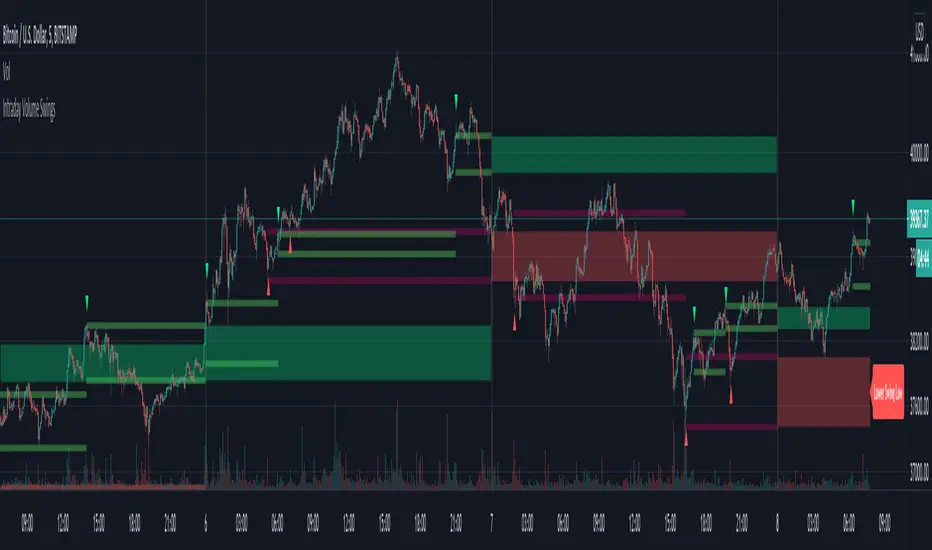
Intraday Volume SwingsVolume swings are defined as increasing volume and higher highs/lower lows over a minimum of three bars.
This script tracks volume swings over an intraday chart and stores the final lowest low swing / highest high swing over the course of the day. The final high swing and low swing are then plotted over the following day as possible retracement / support & resistance levels.
Intraday levels for the current day can also be displayed, which may or may not be the final swings for the day, but are also possible areas of interest.
See code for additional notes.
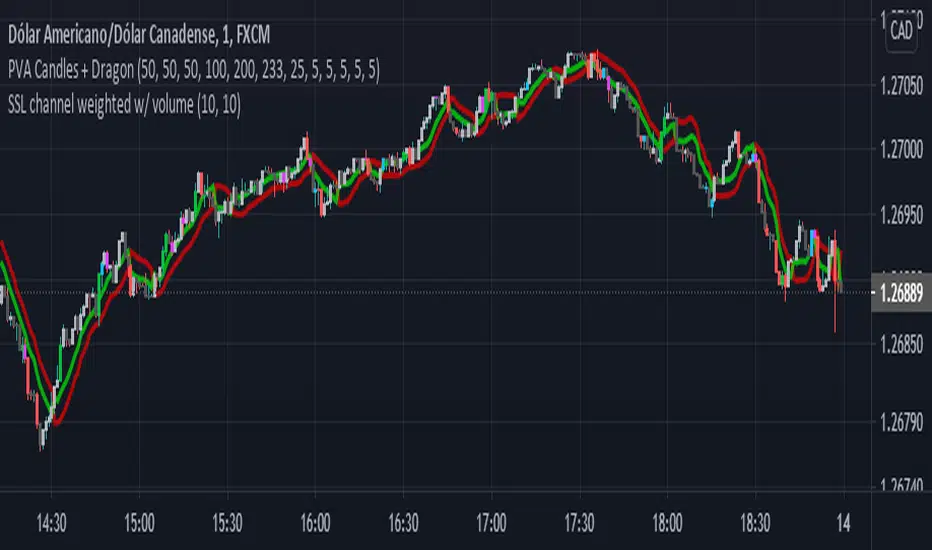
Volume Weighted SSL ChannelVolume-weighted SSl channel.
new concept of indicator that does not have in the entire library, different from SSL based on EMA or MA, this indicator can identify turns faster than a conventional indicator that only takes into account the price.
Enjoy and give the feedback.
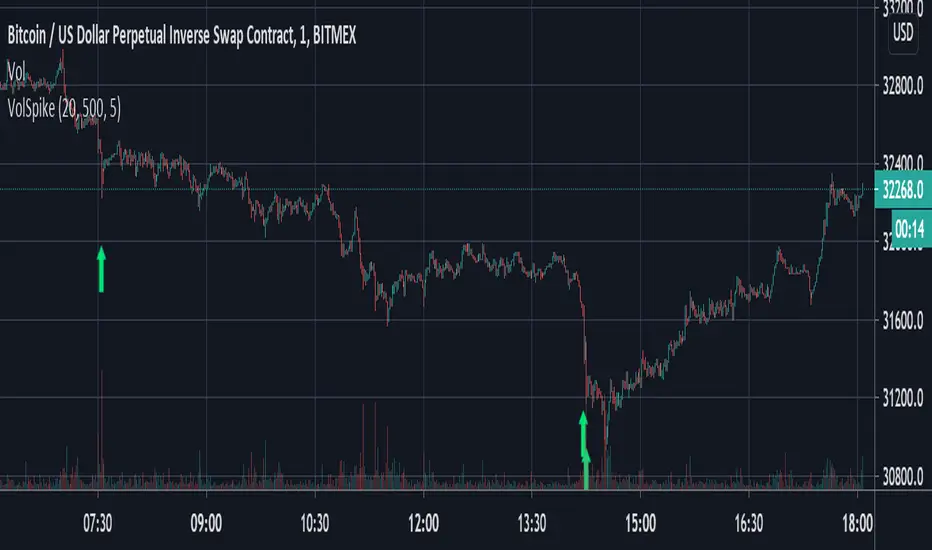
Volume Spike Strategy This is a Pine Script implementation of “Capitalize AI: Volume Spike Strategy" by Bitcoin Trading Challenge (copied with permission).
Original Capital AI formula :
If BTC/USD 1 minute volume > BTC/USD average volume in 20-1m bar by at least 500% and if BTC/USD is below the MA (5,1m,close) of BTC/USD then buy 10,000 USD WORTH of BTC/USD
Tested on XBTUSD 1 minute.
Original strategy is buy-only. Option for sells was added (enable in settings).
First published script -- comments/feedback appreciated
Volume Weighted Aggregated Premium Index v0.20.2 version of the indicator that determines the aggregate premium, weighted by volume, from all leading derivatives exchanges. The main difference was the change in the volume weighing algorithm from static to real time, and ETH was added to the indicator.
Exchanges:
Binance
OKEx
Huobi
Bybit
FTX
BitMEX
Deribit

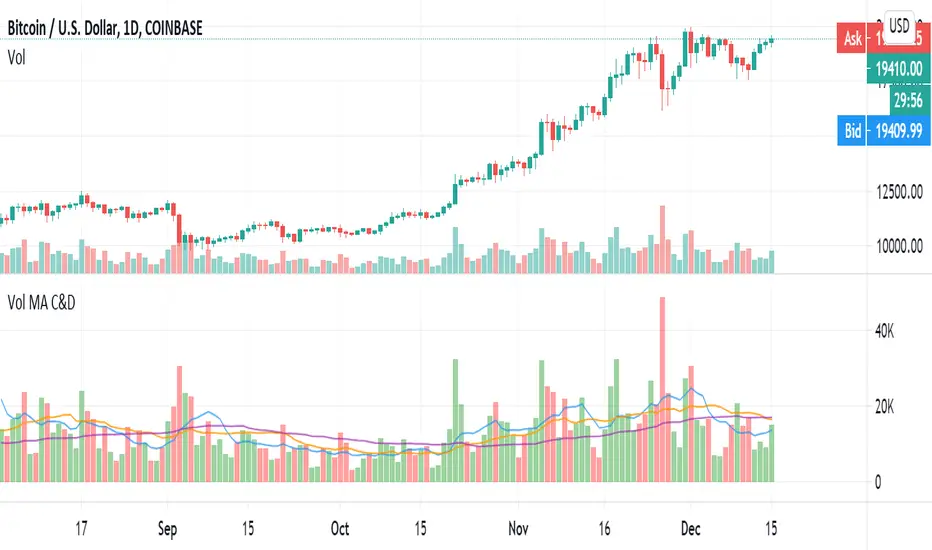
Volume MA Convergence and DivergenceGreetings, I imagine there is already some similar scripts as this one but I couldn't find one so I decided to add something.
We are looking at convergence and divergence signals of moving-average values of 3 different volume time frames. The time frames can of course be tweaked to ones liking, I set up Vol-MA8, 20 and 50. A strong enough divergence in at least 2 of the MAs may perhaps signal an exhausting trend or the beginning of a new one. Convergence of all three to a single point, or close enough to, may signal impending volatility potentially. The latter would best be complimented with another volatility predicative indicator or correlating impending price change data. There are more signals to be studied within this single indicator such as a converging occurrence above OR below the mean, etc, etc.
@OptiSean on Twitter
Enjoy, Cheers
Volume direction candles - JDThis indicator displays the inflow and outflow of money into a stock or security
and is calculated by constructing op or down candles according to the direction of price movement,
with a size corresponding to the volume size.
The ema bands can be used to find the mean total volume for the last short term and long term period
Enoy !
JD.
#DYOR
#NotTradingAdvice

volume with PriceThis script is for calculation for volume x price. Also include with target ( default =2M).
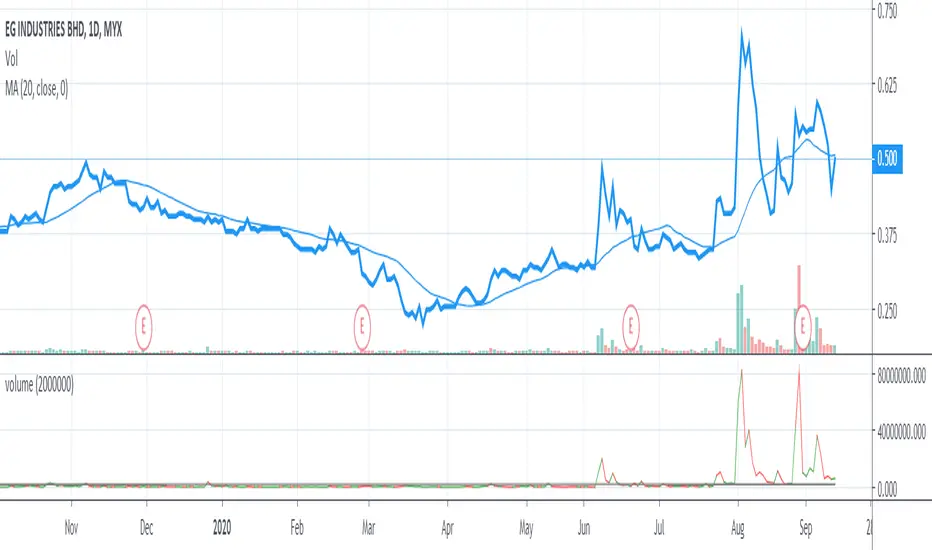

Volume Color Bar (KETT)Highlights important bars with increased volume during the selected period. It is convenient to use for building a trend line or strong levels.

Volume Moving Average - evoThis script shows regular volume bars with two separate moving averages using only bullish and only bearish candles. The moving average uses the last known value of its calculation.
Using the Heikin Ashi function will smooth the colors and moving averages (good for trends):
The crossovers are a good way to see what the dominant direction of a trend is, if you test them on your time frame and instrument they might be good to trade on their own, I have not tested this and the default settings are not tuned for that.
As always, let me know if you like it or found a good way to use it :)

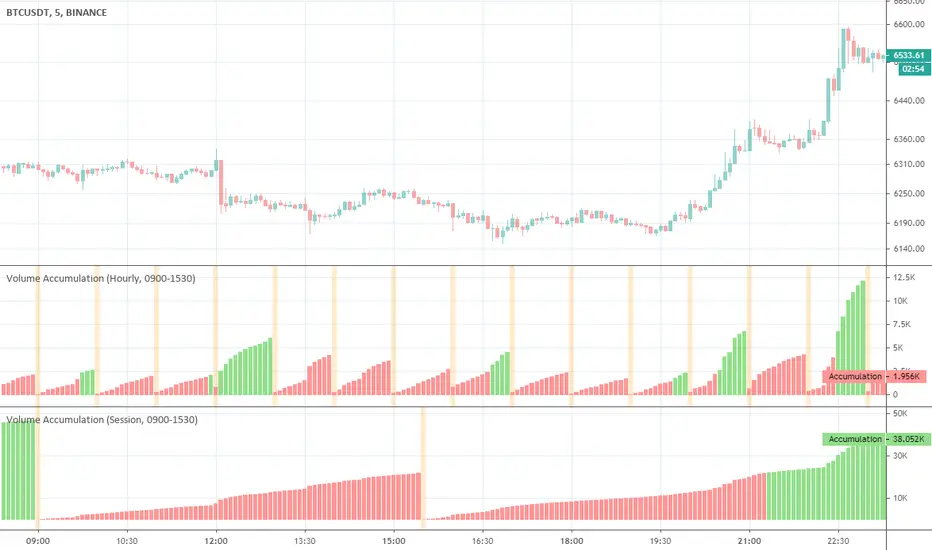
Volume AccumulationA simple tool that accumulates the trading volume of an instrument for a specified period of time.
Available modes:
Minutely
Hourly
Session
Daily
Monthly
Quarterly
Yearly
volume high standard deviation stystemOn the basis of moving average, add moving average and standard deviation line of volume to filter the entry and exit time.
Do not enter trades on high volume and price in trend direction.
Exit on high volume and price in profitable direction.
Option 0 = No entry or exit filter
Option 1 = Entry filter only
Option 2 = Exit filter only
Option 3 = Both entry and exit filters

Volume LogA comfortable Volume Indicator with the following features:
Darker colors indicate positive changes
Light colors indicate negative changes
There are separate colors for changes above a configurable threshold
The threshold can look at percentages changes in either volume (directly) or the volume at log scale.
The graph itself is always displayed in regular format so the numbers indicate real value.
All the colors, log scale as well as the threshold are configurable through the visual interface.

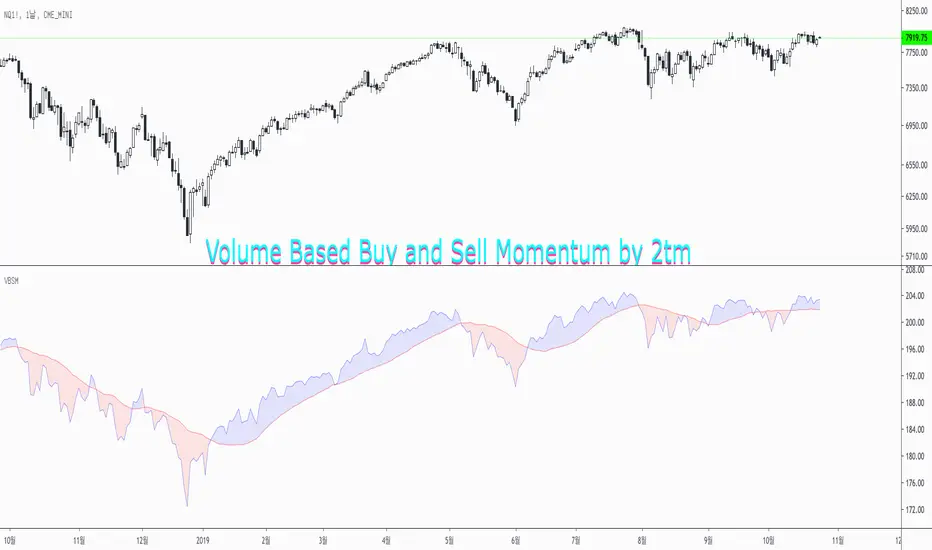
Volume Based Buy and Sell Momentum by 2tmThis is Volume based Buy and Sell Momentum script.
Basically I'd just adjusted PVI and NVI
But It's easy to understand current Volume trends and Momentums
Thank you and Wish your successful investment.
Volume ⨃ αMomentum 🦝🦾First attempt playing around with mixing volume and momentum... I find it to be nonsense, but putting it up for the moment.

Volume with directionOscillator plots cumulative volume with direction defined by price (positive price change = positive volume and vice versa) divided by volume sma.
It is good for divergence indication and can be used for trend change prediction.
It is faster then stoch with the same length.

Volume SpikeDetect current bar's volume is at least Ratio times than average volume of previous "Look back" bars.

Volume ValueInstead of the Volume this plots the closure price times volume, hence the Value.
Useful in study of long term phenomenons.
Volume @PuppyTherapyWell, you know what its Volume but I don't color it based on price but it just stays grey the moment it reaches a critical threshold level it is orange and spikes are very much red.
You can also set alerts on those spikes to make sure you are not missing the action.


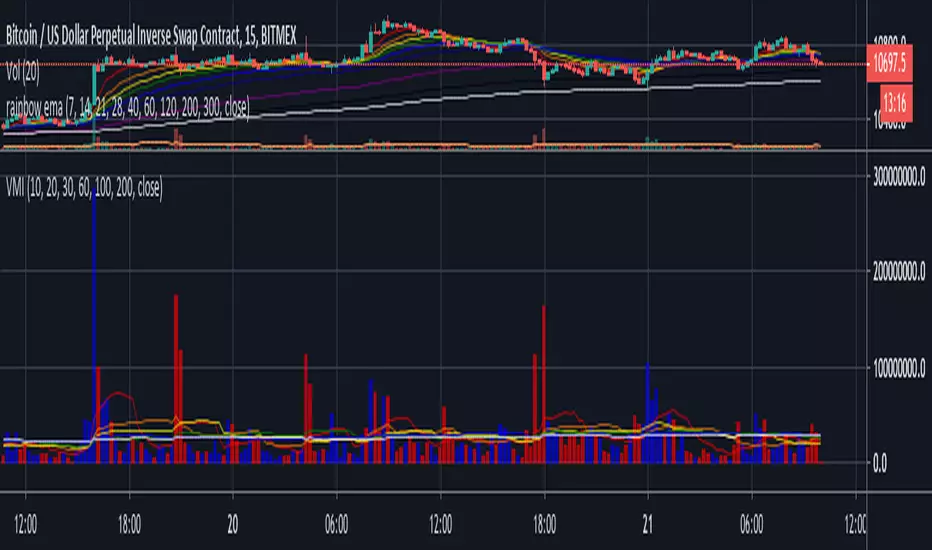
Volume moving indicatorHi guys,
This is a multiple Volume MA script. Editing is free for use.
You can use several ma lines by adding one indicator only, and I put 10,20,30,60,100,200 as a threshold which I frequently use.
It is made as an open source at any time possible, so that you are free for playing with it. Even you can add more if you are keen to do so.
Cheers,
JB