Volume Profile With HVN & LVN detectorVolume Profile Indicator
Based on the works of tradeforopp
Overview
The Volume Profile Indicator is a powerful technical analysis tool that visually represents the distribution of trading volume over price levels within a specified timeframe. It helps traders identify key support and resistance zones, high-volume trading areas, and low-volume rejection zones. The indicator includes customizable settings for Volume Point of Control (VPOC), High Volume Nodes (HVNs), and Low Volume Nodes (LVNs), making it a versatile tool for price action analysis and volume-based decision-making.
Key Features
🔹 Customizable Volume Profile
Adjustable number of rows to define the resolution of the volume profile.
Configurable timeframe aggregation for profile calculation (e.g., Daily, Weekly).
Selectable price resolution timeframe for precise profile construction.
Extendable volume profile for future sessions.
Fully customizable profile color and transparency settings.
🔹 Volume Point of Control (VPOC)
Displays the most traded price level within the selected timeframe.
Option to extend multiple VPOCs across the chart.
Adjustable VPOC line width and color customization.
Option to display VPOC labels when working with higher timeframe profiles.
🔹 High Volume Nodes (HVNs)
Identifies high-volume price levels where significant trading activity has occurred.
Configurable HVN strength to adjust detection sensitivity.
Two display modes:
Lines: Plots HVN levels as horizontal lines.
Areas: Highlights HVN regions with colored boxes.
Separate bullish and bearish HVN color settings.
🔹 Low Volume Nodes (LVNs)
Identifies low-volume price levels, which often act as rejection zones.
Configurable LVN strength to fine-tune detection.
Two display modes:
Lines: Marks LVN levels as horizontal lines.
Areas: Highlights LVN regions with shaded boxes.
Separate bullish and bearish LVN color settings.
🔹 Optimized for Performance
Efficient use of arrays for data storage and retrieval.
Global functions for HVN and LVN detection.
Uses security calls to access lower timeframe price and volume data.
Use Cases
✅ Identify Support & Resistance Levels
The indicator highlights key price levels where significant buying or selling interest exists.
✅ Detect Breakout & Reversal Zones
Low-volume areas (LVNs) often indicate price rejection zones, while high-volume areas (HVNs) suggest strong price acceptance zones.
✅ Improve Trade Entries & Exits
Traders can use the Volume Point of Control (VPOC) and volume clusters to refine entry and exit points.
✅ Enhance Price Action Strategies
By incorporating volume-based analysis, this indicator provides deeper market insights beyond traditional support/resistance and trendlines.
Customization & Settings
📌 Volume Profile Settings:
Rows: Defines the granularity of the volume profile.
Profile Timeframe: Specifies the aggregation period (e.g., Daily, Weekly).
Resolution Timeframe: Determines the price resolution for volume analysis.
Profile Extend %: Controls how much the profile extends into the next session.
📌 Volume Point of Control (VPOC):
Enable/Disable VPOC visualization.
Extend past VPOC levels to the right.
Display VPOC labels for higher timeframe profiles.
Adjustable VPOC line width and color.
📌 High Volume Nodes (HVNs):
Enable/Disable HVN detection.
Define HVN strength (volume threshold).
Choose between Line Mode or Area Mode.
Configure bullish and bearish HVN colors.
📌 Low Volume Nodes (LVNs):
Enable/Disable LVN detection.
Define LVN strength (volume threshold).
Choose between Line Mode or Area Mode.
Configure bullish and bearish LVN colors.
Komut dosyalarını "volume" için ara

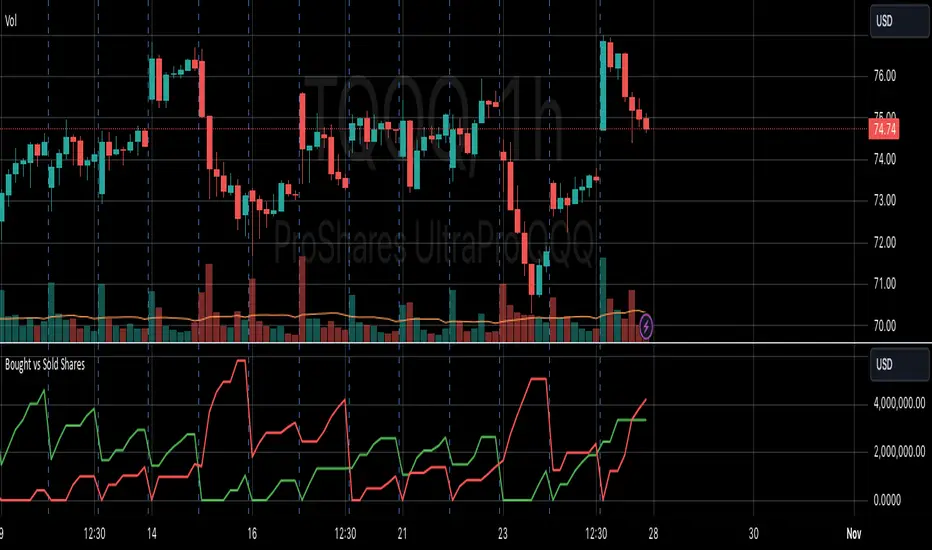
VOLUME DIRECTION INDICATORDesigned for the 1-hour chart, this indicator shows:
Green Line: Volume when price rises, suggesting buying.
Red Line: Volume when price falls, indicating selling.
How to Use:
Watch for Crossover: When the Green Line moves above the Red, it might signal a budding uptrend.
Check Retracement: If the Green Line pulls back but stays above the Red, the uptrend could be strengthening.
Price Check: Look for a small price drop but not a reversal.
Trade Entry:
Enter at the high of the retracement candle.
Or wait for the Green Line to rise again.
For Precision: Draw a line at the retracement peak and switch to a shorter timeframe to find entry patterns above this line.
Remember: Use this with other tools for better trading decisions.
The Volume Direction Indicator provides a visual representation of market activity by assuming volume can be attributed to buying or selling based on price action within each bar. When the price closes higher than it opened, the volume for that period is considered as 'Bought Shares', plotted in green. Conversely, if the price closes lower, the volume is treated as 'Sold Shares', shown in red. This indicator resets daily to give a fresh perspective on trading activity each day.
Key Features:
Buying Pressure: Green line represents the cumulative volume during periods where the price increased.
Selling Pressure: Red line indicates the cumulative volume during price decreases.
Daily Reset: Accumulated values reset at the start of each new trading day, focusing on daily market sentiment.
Note: This indicator simplifies market dynamics by linking volume directly to price changes. It does not account for complex trading scenarios like short selling or market manipulations. Use this indicator as a tool to gauge general market direction and activity, not for precise transaction data.
Volume CalendarDescription:
The indicator displays a calendar with Volume data for up to 6 last months. It is designed to work on any timeframe, but works best on Daily and below. It is also consistent in that it displays the same data even if you go to lower timeframes like 5 minutes (even though the data is used is Daily).
Features:
- displays volume data for last N months (volume, volume change, % of weekly, monthly and yearly volume)
- display total volume for each month
- display monthly sentiment
- find dates with volume spikes
Inputs:
- Number of months -> how many last months of data to display (from 1 to 6)
- Volume Type -> display only Bullish, only Bearish or all volume
- Cell color is based on -> Volume - the brighter the cell the higher volume was on that day; Volume Change - the brighter the cell the higher was the volume change that day; Volume Spike - the brighter the cell the higher was volume spike that day (volume spike is based on volume being above its average over last N candles)
- Cell color timeframe -> Weekly - the cell color is calculated comparing volume of that cell with weekly volume; Monthly - comparing volume with monthly volume
- Use volume for sentiment -> take the volume into account when calculating monthly sentiment (otherwise calculate it based on number of Bullish and Bearish days in the month)
- Spike Average Period -> period of the moving average used for spike calculation
- Spike Threshold -> current volume must be this many times greater than the average for it to be considered a spike
- Table Size -> size of the table
- Theme -> colouring of the table

Volume - Plus / Connectable [Azullian]The connectable volume plus indicator enhances your trading strategy by providing an in-depth analysis of volume data within the connectable indicator system . This tool extends beyond the scope of traditional volume analysis, enabling a comprehensive examination of market trends without the necessity for coding. As part of our range of connectable indicators , it effectively works with TradingView's input source as a signal connector , facilitating a synchronized and interactive approach. Each connectable indicator, including Volume - Plus, contributes signal weight , allowing for a detailed and nuanced analysis which then informs a connectable signal monitor, signal filter, or strategy.
█ DISTINCTIVE FEATURES
Volume - Plus is equipped with features that enhance market analysis:
• Advanced Volume Analysis: Select from sophisticated volume modes like Volume waves and Time segmented volume for comprehensive market insights.
• Customizable Periods & Sources: Adjust the volume calculation settings to align with your specific strategy, using adjustable periods and alternative data sources.
• Versatile Scoring Conditions: Utilize six different thresholds for scoring to create a tailored approach for volume-based signal generation.
• Intuitive Visual Representation: Clear visual cues on volume trends and conditions are displayed directly on your charts, aiding in decision-making.
█ UNIFORM SETTINGS AND A WAY OF WORK
Although connectable indicators may have specific weight scoring conditions, they all aim to follow a standardized general approach to weight scoring settings, as outlined below.
■ Connectable indicators - Settings
• 🗲 Energy: Energy applies an ATR multiplier to the plotted shapes on the chart. A higher value plots shapes farther away from the candle, enhancing visibility.
• ☼ Brightness: Brightness determines the opacity of the shape plotted on the chart, aiding visibility. Indicator weight also influences opacity.
• BC - Bar coloring: Color candles based on your volume settings.
• → Input: Use the input setting to specify a data source for the indicator. Here you can connect the indicator to other indicators.
• ⌥ Flow: Determine where you want to receive signals from:
○ Both: Weights from this indicator and the connected indicator will apply
○ Indicator only: Only weights from this indicator will apply
○ Input only: Only weights from the connected indicator will apply
• ⥅ Weight multiplier: Multiply all weights in the entire indicator by a given factor, useful for quickly testing different indicators in a granular setup.
• ⥇ Threshold: Set a threshold to indicate the minimum amount of weight it should receive to pass it through to the next indicator.
• ⥱ Limiter: Set a hard limit to the maximum amount of weight that can be fed through the indicator.
■ Connectable indicators - Weight scoring settings
▢ Weight scoring conditions
• SM – Signal mode: Enable specific conditions for weight scoring
○ Start: A new trend in volume starting will score
○ End: A new trend in volume ending will score
○ Zone: Continuous scoring for each candle between the start and the end.
• SP – Signal period: Defines a range of candles within which a signal can score.
• SC - Signal count: Specifies the number of bars to retrospectively examine and score.
○ Single: Score for a single occurrence
○ All occurrences: Score for all occurrences
○ Single + Threshold: Score for single occurrences within the signal period (SP)
○ Every + Threshold: Score for all occurrences within the signal period (SP)
▢ Weight scoring direction
• ES: Enter Short weight
• XL: Exit long weight
• EL: Enter Long weight
• XS: Exit Short weight
▢ Weight scoring values
• Weights can hold either positive or negative scores. Positive weights enhance a particular trading direction, while negative weights diminish it.
█ Volume - Plus - INDICATOR SETTINGS
■ Main settings
• Enable/Disable Indicator: Toggle the entire indicator on or off.
• V - Volume mode: Choose between Volume waves and Time segmented volume
• P - Period: Set a period on which the volume is calculated.
• S - Source: Choose an alternative data source for the Volume calculation.
• T - Timeframe: Select an alternative timeframe for the Volume calculation.
• C - Candletype: Choose a candletype for the alternative source.
• B - Scaling bottom: Scale volume to this bottom level
• T - Scaling top: Scale volume to this top level
• A - Moving average type: Filter and smooth with these moving average types (ALMA, EMA, HMA, RMA, SMA, SWMA, VWMA, WMA)
• L - Moving average length: Set the length for the moving average.
• M - Moving average mode: Set the moving average mode
○ Source: Set as source
○ Banded threshold: Make the threshold levels move with a moving average
■ Conditions
Set six thresholds for scoring and determine your own type of scoring mechanism
• Enable/Disable condition: Toggle a condition on or off
• Conditional direction: Choose a direction for scoring
○ Above: Volume breaches the threshold
○ Rising: Volume rises above the threshold
○ Falling: Volume falls under the threshold
○ Crossover: Volume crosses over the threshold
○ Crossunder: Volume crosses under the threshold
• TH: Set a threshold level
• BBN: Set a sentiment for your condition
○ Bullish
○ Bearish
○ Neutral
■ Scoring functionality
• For each threshold you are able to set a sentiment. Sentiment scoring is incorporated in the weight conditions as usual.
█ PLOTTING
• Standard: Symbols (EL, XS, ES, XL) Volume is plotted according to the volume mode in the seperate pane and also with bar coloring on the candle if this option is enabled.
• Conditional Settings: A larger icon appears if global conditions are met. For instance, with a Threshold(⥇) of 12, Signal Period (SP) of 3, and Scoring Condition (SC) set to "EVERY", a volume threshold signaling over two times in 3 candles (scoring 6 each) triggers a larger icon.
█ USAGE OF CONNECTABLE INDICATORS
■ Connectable chaining mechanism
Connectable indicators can be connected directly to the signal monitor, signal filter or strategy , or they can be daisy chained to each other while the last indicator in the chain connects to the signal monitor, signal filter or strategy. When using a signal filter you can chain the filter to the strategy input to make your chain complete.
• Direct chaining: Connect an indicator directly to the signal monitor, signal filter or strategy through the provided inputs (→).
• Daisy chaining: Connect indicators using the indicator input (→). The first in a daisy chain should have a flow (⌥) set to 'Indicator only'. Subsequent indicators use 'Both' to pass the previous weight. The final indicator connects to the signal monitor, signal filter, or strategy.
■ Set up this indicator with a signal filter and strategy
The indicator provides visual cues based on signal conditions. However, its weight system is best utilized when paired with a connectable signal filter, monitor, or strategy .
Let's connect the volume - plus to a connectable signal filter and a strategy :
1. Load all relevant indicators
• Load Volume - Plus / Connectable
• Load Signal filter / Connectable
• Load Strategy / Connectable
2. Signal Filter: Connect the Volume - Plus to the Signal Filter - Plus
• Open the signal filter settings
• Choose one of the five input dropdowns (1→, 2→, 3→, 4→, 5→) and choose : Volume - Plus / Connectable: Signal Connector
• Toggle the enable box before the connected input to enable the incoming signal
3. Signal Filter: Update the filter settings if needed
• The default filter mode for the trading direction is SWING, and is compatible with the default settings in the strategy and indicators.
4. Signal Filter: Update the weight threshold settings if needed
• All connectable indicators load by default with a score of 6 for each direction (EL, XL, ES, XS)
• By default, weight threshold is 'ABOVE' Threshold 1 (TH1) and Threshold 2 (TH2), both set at 5. This allows each occurrence to score, as the default score is 1 point above the threshold.
5. Strategy: Connect the strategy to the signal filter in the strategy settings
• Select a strategy input → and select the Signal filter: Signal connector
6. Strategy: Enable filter compatible directions
• As the default setting of the filter is SWING, we should also set the SM (Strategy mode) to SWING.
Now that everything is connected, you'll notice green spikes in the signal filter representing long signals, and red spikes indicating short signals. Trades will also appear on the chart, complemented by a performance overview. Your journey is just beginning: delve into different scoring mechanisms, merge diverse connectable indicators, and craft unique chains. Instantly test your results and discover the potential of your configurations. Dive deep and enjoy the process!
█ BENEFITS
• Adaptable Modular Design: Arrange indicators in diverse structures via direct or daisy chaining, allowing tailored configurations to align with your analysis approach.
• Streamlined Backtesting: Simplify the iterative process of testing and adjusting combinations, facilitating a smoother exploration of potential setups.
• Intuitive Interface: Navigate TradingView with added ease. Integrate desired indicators, adjust settings, and establish alerts without delving into complex code.
• Signal Weight Precision: Leverage granular weight allocation among signals, offering a deeper layer of customization in strategy formulation.
• Advanced Signal Filtering: Define entry and exit conditions with more clarity, granting an added layer of strategy precision.
• Clear Visual Feedback: Distinct visual signals and cues enhance the readability of charts, promoting informed decision-making.
• Standardized Defaults: Indicators are equipped with universally recognized preset settings, ensuring consistency in initial setups across different types like momentum or volatility.
• Reliability: Our indicators are meticulously developed to prevent repainting. We strictly adhere to TradingView's coding conventions, ensuring our code is both performant and clean.
█ COMPATIBLE INDICATORS
Each indicator that incorporates our open-source 'azLibConnector' library and adheres to our conventions can be effortlessly integrated and used as detailed above.
For clarity and recognition within the TradingView platform, we append the suffix ' / Connectable' to every compatible indicator.
█ COMMON MISTAKES, CLARIFICATIONS AND TIPS
• Removing an indicator from a chain: Deleting a linked indicator and confirming the "remove study tree" alert will also remove all underlying indicators in the object tree. Before removing one, disconnect the adjacent indicators and move it to the object stack's bottom.
• Point systems: The azLibConnector provides 500 points for each direction (EL: Enter long, XL: Exit long, ES: Enter short, XS: Exit short) Remember this cap when devising a point structure.
• Flow misconfiguration: In daisy chains the first indicator should always have a flow (⌥) setting of 'indicator only' while other indicator should have a flow (⌥) setting of 'both'.
• Hide attributes: As connectable indicators send through quite some information you'll notice all the arguments are taking up some screenwidth and cause some visual clutter. You can disable arguments in Chart Settings / Status line.
• Layout and abbreviations: To maintain a consistent structure, we use abbreviations for each input. While this may initially seem complex, you'll quickly become familiar with them. Each abbreviation is also explained in the inline tooltips.
• Inputs: Connecting a connectable indicator directly to the strategy delivers the raw signal without a weight threshold, meaning every signal will trigger a trade.
█ A NOTE OF GRATITUDE
Through years of exploring TradingView and Pine Script, we've drawn immense inspiration from the community's knowledge and innovation. Thank you for being a constant source of motivation and insight.
█ RISK DISCLAIMER
Azullian's content, tools, scripts, articles, and educational offerings are presented purely for educational and informational uses. Please be aware that past performance should not be considered a predictor of future results.

Volume Spread Analysis [Ahmed]Greetings everyone,
I'm thrilled to present a Pine Script I've crafted for Volume Spread Analysis (VSA) Indicator. This tool is aimed at empowering you to make smarter trading choices by scrutinizing the volume spread across a specified interval.
The script delivers a comparative volume analysis, permitting you to fix the type and length of the moving average. It subsequently delineates the moving average (MA), MA augmented by 1 standard deviation (SD), and MA increased by 2 SD. You can fully personalize the color coding for these echelons.
Volume Spread Analysis is an analytical technique that scrutinizes candles and the volume per candle to predict price direction. It considers the volume per candle, the spread range, and the closing price.
To effectively leverage VSA, you need to adhere to a few steps:
1. Ensure you use candlesticks for trading. Other chart types like line, bar, and renko charts may not yield optimal results.
2. Confirm that your broker provides reliable volume data.
3. Be mindful of the chart's timeframe. Volume analysis may not be effective on very short timeframes such as a minute chart. I recommend using daily, weekly, or monthly charts.
Another tip is to examine the spread between the price bars and the volume bars to discern the trend.
The script not only makes it easier to integrate these principles into your trading but also brings precision and convenience to your analysis.
Please remember to adhere to Tradinview terms of service when using the script. Happy trading!

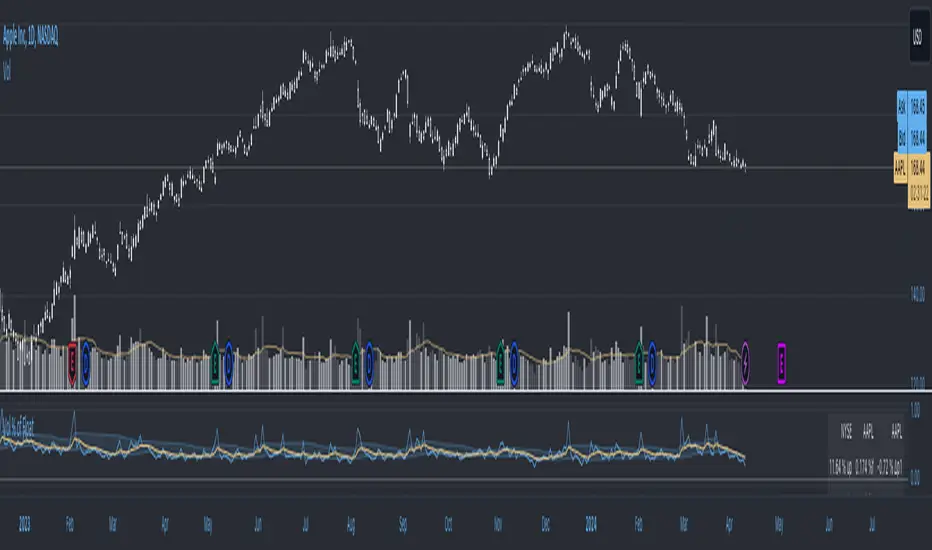
Volume as a Percent of Float by 3iauVolume as a Percent of Float
Plot the difference between current Chart Volume as a percent of Float/Outstanding and the moving average of the same.
Apply a multiplier to this value.
Plot the moving average of the difference between current Chart Volume as a percent of Float/Outstanding and the moving average of the same.
Volume [Entoryx]
Certainly! Here's a more concise description for the "Entoryx Volume" indicator, with less focus on the specifics of the order block bar detection:
The "Entoryx Volume" is a versatile technical indicator that analyzes the relationship between price ranges and volume over a user-defined number of bars. By calculating a delta between the highest high and lowest low, it offers insights into market momentum and direction.
Key features of this indicator include:
1) Current Value Plotting: A dynamic line plotted on the chart represents the current value, which reflects market trends. The color of the line changes to green for bullish conditions and red for bearish conditions, depending on its relationship with the Exponential Moving Average (EMA) of the close.
2) Color-Coded Regions: The area between the current value plot and a baseline zero line is filled with a corresponding color, providing a visual representation of market sentiment.
3) Boundary Lines: Horizontal lines at +10 and -10 serve as reference points to highlight significant market movements.
4) Order Block Bar Detection (Optional): An optional feature that places visual markers on the chart to signal potential reversals. This can be enabled or disabled by the user, according to preference.
The "Entoryx Volume" indicator is tailored for traders aiming to understand market momentum with a clear and visually intuitive display. It is suitable across various trading strategies and market conditions, with customization options to fit individual needs.
The source code for this indicator is subject to the terms of the Mozilla Public License 2.0.

Volume Bollinger BandsThis code draws a custom indicator named "Volume Bollinger Bands" on the price chart with the following visual elements:
1. **Basis Line (Blue)**: This line represents the moving average value (ma_value) of the volume data calculated based on the user-selected moving average type (SMA, EMA, or WMA) and length.
2. **Upper Bands (Green)**: The upper bands are calculated by adding a certain multiple of the standard deviation (dev1 to dev11) to the basis line. These bands represent a certain level of volume volatility above the moving average.
3. **Lower Bands (Red)**: The lower bands are calculated by subtracting a certain multiple of the standard deviation (dev1 to dev11) from the basis line. These bands represent a certain level of volume volatility below the moving average.
4. **Volume Line (Yellow)**: This line represents the volume data for the selected timeframe, plotted over the price chart.
The user can customize the following parameters:
- Average Length: The length of the moving average.
- Moving Average Type: The type of moving average to be used (SMA, EMA, or WMA).
- Timeframe: The timeframe used to calculate the volume data.
- Deviation 1 to Deviation 11: Multipliers for calculating the upper and lower bands.
The purpose of this indicator is to visually represent the relationship between volume volatility, moving average, and price movements. Traders can use it to analyze changes in volume trends and potential price breakouts or reversals when the volume moves beyond certain levels of standard deviations from the moving average.

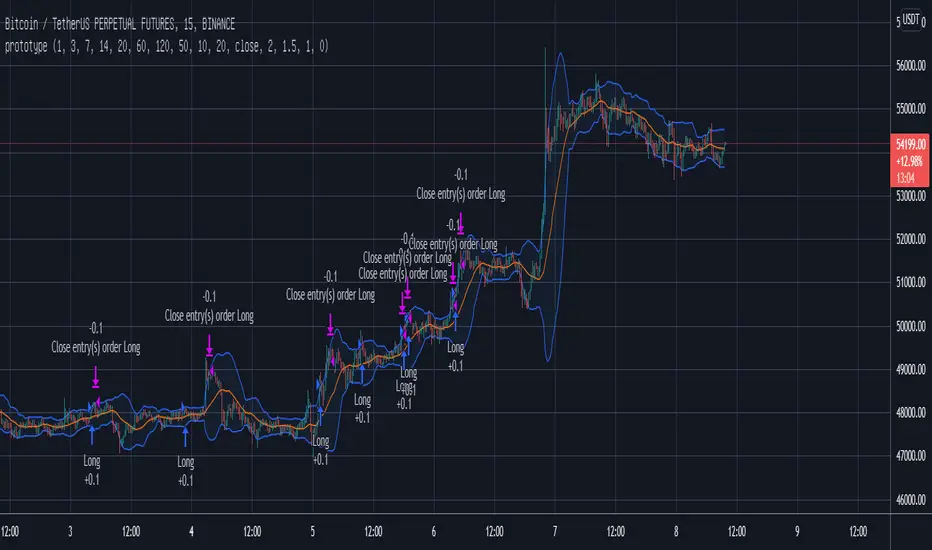
Volume ValueWhen VelocityTitle: Volume ValueWhen Velocity Trading Strategy
▶ Introduction:
The " Volume ValueWhen Velocity " trading strategy is designed to generate long position signals based on various technical conditions, including volume thresholds, RSI (Relative Strength Index), and price action relative to the Simple Moving Average (SMA). The strategy aims to identify potential buy opportunities when specific criteria are met, helping traders capitalize on potential bullish movements.
▶ How to use and conditions
★ Important : Only on Spot Binance BINANCE:BTCUSDT
Name: Volume ValueWhen Velocity
Operating mode: Long on Spot BINANCE BINANCE:BTCUSDT
Timeframe: Only one hour
Market: Crypto
currency: Bitcoin only
Signal type: Medium or short term
Entry: All sections in the Technical Indicators and Conditions section must be saved to enter (This is explained below)
Exit: Based on loss limit and profit limit It is removed in the settings section
Backtesting:
⁃ Exchange: BINANCE BINANCE:BTCUSDT
⁃ Pair: BTCUSDT
⁃ Timeframe:1h
⁃ Fee: 0.1%
- Initial Capital: 1,000 USDT
- Position sizing: 500 usdt
-Trading Range: 2022-07-01 11:30 ___ 2023-07-21 14:30
▶ Strategy Settings and Parameters:
1. `strategy(title='Volume ValueWhen Velocity', ...`: Sets the strategy title, initial capital, default quantity type, default quantity value, commission value, and trading currency.
↬ Stop-Loss and Take-Profit Settings:
1. long_stoploss_value and long_stoploss_percentage : Define the stop-loss percentage for long positions.
2. long_takeprofit_value and long_takeprofit_percentage : Define the take-profit percentage for long positions.
↬ ValueWhen Occurrence Parameters:
1. occurrence_ValueWhen_1 and occurrence_ValueWhen_2 : Control the occurrences of value events.
2. `distance_value`: Specifies the minimum distance between occurrences of ValueWhen 1 and ValueWhen 2.
↬ RSI Settings:
1. rsi_over_sold and rsi_length : Define the oversold level and RSI length for RSI calculations.
↬ Volume Thresholds:
1. volume_threshold1 , volume_threshold2 , and volume_threshold3 : Set the volume thresholds for multiple volume conditions.
↬ ATR (Average True Range) Settings:
1. atr_small and atr_big : Specify the periods used to calculate the Average True Range.
▶ Date Range for Back-Testing:
1. start_date, end_date, start_month, end_month, start_year, and end_year : Define the date range for back-testing the strategy.
▶ Technical Indicators and Conditions:
1. rsi: Calculates the Relative Strength Index (RSI) based on the defined RSI length and the closing prices.
2. was_over_sold: Checks if the RSI was oversold in the last 10 bars.
3. getVolume and getVolume2 : Custom functions to retrieve volume data for specific bars.
4. firstCandleColor : Evaluates the color of the first candle based on different timeframes.
5. sma : Calculates the Simple Moving Average (SMA) of the closing price over 13 periods.
6. numCandles : Counts the number of candles since the close price crossed above the SMA.
7. atr1 : Checks if the ATR_small is less than ATR_big for the specified security and timeframe.
8. prevClose, prevCloseBarsAgo, and prevCloseChange : ValueWhen functions to calculate the change in the close price between specific occurrences.
9. atrval: A condition based on the ATR_value3.
▶ Buy Signal Condition:
Condition: A combination of multiple volume conditions.
buy_signal: The final buy signal condition that considers various technical conditions and their interactions.
▶ Long Strategy Execution:
1. The strategy will enter a long position (buy) when the buy_signal condition is met and within the specified date range.
2. A stop-loss and take-profit will be set for the long position to manage risk and potential profits.
▶ Conclusion:
The " Volume ValueWhen Velocity " trading strategy is designed to identify long position opportunities based on a combination of volume conditions, RSI, and price action. The strategy aims to capitalize on potential bullish movements and utilizes a stop-loss and take-profit mechanism to manage risk and optimize potential returns. Traders can use this strategy as a starting point for their own trading systems or further customize it to suit their preferences and risk appetite. It is crucial to thoroughly back-test and validate any trading strategy before deploying it in live markets.
↯ Disclaimer:
Risk Management is crucial, so adjust stop loss to your comfort level. A tight stop loss can help minimise potential losses. Use at your own risk.
How you or we can improve? Source code is open so share your ideas!
Leave a comment and smash the boost button!

Volume accumulation [TCS] | VTAThe indicator calculates buy and sell volume values for different look-back periods, based on the high, low, close, and tick volume data of the chart.
The calculated buy and sell volume values are stored in separate variables, which represent cumulative volume values over the respective look-back periods.
It's important to note that the code provided calculates the buy and sell volume values individually for each look-back period and after sum them.
It can be useful to understand who is in control of the market based on the look-back period.
For example if the price is decreasing but the volume in the past candle are bullish it means that the trend probably will turn.
Please note that this indicator is for educational purposes only and should not be used for trading without further testing and analysis.

Volume Flow OscillatorIntroducing the "Volume Flow Oscillator" indicator, a powerful and adaptable tool that incorporates the PeacefulIndicators library to analyze price movement strength and volume in the market. This indicator is designed to assist you in detecting potential opportunities and improving your trading analysis.
The Volume Flow Oscillator indicator offers the following features:
Adjustable input parameters, allowing you to modify the source (HLCC4 by default) and the short length to match your trading style and preferences.
A visually appealing display, with the Volume Flow Oscillator line in orange, a zero line in gray, and filled areas between the 70 and -70 levels in blue, making it easy to interpret the indicator's signals.
The core functionality of the Volume Flow Oscillator indicator is powered by the volume_flow_oscillator function from the PeacefulIndicators library, ensuring accurate and reliable results.
To start using the Volume Flow Oscillator indicator in your trading analysis, simply add the script to your chart and customize the input parameters as needed. We hope this script, built upon the PeacefulIndicators library, proves to be a valuable addition to your trading strategy.

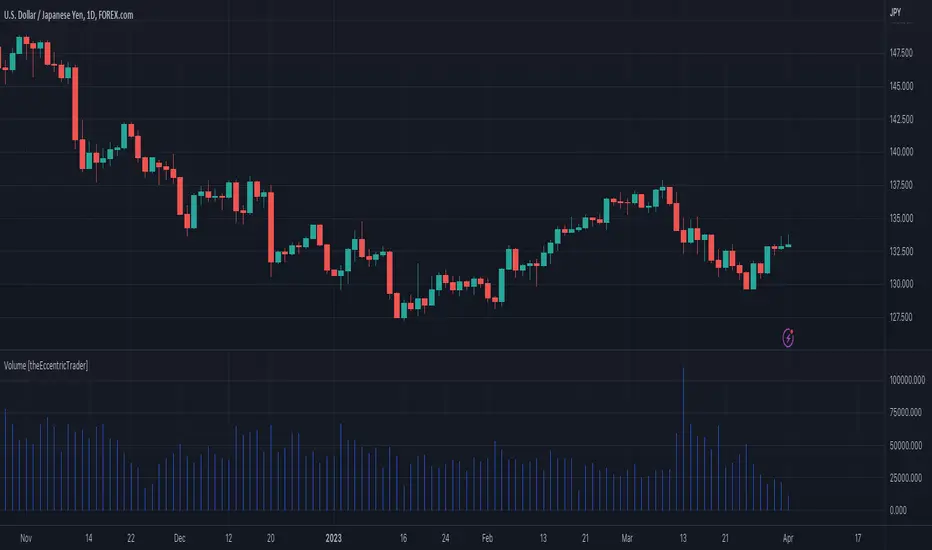
Volume [theEccentricTrader]OVERVIEW
This indicator simply bridges the gap between symbols from brokers that provide volume data and symbols from brokers that do not provide volume data. Users can select any symbol that provides volume data from the settings menu and the volume data will be displayed in histogram form on their current chart. The default volume symbol is CURRENCYCOM:US500.
CONCEPTS
Volume
Volume refers to the total number of shares or contracts that are traded during a given period of time. It is a measure of the amount of activity in the market and can be used to gauge the strength or weakness of a particular trend.
Volume is typically displayed as a histogram on trading charts, with each bar representing the total volume for a particular time period. High volume bars indicate a lot of trading activity, while low volume bars indicate relatively little trading activity.
Traders use volume in a number of ways. For example, they may use it to confirm a trend. If a stock is trending up and the volume is also increasing, this can be seen as a sign that the trend is strong and likely to continue. Conversely, if a stock is trending down and the volume is also increasing, this can be seen as a sign that the trend is weak and may be coming to an end. Volume can similarly be used to identify potential reversals. If a stock is trending up but the volume starts to decrease, this could indicate that the trend is losing momentum and that a reversal may be imminent.
FEATURES
Inputs
• Volume Symbol
Style
Users can change plot color and style from the default Style menu if so required.
NOTES
For 24-hour markets and forex volume I use the broker currency.com. As can be seen in the example above, I am using CURRENCYCOM:USDJPY to pull volume to a FOREXCOM:USDJPY chart, which otherwise would not show volume data as forex.com do not provide it.
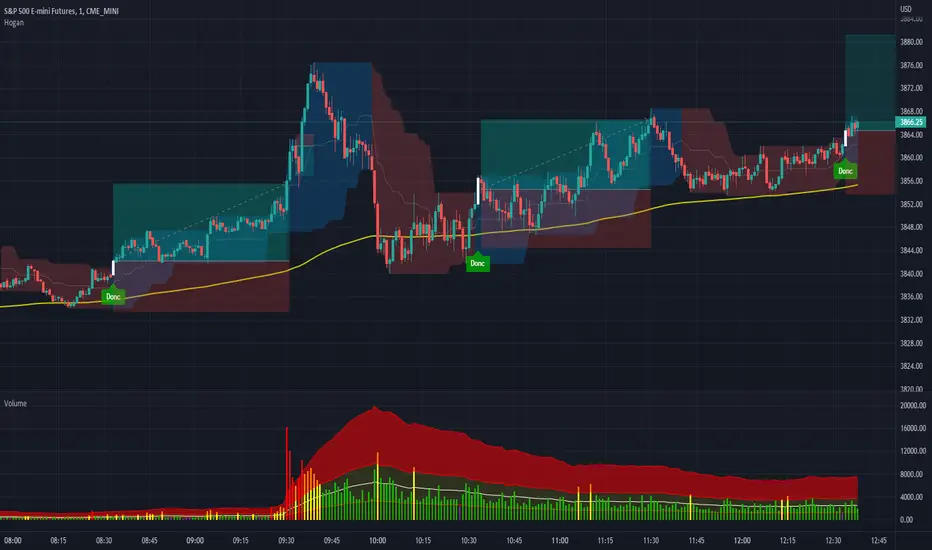
Volume+ (Time of Day)This volume indicator measures the volume for each bar at the time of day and displays the average and +1 standard deviation above that average.
The color intensity of the bar is increased when the volume exceeds +1 standard deviation.
See how on the chart that other than the early morning and late day volume, there are clearly key moments in the day at 7am, 10am, 10:30am, and 11am. See how on the second day, there were volume spikes before 10am, 10:30am and then more obviously just before 11am.

Volume Profile Channel [CE]Volume Profile Channel
Volume Profile Channel, Is the first of its kind tool that will plot a volume profile in any directional channel, the tool will calculate a profile and display the following, POC/VAH/VAL.
The typical profile works by on a horizontal access such that ticksize can be calculated along the y axis and data can then be used to generate a profile, the angle of a parallel channel would make this unavailable.
By cleverly using the angle at which the profile is created, a diagonal ticksize is generated and applied to the profile to create a first of its kind parallel channel volume profile tool!
User Controllable Width:
As compared to the above or below images, users have the ability to control the width this will allow them to show how much of the space the profile will draw on the chart with, using the value "0"
can be done to completely remove the profile whilst still tracking the POC,VAH,VAL
0 Width:
Users can the total number of rows,
Number Of Rows 50:
Ability to "anti-alias" the profile as well below will show a comparison of this occurring:
Unsmoothed
Smoothed
The advantage of using this is that as opposed to relying datasets of mid points or custom equal values along a parallel channel , users can now use the profile to see where the channel has the most interaction, (POC).
This allows for an objective look into the data as opposed to identifying by "eye" where traders are exchanging hands or vs using values such as the midpoint which may not necessarily always be a point of interest as the POC will be.
The VAH/VAL levels give good opportunity to see reactions at levels we may not previously be able to see in the channel with fixed values, allowing us to take positions in a more dynamic sense which may not be identifiable with fixed positions, 0.25,0.5,0.75 etc...

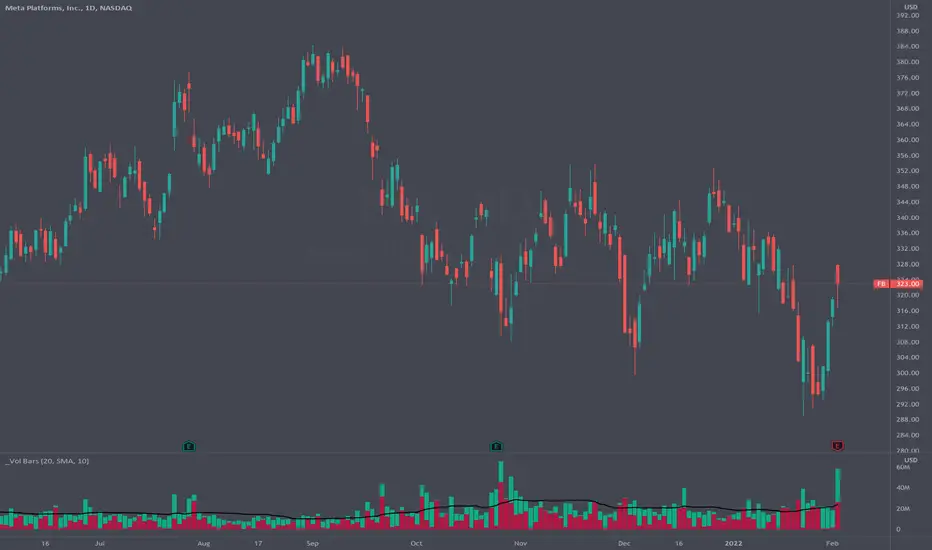
Ross Givens VolumeVolume is probably the most overlooked indicator by new traders. The buying and selling activity of large funds and institutions is the main driver of stock prices, and recognizing this activity is crucial to identifying future price movements.
This script has several elements not found in standard volume indicators:
POCKET PIVOTS
Pocket Pivots are the work of Gil Morales and Chris Kacher - authors of "Trade Line an O'Neil Disciple."
A pocket pivot is an up day with volume that is greater than the highest down volume day of the last 10 down days. These are also referred to as "10-day pocket pivots ."
A pocket pivot is not a buy signal by itself. But this is a constructive sign for a stock coming out of a base or wedging pattern. When a stock is trading in a tight consolidation range and then breaks out above resistance to a new high, I like to see a pocket pivot to give confirmation for the move.
VOLUME MOVING AVERAGE
There is a simple moving average applied to the volume chart. By default, it is set to a period of 50.
This line is a quick way to see how much volume a stock sees on average and whether or not the current volume is above or below that level. The moving average is white by default, so you will want to change the color if your charts have a light background.
HIGHEST UP VOLUME IN A YEAR
When a stock sees its highest up volume in a year or more, this is a strong indication of heavy institutional buying. This script looks back at the last 252 daily candles (there are 252 trading days in a year) and paints the candle fucshia if it has the highest up day volume over that period.
The color and time period can be changed in the settings. Volume on down days are not factored into the equation since we are only looking for the heaviest buying day of the last year.
NOTE: This feature will only display on a daily chart.
UP/DOWN VOLUME RATIO
The up/down volume ratio compares up versus down volume . Specifically, it calculates the total volume on advancing days vs the total volume on declining days over the last 50 sessions.
The ratio is displayed in a small table in the upper right corner of the volume indicator panel. A ratio above 1.0 is a bullish sign and will paint the cell green, while a ratio below 1.0 will paint red as a bearish signal.
AVERAGE $ VOLUME
Another cell in the upper right corner of the indicator displays the average daily trading volume in dollars. This is simply the average daily volume multiplied by the price of the stock.
The Average $ Volume will quickly tell you how much money trades through a stock in a given day. Investors trading larger size can see if the stock is too thin to handle their usual position size.
VOLUME COLORS
- Pocket pivots are BRIGHT GREEN
- Regular up volume days are GREEN
- Down volume days are RED
You have the option to change these colors in the settings. You can also toggle on or off the Moving Average, Pocket Pivots , Highest Volume Up Day, U/D ratio, and Avg $ Vol.
Please leave any questions you have in the comment section and I will do my best to answer them.

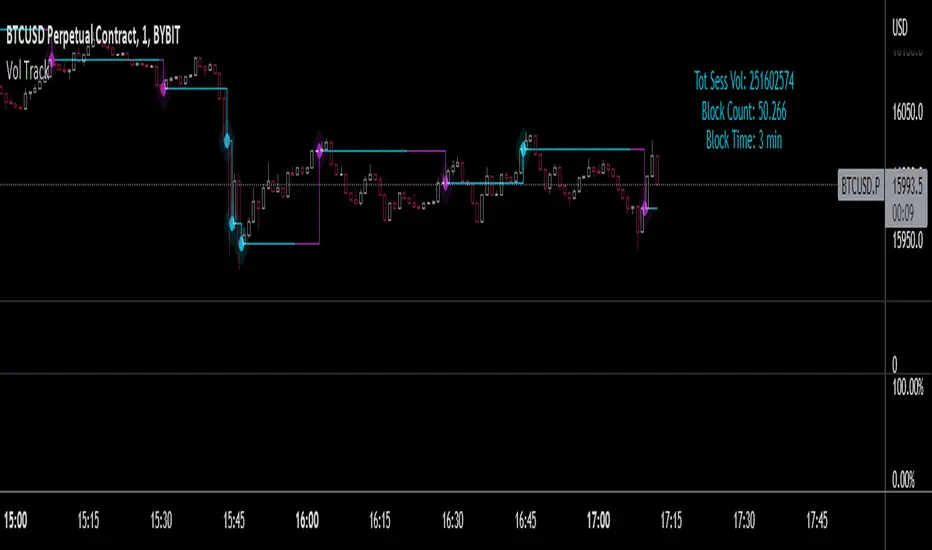
Volume Block Tracker- This script was developed to accompany order flow analysis on other platforms where volume candle charts can be tracked.
- The plot shows where volume blocks of a certain size have been completed, and a color change shows when they are getting close to completion.
- The accumulative volume count starts from zero at the beginning of each daily session.
- Alerts can be set for when each volume block is completed (or is partially completed).
- Alerts can also be set for when blocks are completed within a certain time such as fast 1 minute blocks.
- The indicator is optimized for use with BTCUSD but may work with others.
Volume/Market ProfileVolume/Market Profile is a 2 in 1 Volume Profile and Market Profile Indicator.
This indicator is my own calculations for compiling a volume profile and market profile.
The profile is progressively calculated live as the chart develops.
I have made use of both Boxes AND Lines to allow me to display a finer granularity profile by displaying up to twice the max amount of lines allowed in tradingview.
I have spent a lot of time to make sure the values are getting appended exactly as intended so that I can assure this profile is operating as precisely as possible within the limitations of the data available.
To make my calculations easier to use in other places, I have made my volume profile a function that can be extracted and used whenever you need values from a volume profile.
Feel free to read through the script if you don't understand how this profile is developed. I have made a commentary of my volume profile function to help you understand what exactly happens to compile the profiles.
As mentioned before, This indicator doubles as a market profile. To view both at the same time you will need to add the indicator on your chart twice.
I have built in comprehensive customizations to allow you to display your profiles however fits your needs.
Timeframe: The aggregation period for profiles, to see a 1 week profile, change the timeframe to 1 week.
Note: You can add custom timeframes by adding a custom timeframe in your chart timeframe dropdown menu. When you add timeframes in this area, they appear as options within indicators with the timeframe input.
Sensitivity: Allows for greater or less granularity changes. The calculation method for granularity automatically changes depending on the range of your chart.
Note: Multiply this value by 100 and that will be the max range (in ticks) of your price before the indicator automatically adjusts to make the profile less granular. (ex. If price ranges $1, and 1 tick is $0.01, granularity will be 0.01 with a sensitivity of 1+)
Value Area %: % of total volume to display as the value zone. (_% of total profile values are contained within the value zone)
Calculate as Market Profile: Uses a 1 Instead of the candle volume, to display a Market Profile. (If selected POC -> TPOC)
Display Size: Sets the # of bars from the profile axis to the profile's max value. If set negative, profile will be displayed left of axis, if positive, profile will be displayed to the right of the axis.
Display Offset: Sets the # of bars in front(or behind) the current chart bar to set the axis of the profile. If negative, the axis will be to the left of the current chart bar, if positive the axis will be right of the current chart bar.
Display Historical POC/VAH/VAL: Choose to display historical poc,vah,val lines.
Colors: I'm not explaining colors.
Enjoy!

Volume Spread for VSA CustomHey everyone, I have been using volume a lot more lately as price action can sometimes get manipulated but volume shows us the truth!
Anyways, I have enjoyed the Volume Spread for VSA indicator but wished I had the code to change a few settings. This volume indicator includes spread analysis with the ability to customize input values and I'm making it open source so you can do with it as you please.
I have made notes all throughout the code to give suggestions on a few changes or why I have written it in such a way. I have also tried to section everything off to make it easier to see where each piece of the code is used. Overall I think it is a good example of how to code cleanly and how to add useful notes when you are learning Pine for yourself :D
The indicator on the price chart is my Donchian Channel indicator, which you can also find on my profile. This is the one I use every day.
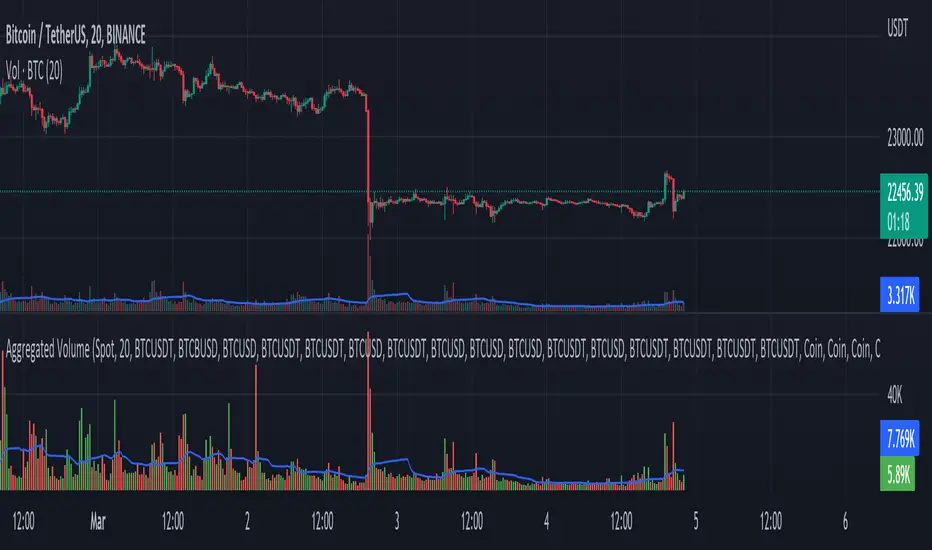
Aggregated Volume - By InFinitoVolume indicator that works like a normal Volume indicator with the following additional features:
- Aggregates Volume across different exchanges and Market Types - *Original Aggregation Code By Crypt0rus*
- Displays data by Market Type and combinations of Market Types (Spot, Futures , Perpetuals, Futures+Perpetuals & All Volume )
- Allows for the user to select the exchanges from which to aggregate Volume (This allows for the aggregation of any other pair i.e ETH, SOL, LUNA)
- Normalizes the Volume reported through TradingView by every exchange in order to homogenize the data (i.e Binance reports Bitcoin Volume in BTC terms BUT FTX reports Bitcoin Volume in USD)
- Allows for manual input of how Volume is reported in a particular Pair/Exchange (i.e If you want to aggregate data from the BTCEUR pair, you can select 'Other' and introduce the Value of EUR in USD terms)
COIN: Select this option if the volume is reported in terms of the asset traded ( BTC , ETH, SOL, etc....)
USD: Select this option if the Volume is reported in terms of the USD amount traded
OTHER: Select this option in case the Volume is reported in another currency (EUR, ETH, etc....)
NOTE: *ALL VOLUME IS AGGREGATED IN TERMS OF THE ASSET TRADED, FOR EXAMPLE IN THIS CASE: BTC . BUT IF YOU'RE AGGREGATING BNB PAIRS, VOLUME WILL BE CALCULATED TO BE DISPLAYED IN BNB TERMS*
Feel free to leave suggestions/questions in the comments or to message them directly to me
Volume Pressure BarsDescription
This indicator transforms the normal volume bars into buying and selling segments. This allows the user to easily see how much buying and selling pressure is occurring on any given timeframe. The buying and selling pressure values are calculated using the following equations:
buyingPressure = volume * (close - low) / (high - low)
sellingPressure = volume * (high - close) / (high - low)
Moving Average Line
Also included in this indicator is the optional moving average line. This allows the user to easily see if volume is above or below the average line. All aspects of the moving average line can be adjusted. The line can be toggled on & off, the length of the moving average can be adjusted, the mathematical smoothing function can be chosen, and the color & style of the line can be configured.
Scaling
If the volume pressure bars are displayed on the same “pane” as the price candles, then the volume bars can be scaled up or down. In the Input settings check the “Scale Bars” checkbox. Then increase the “Scaling Factor” number to make all of the volume bars smaller (to allow more room on your chart) or decrease the number to make the volume bars bigger.
IMPORTANT NOTE #1: scaling only works when the volume pressure bars are in the same pane as the price candles. If the volume pressures bars are in their own pane, then the “Scale Bars” toggle has no effect.
IMPORTANT NOTE #2: if the volume pressure bars are in the same pane as the price candles then there will be a sizable gap between the bottom of the volume bars and the time axis on the TradingView chart. This IS NOT a bug in this indicators code. The gap IS a bug in the TradingView platform that affects all volume indicators besides the default volume indicator that comes with each blank chart. To remove the gap then move the “_Vol Bars” indicator to its own pane above or below the main pain.
Volume Numbers
In Pine Script there is not a true stacked bar chart plot. What the author has to use are multiple bar charts that are in front and behind each other. This gives the impression that the bars are truly stacked because the selling pressure is always smaller than the total volume on any given bar. There is no issue to visually look at the bars and see their heights but if the user used their cursor to hover on a bar to get the actual volume pressure values it leads to issues. To address this problem the author has created a third invisible bar called “Buy Vol Label” that is the buy pressure volume value. Thus when the user hovers the cursor over a bar the first value (from left to right) is the total volume for the bar, the second value is the sell pressure, the third value is the buy pressure, and the fourth value (if toggled on) is the moving average value.
Volume based support resistance with SwingThere has been an endless debate on how to derive volume levels on the Price Action
One such method which I have encountered (being pointed by one of my followers Anjan Gadade)
is to take the (High+Low+close)/3, as an ambient level when volume is above average (sma20) and also when volume is above its Standard Deviation 2
To make sense of the volume level structure I tested it with Swing points, for extra confluence, and i must say, this can be used as a good indication of trend if combined together
So I thought to open Source it, to people who might be looking for a much visual Interpretation!
Enjoy!
Volume Difference Delta Cycle OscillatorVolume Difference Delta Cycle Oscillator indicator:
Using the power of my Volume Difference Indicator and standard deviations based on Bollinger Bands and more, we present this wonderful indicator with the following features:
Price Action Histogram: This is the bread and butter of this graph, if the PAH is above 0, this is considered a BULL cycle, and if below 0, this is considered a BEAR cycle. The histogram will move up and down based on the Histagram settings you set in the properties field. Be careful, we advise using default settings.
Custom Overbought & Oversold Lines:mean
These lines can be used to identify when to buy and sell the security, and help you make sense of the action of the histogram. Change the color, size, and linewidth!
These lines are what are used to perform the trades with the strategy as well, so if you change them, they will make an impact on the strategy itself.
EzSpot Background:
Do you want to turn your brain off and just trade when you you're inside an Overbought or Oversold line? Awesome! Turn on EzSpot backgrounds, and when it's green, go long, when it's red go short! Simple as that!
How it works:
By taking the Delta of the Volume Difference Indicator we're able to find the rate of change of the amount of change of volume, allowing us to see changes in volume before price changes. To add onto these, we supercharge it by taking the output of this line as the input source of bollinger bands which we use to output the %B of the Delta of the Volume Difference Indicator.
Separately, we calculate the %B of the current close to use later.
The final step is taking the second %B (which is an indication of where price lies on the curve of historical price data), and from it subtract the first %B, which allows us to visualize the standard deviation of the closing price, minus the standard deviation of Delta of the Volume Difference , which in essence allows us to see when volume changes but price does not and vice versa.
This final output is then plotted along with an over bought and over sold line, which we use to perform our trades on.
Simplified: This indicator shows the cycles of price action - volume based on the rate of the rate of volume changes based on price and the closing price.
Super Simple: Notice when volume increases but price hasn't, and vice versa with this indicator.

Volume and Moving average,will this model working in real-trade?i`ve recently made this script through few month,understand me if there are some incorrect grammar or something.
basically this script is based on moving average strategy and the bollinger bands
if the buy volume is bigger than sell volume,also buy volume is bigger then daily average volume than it`s defined current market is bullish and entered(of course there is some other conditions)
the exit condition is find the highest price after entered,keep refresh the highest price through time and then,if the current price is ?%lower then highest price,it will closed the position.
my question is this : 1 this model will working in real-trade?
2 why the winning rate is 100%?
- i`ve coded if the position margin over -10%,close the position this code isn`t work? or the other profit line is prevent that happened?