OPEN-SOURCE SCRIPT
Cumulative Volume Delta (CVD)
█ OVERVIEW
Cumulative Volume Delta (CVD) is a volume-based trading indicator that provides a visual representation of market buying and selling pressure by calculating the difference in traded volumes between the two sides. It uses intrabar information to obtain more precise volume delta information than methods using only the chart's timeframe.
Volume delta is the net difference between Buy Volume and Sell Volume. Positive volume delta indicates that buy volume is more than sell volume, and opposite. So Cumulative Volume Delta (CVD) is a running total/cumulation of volume delta values, where positive VD gets added to the sum and negative VD gets subtracted from the sum.
I found simple and fast solution how to calculate CVD, so made plain and concise code, here is CVD function :
Pine Script®
where _c, _o, _v are close, open and volume of intrabar much lower timeframe.
Indicator uses intrabar information to obtain more precise volume delta information than methods using only the chart's timeframe.
Intrabar precision calculation depends on the chart's timeframe:

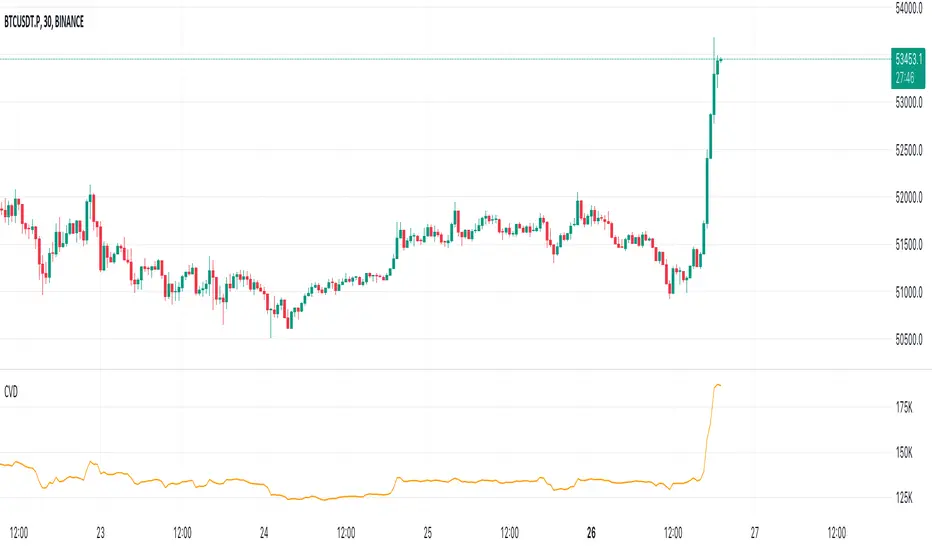
CVD is good to use together with open interest, volume and price change.
For example if CVD is rising and price makes good move up in short period and volume is rising and open interest makes good move up in short period and before was flat market it is show big chance to pump.
Cumulative Volume Delta (CVD) is a volume-based trading indicator that provides a visual representation of market buying and selling pressure by calculating the difference in traded volumes between the two sides. It uses intrabar information to obtain more precise volume delta information than methods using only the chart's timeframe.
Volume delta is the net difference between Buy Volume and Sell Volume. Positive volume delta indicates that buy volume is more than sell volume, and opposite. So Cumulative Volume Delta (CVD) is a running total/cumulation of volume delta values, where positive VD gets added to the sum and negative VD gets subtracted from the sum.
I found simple and fast solution how to calculate CVD, so made plain and concise code, here is CVD function :
cvd(_c, _o, _v) =>
var tcvd = 0.0, delta = 0.0
posV = 0.0, negV = 0.0
totUV = 0.0, totDV = 0.0
switch
_c > _o => posV += _v
_c < _o => negV -= _v
_c > nz(_c[1]) => posV += _v
_c < nz(_c[1]) => negV -= _v
nz(posV[1]) > 0 => posV += _v
nz(negV[1]) < 0 => negV -= _v
totUV += posV
totDV += negV
delta := totUV + totDV
cvd = tcvd + delta
tcvd += delta
cvd
where _c, _o, _v are close, open and volume of intrabar much lower timeframe.
Indicator uses intrabar information to obtain more precise volume delta information than methods using only the chart's timeframe.
Intrabar precision calculation depends on the chart's timeframe:
CVD is good to use together with open interest, volume and price change.
For example if CVD is rising and price makes good move up in short period and volume is rising and open interest makes good move up in short period and before was flat market it is show big chance to pump.
Açık kaynak kodlu komut dosyası
Gerçek TradingView ruhuna uygun olarak, bu komut dosyasının oluşturucusu bunu açık kaynaklı hale getirmiştir, böylece yatırımcılar betiğin işlevselliğini inceleyip doğrulayabilir. Yazara saygı! Ücretsiz olarak kullanabilirsiniz, ancak kodu yeniden yayınlamanın Site Kurallarımıza tabi olduğunu unutmayın.
Feragatname
Bilgiler ve yayınlar, TradingView tarafından sağlanan veya onaylanan finansal, yatırım, işlem veya diğer türden tavsiye veya tavsiyeler anlamına gelmez ve teşkil etmez. Kullanım Şartları'nda daha fazlasını okuyun.