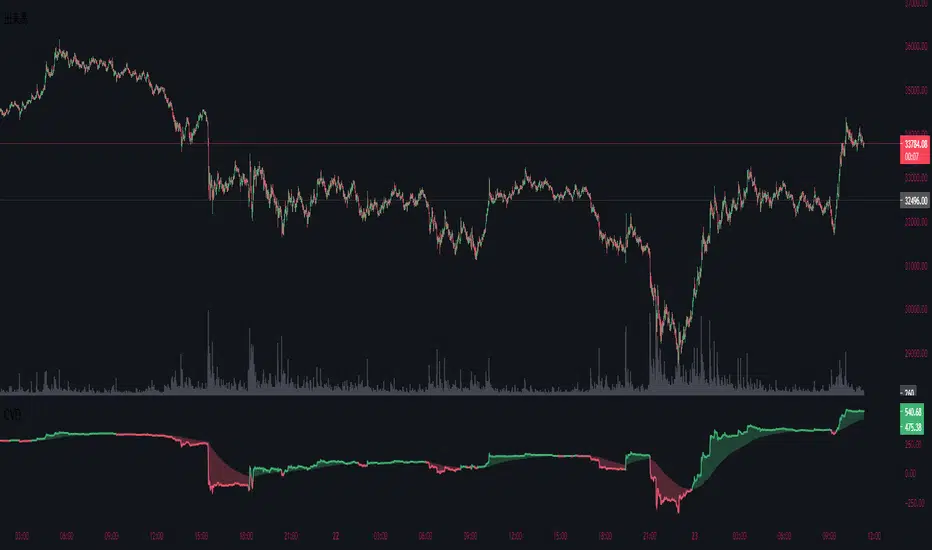
Cumulative Volume DeltaThis indicator is called Cumulative Volume Delta (CVD), and it is the cumulative difference between buying and selling pressure.
Note, however, that it is not an exact CVD, because Pine Script does not allow you to get the Bid Volume and Ask Volume.
Instead, it uses volume and candlestick length to determine the pressure.
Example: Volume is 100, price change is +1.0% → Buying pressure is 1
Volume is 100, price change is -0.5% → Selling pressure is 0.5
このインジケーターは、Cumulative Volume Delta(CVD)と呼ばれるもので、買い圧力と売り圧力の差を累積したものです。
しかし、Pine Scriptでは買い圧力と売り圧力(Bid VolumeとAsk Volume)を取得することはできないため、正確なCVDではないことに注意してください。
代わりに出来高とローソク足の長さで圧力を判断判断しています。
例:出来高が100、価格の変動が+1.0% → 買い圧力は1
出来高が100、価格の変動が-0.5% → 売り圧力は0.5
Komut dosyalarını "volume" için ara
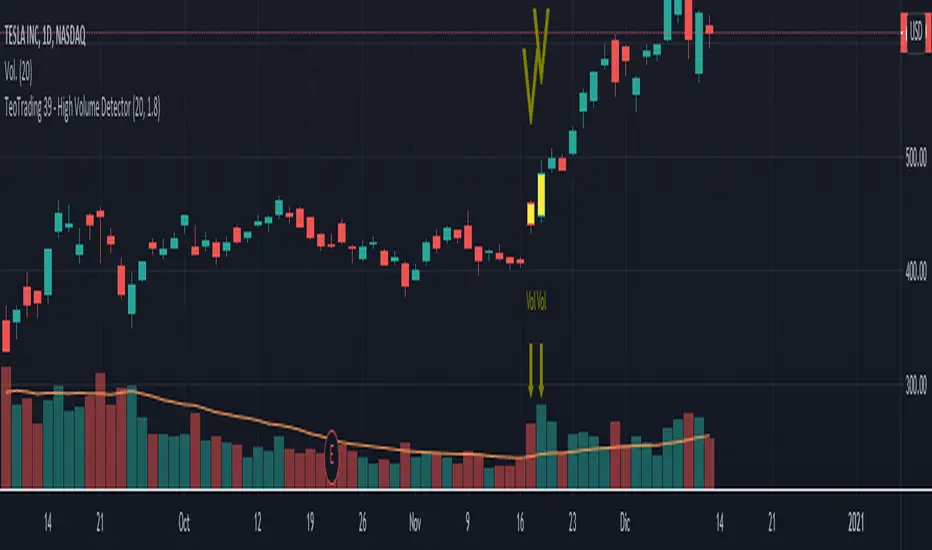
TeoTrading 39 - High Volume DetectorThis indicator prints "V" signal when the Volume is higher than a specified threshold.
You can change input parameters for:
- Quantity of Candles to calculate the volume average.
- Percent of Volume: for example 1,8 is 80% higher than the average.
- Parameter to change the Bar Color when the volume is higher than the threshold.
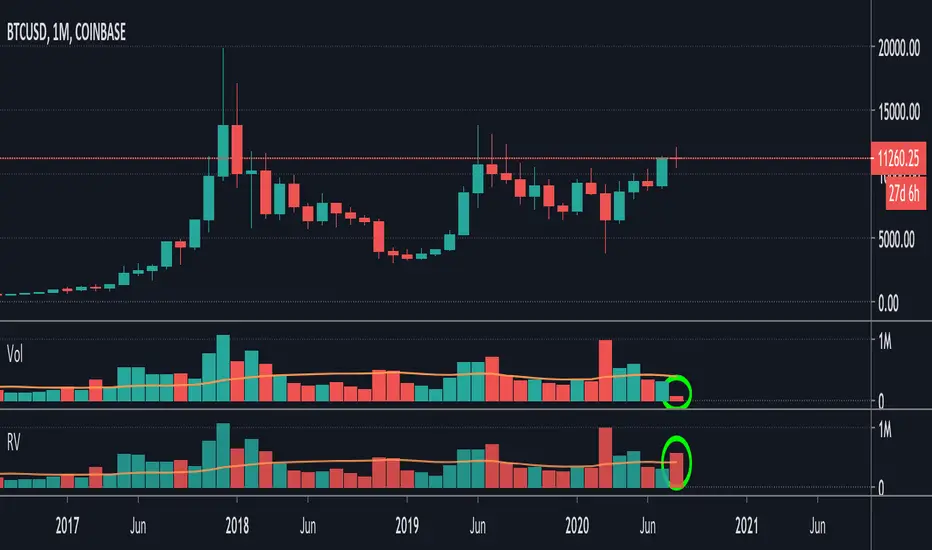
Relative VolumeIt is difficult to know how much volume is going on DURING the last bar,
therefore this "Relative Volume" (RV) script, previous bars are as usual, but the last one
adjusts the measured volume by comparing how much time passed and multiplying
this with the volume.
Examples:
Here (5 minute bar) there are 31 sec passed of the 5 minutes
The standard volume show little volume (since there is only 31s passed)
The "RV" multiplies this so you'll see how much this volume would be over 5 minutes,
IF everything goes the same for the rest of the 5'.
1' 5sec passed:
(so relatively more volume)
3' 4sec passed:
(With about 2' to go, you see there is a lot going on with the volime,
while seeing the standard volume, nothing much...)
Little 4' passed:
4,5':
Almost 5' gone:
Important:
This "RV" volume can diminish when during the bar the volume fades.
I think this can help evaluating the volume during the last bar
W example:
M example:
(You can clearly see that during the first 4 days there is a lot going on!)
Investonomer - BS VolumeBuy Sell Volume Indicator is a free indicator which can be used with any instrument (stock, index or CFD) where volume information is available on TradingView.This indicator shows us a volume based view of the market activity and it helps us distiguish whether buyer are aggressive or sellers are. Basically, this indicator plots first plots the buyer volume in green. Then the seller volume is printed in red.
If Sellers are more, you will red only, whereas if buyers are more, you will selling volumes and then extra green over it which shows how many buyers are there in the market.

Quantum Tick VolumesMany forex traders assume there is no volume in the foreign exchange market. And they would be correct. There is no central exchange, not yet anyway. And even if there were, what would it report?
What there is however is activity, and this is captured as tick volume. After all, volume is simply displaying activity, the buyers and sellers in the market. So for volume read activity, and for activity read volume – simple.
First, the indicator paints the volume bars the same color as the candles on the chart. This means you can quickly match price and volume bars together. If you’re trading using volume and price as your core methodology, this is imperative. Your analysis will depend on a fast interpretation of the volume price relationship.
Second, the indicator prints a dynamic midpoint based on the daily data, giving you an instant picture of whether the volume is high, medium or low in the time frame selected. Again, this is essential for correctly analyzing the price volume dynamic. After all, what is average volume in the London session, may be high volume in the Asian session. The dynamic midpoint level reveals this instantly on the indicator, helping you make sense of the highs and lows of each volume bar.

BBP (Bittex, Poloniex, Bitfinex) + standart volumeThe script wrote for pairs of crypto currency with XXX USD. On others it does not work. By and large, it is suitable only for analysis of TOP coins.
What it consists of:
The script pulls volumes from exchanges: Bitfinex, Bittrex, Poloniex + the volume of the coin itself through the dollar indicator normalized.
Based on the volume from the indicator "dollar normalized volume"
Works with pairs XXX USD (do not confuse with USDT)
Simple Volume IndicatorBased on the great work of Nitin Ranjan .
Plots volume in 4 different colors and reduce all the noise.

Advanced Cumulative Delta & VolumeAdvanced Cumulative Delta & Volume (Heuristic-Based)
This offers a powerful cumulative delta visualization based on price action heuristics—perfect for traders without access to real bid/ask volume data.
Features
Cumulative Delta Calculation
Built using estimated delta (based on close position and volume).
Includes a moving average-based surge detection system.
Surge Detection
Highlights candles where delta exceeds a multiple of its average.
Detects sustained surges across multiple bars for trend confirmation.
Visual Enhancements
Smoothed line and area chart for delta flow
Alternate background shading (light blue) for each timeframe interval—great for visual structure (e.g., every 30 minutes).
Color-coded:
Yellow for bullish surges
Black for bearish surges
Green for positive delta /red for negative delta
Customizable Inputs
Timeframe (for resampling logic)
Surge thresholds
Delta moving average length
Volume weight adjustment
Sustained bar count
Ideal For:
Order flow enthusiasts without premium data feeds
Scalpers & intraday traders
Anyone wanting a visual edge on volume-driven moves

Enhanced Volume By TradeINskiFeatures available and logic behind it,
Section - Moving Average
- This will plot a simple moving average line.
- In Settings {Input Tab} "MA Period" can be changed. Default value is 20.
- In Settings {Style Tab} "MA Line" can be ON/OFF by check mark, color and type can be changed. Default "ON", "Line" and "White".
Section - Bar Color
1. Up color
- When Up day, the color of column is green.
- In settings {Input Tab} Color can be changed. Default "Green".
- In settings {Style Tab} Type of volume indicator can be changed such as dots and area etc. Default "Columns".
2. Down color
- When Down day then the color of column is red.
- In settings {Input Tab} Color can be changed. Default color "Red".
3. Relatively High Volume
-When Up day plus that day volume is 2.5 times the average volume then its Relatively High Volume.
- In settings {Input Tab} Color can be changed. Default color "Lime".
4. Relatively Low Volume
- When volume is less than 50% of average volume, irrespective of up or down day then it is Relatively Low Volume.
- In settings {Input Tab} Color can be changed. Default color "Silver".
Section - Step Up and Down Volume
1. Step Up
- When today's volume is more than yesterday's volume and both days' volume should be less than average volume.
- In settings {Style Tab} Color, Type and location of the marker can be changed by user. Default is "Yellow", "Upward Triangle" and "Top".
1. Step Down
- When today's volume is less than yesterday's volume and both days' volume should be less than average volume.
- In settings {Style Tab} Color, Type and location of the marker can be changed by user. Default is "Yellow", "Down Ward Triangle" and "Top".
{NOTE}
This indicator best suited for Daily Timeframe and color selection is best suited for Dark theme.
10 hours ago
Release Notes:
{Note} Up and Down volume is based on previous close.

Forex Multi Exchange VolumeHi traders! Forex Multi Exchange Volume (FMEV) aggregates and plots trading volumes for supported forex pairs over multiple different major forex exchanges.
Supported exchanges
- FXCM
- OANDA
- FOREX.COM
- PEPPERSTONE
- GLOBALPRIME
Limitations
Because of the fact that FMEV is pulling data from from multiple different exchanges and is computationally intensive it can take a couple of seconds to load while charting certain forex pairs.

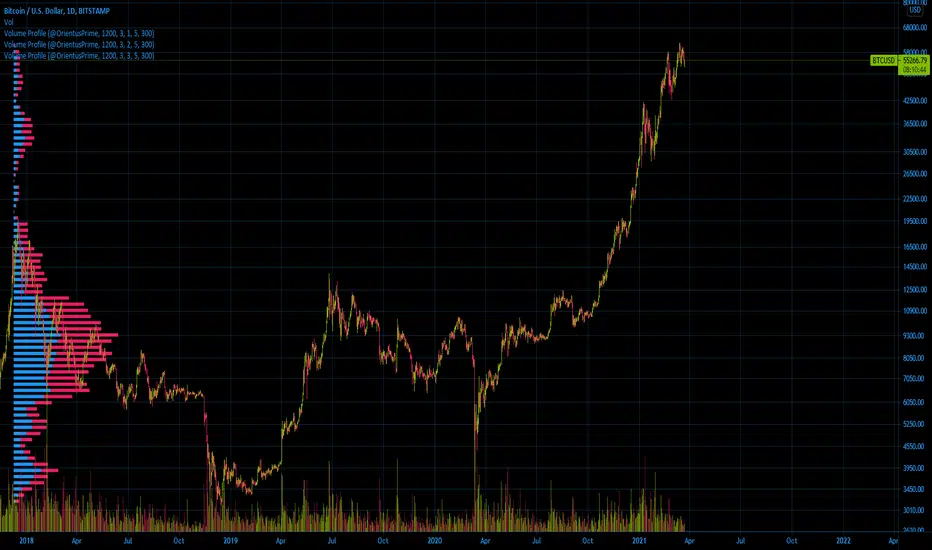
Ori Volume ProfileOri Volume Profile plots trading volume as a histogram on the price scale.
You can add it more than once to increase its precision.
It starts drawing from the bar it starts to calculate.
If you can't see the volume profile zoom out and go left in the chart until you can see the starting position.
For adding it multiple times you should set inputs correclty. For example if you want to add it 3 times, total indicator amount should be 3 in all of the 3 indicator and you should enumerate their order of the current amount. First indicators order should be 1, second indicators order should be 2, third indicators order should be 3 etc
Settings for the one in the image:
Firs indicator: 1200 3 1 5 300
Second indicator:1200 3 2 5 300
Third indicator:1200 3 3 5 300
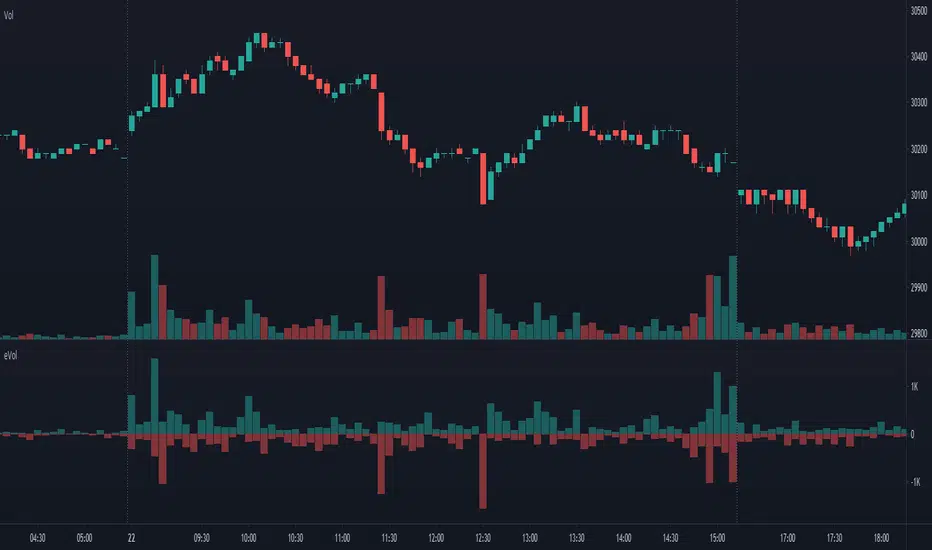
Estimated Up Down VolumeThis indicator plot estimated Up volume and Down volume.
Adjust colors to the default volume indicator.
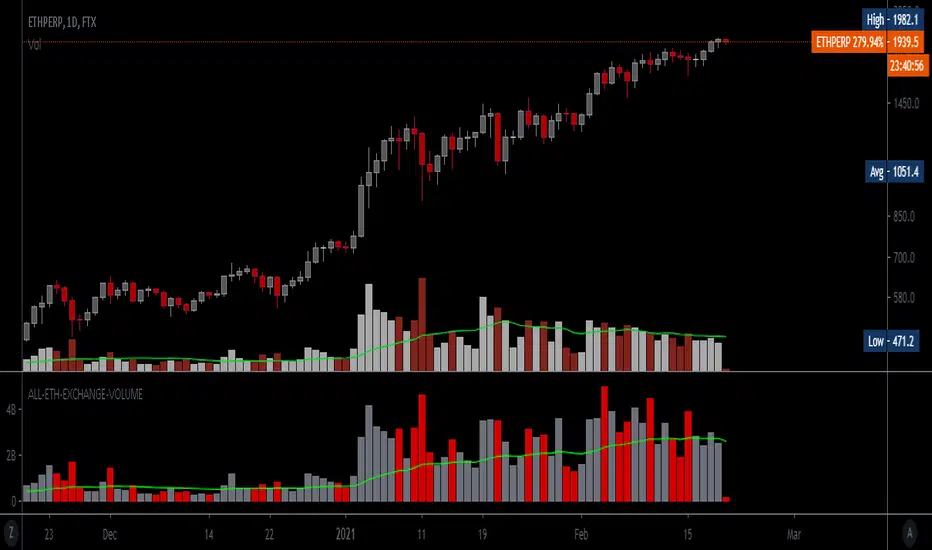
"ALL" ETH-VOLUME-INDICATOR - MarshMell0wThis indicator includes 16 Spot and Futures ETH exchanges and their volumes averaged together.
This is a remake of the original BTC Indicator posted in my scripts.
On the chart attached is ETHPERP from FTX and the ETH Volume indicator beneath it.
Any exchange can be turned off and/or be used in any combination.
Future updates will include more exchanges.
Performante's Average Ethereum Volume IndicatorPerformante's Ethereum Volume Indicator takes the volume from the biggest exchanges and plots the average volume.

Performante's Average Bitcoin Volume IndicatorPerformante's Bitcoin Volume Indicator takes the volume from the biggest exchanges and plots the average volume.
Happy Trading!

Horizontal Volumes by WentalEng.
This indicator shows the distribution of the traded volume by horizontal levels.
It is not authentic horizontal volumes, but works well.
You can select the measurement range of the indicator by changing the length value.
But the longer the length value, the longer it takes to compute and can be significant.
I do not recommend set values greater than 500 (min = 10, max = 1000).
Rus.
Индикатор для отображения горизонтальных объёмов.
Эти объёмы не настоящие, а преобразованы из обычных вертикальных. Работают отлично. )
В качестве параметра можно задать длину, индикатор будет рассматривать распределение объёмов
начиная с бара, отстоящего на величину указанного значения.
Не указывайте большую величину длины, т.к. индюк тратит много времени на вычисления и отрисовку.
Лучше не ставить значения выше 500 (минимальное значение - 10, максимальное - 1000).
Индикатор не идеален, скорее всего будут доработки в будущем. )

#101c Volume Data Overlay - Alert [bionis]Indicator #101c is a surrogate of my original #101 volume based indicator. With this version is now possible to set alerts for specific levels of relative volume.
Access is granted to CryptoSociety Team and their community.

Candle Color Volumescript baseado na alteração das cores do candle conforme o volume de trocas.
script based on changing the colors of the candle according to the volume.

Weekly Volume USDT## Description
This Pine Script indicator displays the trading volume for each day of the current week (Monday through Sunday) in a clean table format on your TradingView chart. The volume is calculated in USDT equivalent and displayed in the top-right corner of the chart.
## Features
- **Weekly Volume Breakdown**: Shows individual daily volumes from Monday to Sunday
- **USDT Conversion**: Automatically converts volume to USDT using the average price (open + close / 2)
- **Smart Formatting**:
- Large numbers are formatted with K (thousands) and M (millions) suffixes
- Example: 1,234,567 → 1.23M USDT
- **Clean Table Display**: Fixed position table in the top-right corner
- **Current Week Focus**: Displays volumes for the current week only
- **Future Days Handling**: Days that haven't occurred yet in the current week show as "-"
## How It Works
1. The indicator calculates the average price for each day using (Open + Close) / 2
2. Multiplies the daily volume by the average price to get USDT-equivalent volume
3. Displays the results in an easy-to-read table format
## Use Cases
- **Volume Analysis**: Quickly identify which days of the week have the highest trading activity
- **Pattern Recognition**: Spot weekly volume patterns and trends
- **Trading Decisions**: Use volume information to inform your trading strategies
- **Market Activity Monitoring**: Keep track of market participation throughout the week
## Installation
Simply add this indicator to your TradingView chart and it will automatically display the weekly volume table in the top-right corner.
## Tags
#volume #weekly #USDT #table #analysis #trading #cryptocurrency

Noro's Multi-exchange VolumeThe sum of volumes (5 different exchanges) at the same time. The exchanges can be chosen. Less than five exchanges are possible. For this purpose it is necessary to erase the text in the field.

5 min volume scalperThis scalper try to do it by volumes
The exit either by take profit or the signals, make the TP fit for your need so you will get better exit points
the len control the length so higher will be less signals lower is more
alerts inside
you free to change this code and do what ever you want with it
I hope you can make it better:)

BTC Combined VolumeI edited an existing script to include Bitmex volume. I'm no expert at this but I hope it works!
Cheers,
G

MaqdsiTrader S&D Volume Boxes Time🎓 MaqdsiTrader S&D Volume Boxes Time – Indicator Explanation
📌 Concept of the Indicator:
This indicator identifies Supply & Demand zones based on the highest volume bullish or bearish candle. It draws boxes on the candle with the highest volume, whether it's a buy (green) or sell (red) candle.
📦 What does the indicator actually do?
✅ Draws boxes on the candle that has:
The highest bullish volume → significant green candle (Demand/Support zone)
The highest bearish volume → significant red candle (Supply/Resistance zone)
✅ Supports 3 box drawing types:
Body Only : Around the candle body only (Open/Close)
Wick Only : On the upper or lower wick only (for precision zones)
Full Candle : Covers the entire candle (more inclusive zone)
✅ Additional Features:
Option to set the starting point of drawing (from the beginning of the chart or from a specific date)
Ability to extend the box to the right to monitor future reactions
Toggle to show/hide bullish or bearish boxes
Automatic alert when a new high-volume candle appears
An info table showing the highest bullish and bearish volume levels
