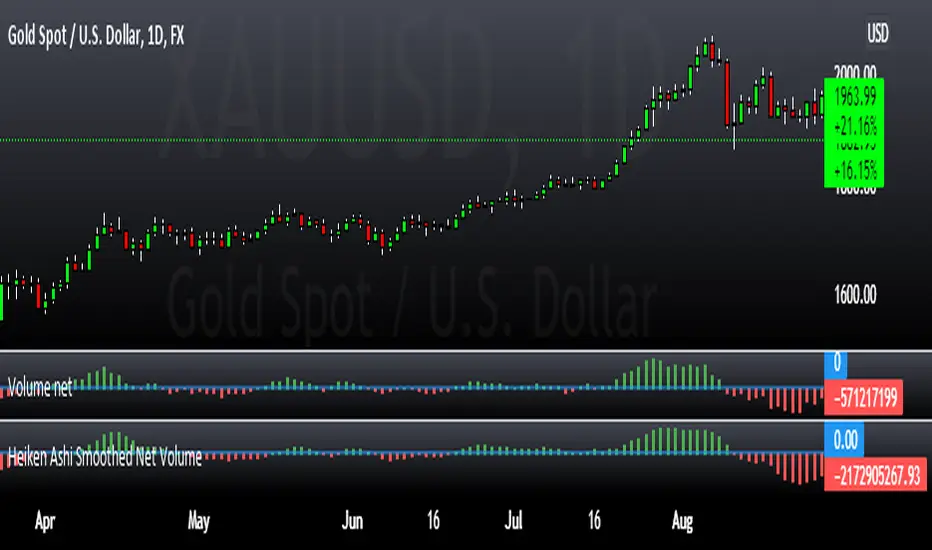
Heiken Ashi Smoothed Net VolumeThis indicator attempts to use Heiken Ashi calculations to smooth the Volume net histogram indicator by RafaelZioni. Long above zero line, short below zero line.
Komut dosyalarını "volume" için ara
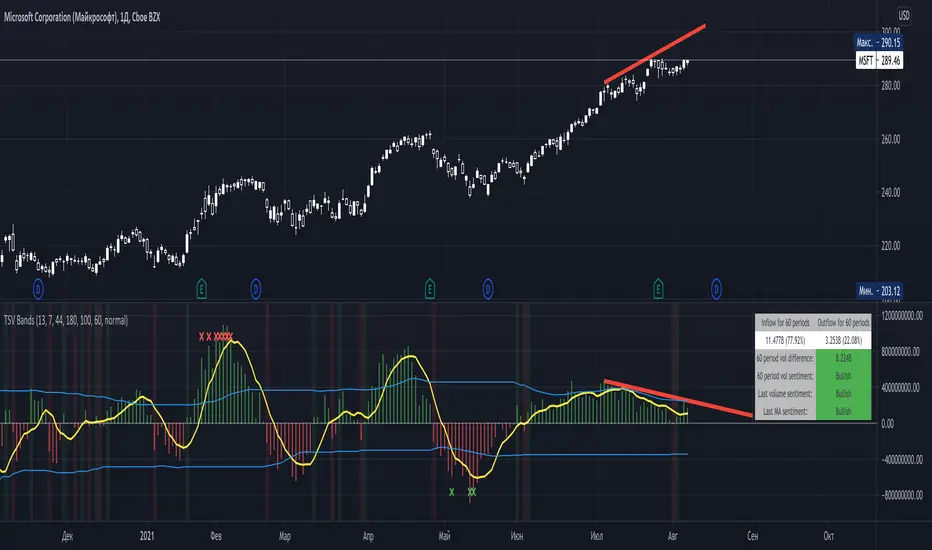
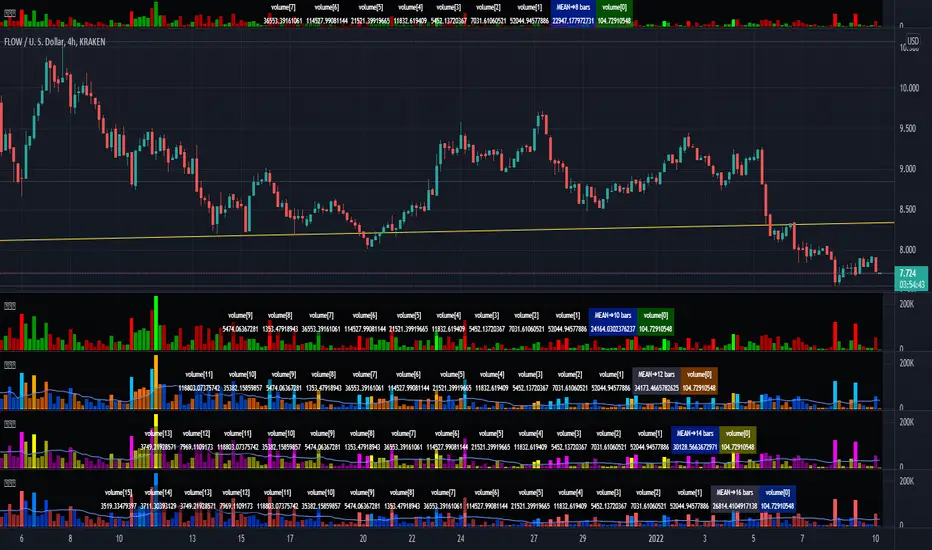
Time Segmented Volume BandsTime Segmented Volume Bands
This time I took as a basis TSV - Time Segmented Volume, a rather rare one, almost never mentioned on TradingView.
TSV is a leading indicator because its movement is based on both the movement of the stock price and its volume. Ideal entry and exit points are usually found when a stock moves through a baseline. This indicator is similar to the more well-known balance volume (OBV) because it measures the amount of money flowing in or out of a particular stock.
What is their main difference between TSV and OBV?
Time Segmented Volume is used to eliminate distortions of the standard volume graph. OBV is based on cumulative total volume, while TSV compares the current time period with the previous one, without a subtotal.
What I added on my own script
Bands, similar to Bollinger. The main idea is to have an idea of the average inflow and outflow of volumes from / to shares for a particular period. We have an opportunity to estimate how much the current volumes differ from the average for 60 days (all values can be flexibly adjusted).
Excess markers by the current average volume (sensitivity can be adjusted separately).
A table that calculates the total sentiment (force) of volume on average for N periods in comparison with the current one.
Sell/buy markers
How to read a TSV graph
The main graph is a histogram. Green bars mean an inflow of volume, red bars mean an outflow. When the red volume crosses the baseline zero, it is considered a buy signal (in the classic TSV version). A similar sell signal - just the opposite. I highlight them with a colored background fill.
It is especially important to find divergences on the chart. For example, when the volume peaks getting lower but the price rises (short).
The yellow line is the average TSV for 7 periods. Just a smoother lagging line.
Blue stripes. Above - the average inflow of volumes over N periods (44 days). Below - the average outflow.
Markers are additional buy / sell signals generated when the current TSV value exceeds the average for N periods. In the script settings, you can choose how many percent deviations from the average should occur in order to count it as a strong signal (by default, an excess of 180% for selling, 100% for buying). The main idea of the marker is to catch a better price than with the standard TSV logic (take at the intersection of the zero line). The marker can serve as both an assistant and drive into a trap. If you are not very confident, then it is better to adhere to standard practice, and set the excess of markers to completely abnormal situations, so that it triggers less often.
Colored background - a classic buy or sell zone (when crossing the TSV baseline).
Table - you can configure its presence and size in the settings. On it you can estimate the sentiment of the movement of money for the last N periods. Pay particular attention to the % value in parentheses. It shows the strength of the trend in volumes over N periods.
The basic rule, as with any trend indicator: do not trade against the trend. A sell signal in a constantly rising channel is not a short signal. This is a signal for a possible fixation of a part of the position. No more.
How do I use this indicator?
For starters, I never make decisions purely based on an indicator. TSV plays the role of a clearer visualization of volumes for me. If I see that the volumes are fading away (thin market), then I try not to enter the trade. For the last two weeks, while picking charts, I completely abandoned standard volume bars in favor of TSV due to it's greater informative.
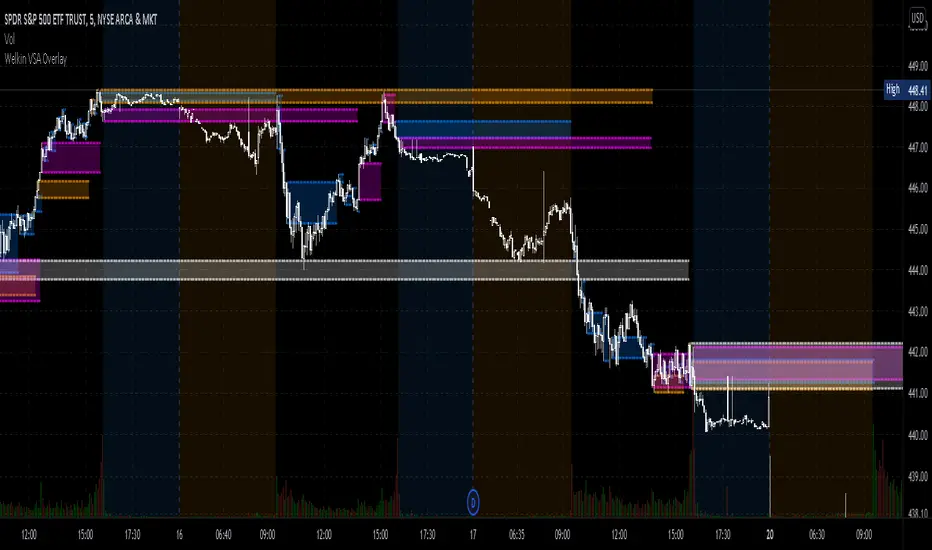
Welkin Advanced Volume Overlay (for VSA)This is a PineScript translation of Welkin's Advanced Volume Indicator Overlay, originally written for ThinkOrSwim. This tool is designed to facilitate Volume Spread Analysis (VSA) by highlighting areas of above average volume alongside price movement.
This indicator does two things:
1. Plots lines that extend from candles of above average, high, and very high volume.
2. Colors in candles with colors indicating volume levels (when "Paint Candles With Volume Colors" is enabled).
Blue lines mark candles with Average volume, based on a 20 SMA.
Orange lines mark 2-sigma (2 times standard deviations higher) volume.
Magenta lines mark 3-sigma (3 times standard deviations higher) volume.
When enabled, gray colored candles indicate below average volume.
Yellow candles indicate volume that is relatively higher than the previous candle, default is 1.25x.
Volume Spread Analysis Indicators [Volume Trader]This indicator is based on Volume and Price spread analysis developed by tom williams.
It shows following indicators based on price range and volume data
Bearish Indicators
1. Buying climax
2. End of Rising Market
3. Upthrust
4. Smart selling
5. No Demand
6. VDD
Bullish Indicators
1. Selling Climax
2. End of falling
3. Stop Volume
4. Reverse Upthrust
5. Shakeout
6. VDU
6. No supply

PVA Candles and Volume© ForexPipCheats and iceicebaby_
This indicator is coded to run on Trading View which was originally created by traderathome (TAH), qFish, and all other respective contributors for the mt4 version.
It creates standard PVA candlesticks and volumes based on Price Volume Support Resistance Analysis (PVSRA)
Special colours are used demote candles and corresponding volume bars where special situations occur involving price and volume
Hence PVA (Price-Volume Analysis).
The special situations or requirements for the colours are as follows:
Situation "Climax"
Bars with volume >= 200% of the average volume of the 10 most recent previous candles in the current TF, and bars where the product of candle spread x candle volume is >= the highest for the 10 most recent previous candles in the current TF. Bull bars are green and bear bars are red.
Situation "Volume Rising Above Average"
Bars with volume >=150% of the average volume of the 10 most recent previous candles in the TFs. Bull bars are blue and bear are blue-violet
**Important**
Please note that this indicator is a form of market analysis and not a trading method.
You are recommended to use this indicator with the Dragon and Trend indicator to guide your trading entry. You can find it in my profile.
The volume colours may not be the same if you compared it with mt4 as the broker you are using might differ.
Chat Display Settings
Make the necessary adjustments to your main chart in order for your indicator to display correctly.
1. Change the candle body and outline's transparency to 100%
2. Change the candle wick to silver /light grey for bull and dark grey for bear
Colour Settings
Note that the default colours are based on the colours of the PVA Volumes trading guide.
It is recommended to keep it default but please feel free to change it however you like.
Bull Volume Climax - Green
Bull Rising Volume - Blue
Bull Normal Volume - Silver / Light Grey
Bear Volume Climax - Red
Bear Rising Volume - Bear
Bear Normal Volume - Dark Grey
Alert Settings
This indicator comes with a custom alert setting whenever a Rising Volume or Volume climax condition is fulfilled. However, it does not trigger automatically and you are required to manually set the duration before it can be initialized.
1. Create an alert on your desired currency pairing by selecting "Apply PVA Alert"
2. Set alert per bar and change the alert setting duration to unlimited if possible
3. You are recommended to set multiple alerts on various TFs if possible ( M1 , M5, H1, H4, D1)
4. Remember to replace {Edit TF} in the alert message with the TF you have created the alert on.
This script will include additional SR and Daily Range indicator in the future, hopefully.
Comment if you have any questions

Crypto Multi Exchange Volume (CMEV)Crypto Multi Exchange Volume (CMEV) aggregates and plots trading volumes for supported cryptoasset pairs over multiple different cryptoasset exchanges. For developers looking for more information and for those who want to compile their own version of CMEV, please check out my GitHub (jakobpredin/crypto-multi-exchange-volume).
Configuration
CMEV comes with two configurable settings - whether base volume or quote volume is plotted and the length of the volume's EMA. By default, the base volume is used for plotting and the length of the EMA is set to 12 periods.
Use cases
The indicator was primarily developed in order to be able to chart using the trading pair with the longest available trading history. Due to the fast-changing preferences of where cryptoassets are traded, volumes tend to be very inconsistent and can give a distorted picture of a pairs history. For illustration, check out the SC-BTC pair from Poloniex using their native volume and compare it to the CMEV volume.
The other use case is to be able to spot divergences in volume. A great example here is bitcoin's 2019 rally where volumes from derivatives exchanges are at all time highs but volumes from retail/spot exchanges are not.
Supported exchanges
CMEV currently supports asset pairs from the following exchanges:
Binance
Bitfinex
Bitstamp
Bittrex
Coinbase
Gemini
Kraken
Poloniex
Limitations
Because of the fact that CMEV is pulling data from from multiple different exchanges and is computationally intensive it can take a couple of seconds to load while charting certain cryptoasset pairs.
Additionally, due to Tradingview's various limitations only a certain number of pairs can be supported at a time. By default, only pairs with a BTC or USD quote are supported and many non-unique pairs with consistently low trading volumes have been removed. For a full explanation, please refer to the docs in my GitHub (jakobpredin/crypto-multi-exchange-volume).
Future of the project
I plan on supporting pairs from more exchanges in the future as I see fit and as they become available for charting on Tradingview. Further, I may develop a strategy script using CMEV as its core indicator.
I welcome everybody from the community to help me extend the functionality of CMEV in order to make investing in cryptoassets more transparent for everybody.

Enhanced Volume MonitorThis is my enhanced volume monitor using Pine Script version 4.0 freely available to ALL! It's very much like the built-in TV volume monitor displayed in the overlay chart, but it isn't dockable like TV's, sorry. Maybe one day they will find it in thier hearts to adopt this script for thier built-in replacement. I would gladly do so and already offered it previously. I preferably put it over top of the overlay chart by itself, just like you see above, and then I can expand it down easily for a substantially better quick inspection. I provided a wide assortment of vibrant color schemes to choose from for anyone who may have vision impairments. This also displays that color scheming is VERY possible in Pine.
I would personally like to thank the talented individuals at TV for providing a platform that embraces an initial free membership, which I first obtained myself, for individuals like me to freely code in Pine with mathemagical ideas and mental wizardry, creating ultimately, inventions like this eye candy display above.
Features List Includes:
I.P.O.C.S.(Initial Public Offering Clean Start) Technology - plotting from day one, minute one of IPO with all 4 moving averages
Enable/disable dark background for enhanced visibility
Color schemes (all displayed above)
Enable/disable tricolor scheme
Enable/disable volume moving average
Moving average "type" option with multiple selections
Adjustable moving average period
If you do have any questions or comments regarding this indicator, I will consider your inquiries, thoughts, and ideas presented below in the comments section, when time provides it. As always, "Like" it if you simply just like it, and also return to my scripts list occasionally for additional postings. Have a profitable future everyone!
Up/Down Volume Delta %this script is based on FractalTrade_'s rendition of the up/down volume bars.
the shortcomings of that chart were that large volume bars caused the auto-scaling to shrink smaller volume bar displays to the point where much of the data was too small to see.
in this chart, the bars are displaying the percent delta out of the total bar volume. this way, large overall volume bars do not cause visual compression to everything else in the chart.
I've used color modulation to indicate relation to a relative volume point, so users can still tell when overall volume is large or small. when volume is under a moving average, the bars will display at a basis transparency. when the volume is over the average, the brightness will increase up to a specific ratio of volume defined by the user.
for example, if basis transparency is at 20, and the full opacity ratio is at 3, and the volume average is at 1M, a volume of 750k will display the delta bar at the basis transparency. a volume of 3M will achieve full brightness. a volume of 2M will display with moderate brightness (about 60%), but still stand out against other bars with basis transparency.
areas of the chart that are either increasing bar sizes or increasing in brightness can indicate directional force. when volume delta direction contradicts the candle direction, this can indicate support / resistance.

Delta Volume BubblesDelta Volume Bubbles
Overview
The Delta Volume Bubbles indicator is an advanced order flow visualization tool that displays buying and selling pressure through dynamic bubble representations on your chart. Unlike traditional volume indicators that only show total volume, this indicator calculates the net delta volume (difference between buying and selling volume) and presents it as color-coded bubbles of varying sizes.
How It Works
Core Calculation Method
The indicator uses a sophisticated approach to estimate delta volume from standard OHLCV data:
1. Price Action Analysis: Analyzes the relationship between open, high, low, and close prices to determine market aggression
2. Body Ratio Calculation: body_ratio = |close - open| / (high - low)
3. Aggressive Factor: Applies multipliers based on price action:
- Strong moves (body_ratio > 0.7): 1.5x multiplier
- Moderate moves (body_ratio > 0.4): 1.2x multiplier
- Weak moves: 1.0x multiplier
4. Delta Volume Estimation:
- Buy Volume: price_change > 0 ? volume × aggressive_factor : 0
- Sell Volume: price_change < 0 ? volume × aggressive_factor : 0
- Net Delta: buy_volume - sell_volume
5. Delta Strength Normalization: delta_strength = |net_delta| / sma(volume, 20)
Percentile-Based Filtering
The indicator uses percentile filtering instead of fixed thresholds, making it adaptive to market conditions:
- Bubble Filter: Only shows bubbles when volume exceeds the specified percentile (default: 60%)
- Label Filter: Only displays numbers when volume exceeds a higher percentile (default: 90%)
- Dynamic Adaptation: Automatically adjusts to changing market volatility
Visual Elements
Bubble Sizes
- Tiny: Delta strength < 0.3
- Small: Delta strength 0.3 - 0.7
- Normal: Delta strength 0.7 - 1.2
- Large: Delta strength 1.2 - 2.0
- Huge: Delta strength > 2.0
Color Coding
- Aggressive Buy (Bright Green): Strong buying pressure with high body ratio
- Aggressive Sell (Bright Red): Strong selling pressure with high body ratio
- Passive Buy (Light Green): Moderate buying pressure
- Passive Sell (Light Red): Moderate selling pressure
Intensity Mode
Alternative coloring based on delta strength rather than flow direction:
- Gray: Low intensity (< 0.5)
- Blue: Medium intensity (0.5 - 1.0)
- Orange: High intensity (1.0 - 2.0)
- Red: Extreme intensity (> 2.0)
Parameters
Order Flow Settings
- Show Bubbles: Toggle bubble display on/off
- Bubble Volume %ile: Percentile threshold for bubble display (0-100%)
- Intensity Mode: Switch between flow-based and intensity-based coloring
Bubble Labels
- Show Numbers in Bubbles: Toggle numerical labels on/off
- Label Volume %ile: Higher percentile threshold for label display (0-100%)
Numbers are displayed in K-notation (e.g., 25000 → 25K, 1500000 → 1.5M) for better readability.
Ideal Usage Scenarios
Best Market Conditions
- High volume sessions: More accurate delta calculations
- Trending markets: Clear directional flow identification
- Breakout scenarios: Spot aggressive buying/selling at key levels
- Support/resistance testing: Identify accumulation vs distribution
Trading Applications
1. Entry Timing: Look for aggressive flow in your trade direction
2. Exit Signals: Watch for opposing aggressive flow
3. Trend Confirmation: Consistent flow direction confirms trends
4. Volume Climax: Huge bubbles may indicate exhaustion points
Optimization Tips
Parameter Adjustment
- Lower percentiles (40-60%): More bubbles, good for active markets
- Higher percentiles (70-90%): Fewer bubbles, focus on significant events
- Label percentile: Set 20-30% higher than bubble percentile for clarity
Visual Optimization
- Intensity mode: Better for identifying unusual volume spikes
- Flow mode: Better for directional bias analysis
- Label toggle: Turn off in crowded markets, on for key levels
Limitations
- Estimation-based: Uses approximation algorithms, not true order flow data
- Volume dependency: Requires accurate volume data to function properly
- Timeframe sensitivity: Works best on intraday timeframes with active volume
- Market hours: Most effective during high-volume trading sessions
Technical Notes
The indicator implements advanced Pine Script features including:
- Dynamic percentile calculations using ta.percentile_linear_interpolation()
- Conditional plotting with multiple size categories
- Custom number formatting functions
- Efficient label management to prevent display limits
This tool is designed for traders who want to understand the underlying buying and selling pressure beyond simple volume analysis, providing insights into market sentiment and potential turning points.

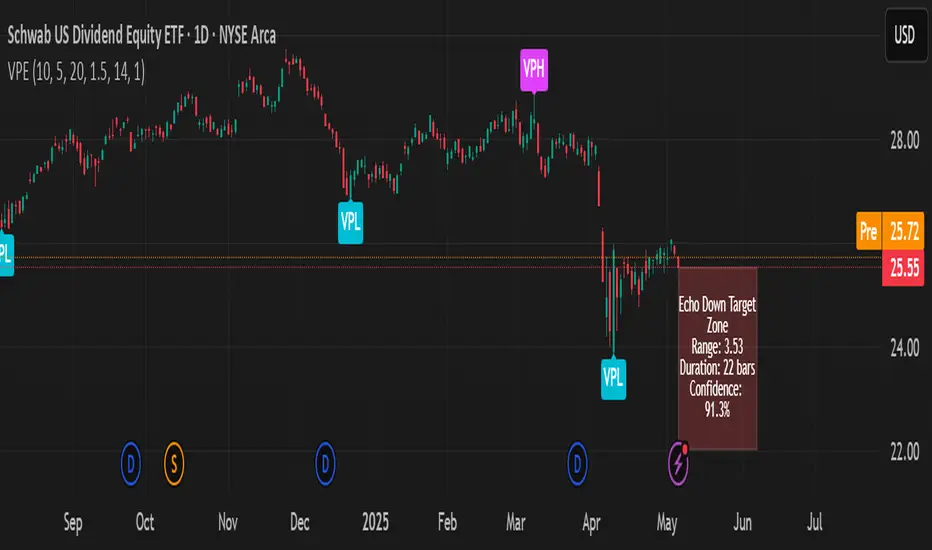
Volumetric Pivot Echo🔮 Volumetric Pivot Echo (VPE)
Future Price Projection Zones with Confidence Scoring
📘 Overview
The Volumetric Pivot Echo (VPE) is a next-generation leading indicator that identifies high-volume reversal points and echoes their price + time behavior into the future — giving you a visual forecast box that includes a confidence score, price range, and duration estimate.
It’s designed for swing and options traders who want forward guidance based on real structure, not just reactive signals.
⚙️ How It Works
Pivot Detection – Finds pivot highs/lows based on configurable bar structure.
Volume Confirmation – Only confirms pivots backed by strong volume (e.g., 1.5× average).
Echo Logic – Measures the price move and time it took to reach the pivot.
ATR Scaling – Adjusts projections based on current market volatility.
Confidence Score – Rates each projection (0–100%) based on structure match, volatility, and direction alignment.
📦 What Appears on Chart
Projection Box:
A forward-drawn rectangle from the current bar to the estimated future zone. The box's size and duration mirror the last valid momentum leg.
Box Label Text:
🔹 Range (projected move size)
⏱️ Duration (bars expected)
✅ Confidence %
VPH/VPL Markers:
Pivot highs and lows confirmed by volume, marked with “VPH” or “VPL”.
🎯 How to Trade with It
Use the box as a target zone for directional trades.
If price enters a box with >85% confidence, consider it a high-quality path projection.
Use with support/resistance confluence or entry systems.
Works especially well for swing trading, breakout setups, or options targeting.
🛠️ Recommended Settings
Box Transparency: Set Projection Up/Down Color to 90 (10% visible).
Text Color: Set to white for readability.
Volume Multiplier: Default 1.5x, increase in choppy markets.
Projection Duration: Start with 1.0x echo multiplier and fine-tune.
⏳ Timeframes & Accuracy
Timeframe Confidence Zones Most Reliable
15m – 1h Use 70–85% confidence scores
1h – 4h Sweet spot for balanced signals
1D – 1W Strongest historical echo tracking (>85% ideal)
✅ Key Features
Forward-looking, non-repainting logic
Clear visual projections — no guesswork
Confidence scoring built-in
ATR-adjusted — adapts to volatility
Works on any asset (stocks, crypto, FX)
🧠 Why It’s Unique
This is not a lagging oscillator or classic trend-following tool.
It’s a leading structure projection model — combining pivot behavior, volume intensity, and market volatility to sketch forward “echo zones” based on the past.
Volume Weighted Sign ChangeThe VWSCI measures the relationship between price reversals and volume. Specifically, it calculates the proportion of total volume in a given window that occurs at bars where the price changes direction—i.e., where the price difference switches from positive to negative or vice versa, indicating a local maximum or minimum.
• Low VWSCI values (close to 0) suggest that little volume is associated with price reversals, which typically occurs in strong trending markets where price moves consistently in one direction with high volume, and pullbacks (if any) occur on low volume.
• High VWSCI values (closer to 100) indicate that a significant portion of the volume is tied to price turning points, which is characteristic of a ranging or choppy market with frequent reversals.
This approach combines price action (via sign changes in price differences) and volume, offering a novel twist on traditional momentum or volume-based indicators like RSI, OBV, or the Volume-Price Trend.

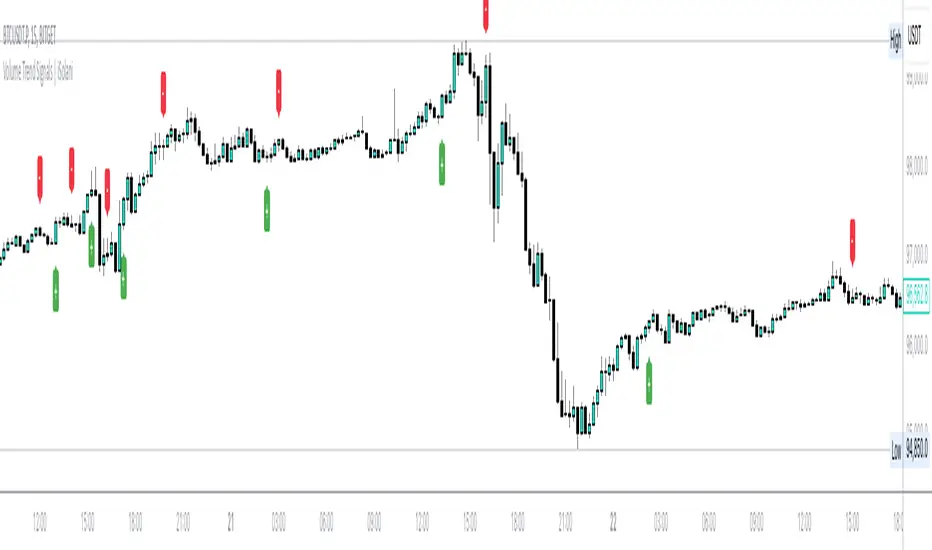
Volume Trend Signals | iSolani
Volume Trend Signals | iSolani: Syncing Price Momentum with Volume Confirmation
In the dance between price action and volume, discerning true trend commitment requires seeing how institutional players vote with their capital. The Volume Trend Signals | iSolani illuminates this interplay by generating precise crossover signals when volume-accelerated price movements gain sustained traction. Unlike conventional volume oscillators, it employs a two-layered confirmation system —blending volatility-adjusted thresholds with adaptive smoothing—to spotlight high-probability entries aligned with smart-money activity.
Core Methodology
The indicator executes a five-phase process to filter meaningful trends:
Logarithmic Price Scaling: Measures percentage-based price changes via HLC3 typical price, reducing large-value bias in volatile markets.
Volatility Dynamic Filter: Uses a 30-bar standard deviation of price changes, scaled by user sensitivity (default 2x), to set momentum thresholds.
Volume Governance: Caps raw volume at 3x its 40-bar SMA, neutralizing outlier spikes while preserving institutional footprints.
Directional Flow Accumulation: Sums volume as positive/negative based on whether price movement breaches volatility-derived boundaries.
Signal Refinement: Smooths the Volume Flow Indicator (VFI) with a 3-bar SMA, then triggers alerts via crosses over a 20-bar EMA signal line.
Breaking New Ground
This tool introduces three evolutionary improvements over traditional volume indicators:
EMA Convergence Signals: Unlike basic zero-cross systems, it requires VFI to overtake its own EMA, confirming sustained momentum shifts.
Context-Aware Volume: The 3x volume cap adapts to current market activity, preventing false signals during news-driven liquidity spikes.
Minimalist Visual Alerts: Uses and symbols below/above candles, reducing chart clutter while emphasizing pivotal moments.
Engine Under the Hood
The script’s logic flows through four computational stages:
Data Conditioning: Computes HLC3 and its log-based rate of change for normalized price analysis.
Threshold Calibration: Derives dynamic entry/exit levels from 30-period volatility multiplied by user sensitivity.
Volume Processing: Filters and signs volume based on price meeting threshold criteria.
Signal Generation: Triggers buy/sell labels when the 3-bar SMA of cumulative flow crosses the 20-bar EMA.
Standard Configuration
Optimized defaults balance responsiveness and reliability:
VFI Length: 40-bar accumulation window
Sensitivity: 2.0 (double the volatility-derived threshold)
Signal Smoothing: 20-bar EMA
Volume Cap: 3x average (hidden parameter)
Smoothing: Enabled (3-bar SMA on VFI)
By fusing adaptive volume filtering with EMA-confirmed momentum, the Volume Trend Signals | iSolani cuts through market noise to reveal institutional-grade trend inflection points. Its unique crossover logic—prioritizing confirmation over speed—makes it particularly effective in swing trading and trend-following strategies across equities, commodities, and forex markets.
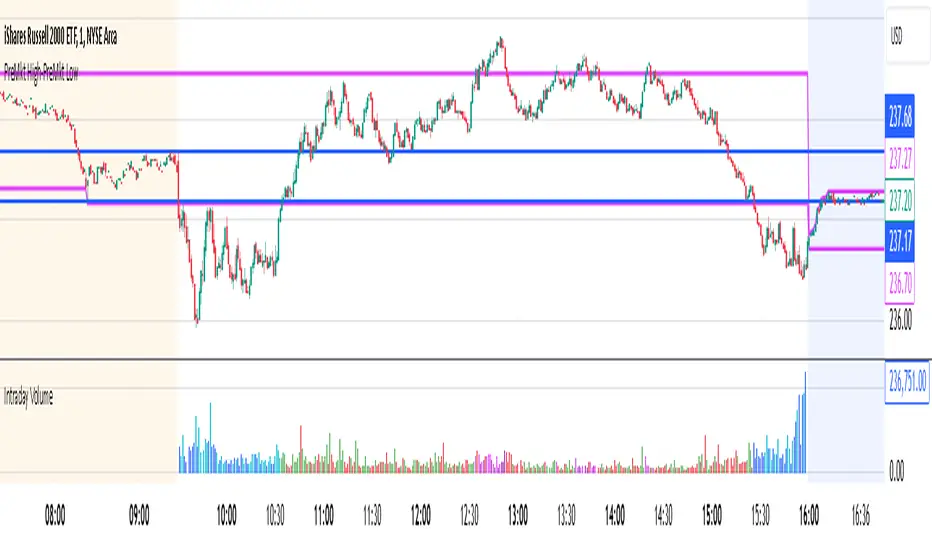
Intraday Volume### Intraday Volume Indicator Explanation
--- this was Mostly created by OpenAI ChatGPT --- it's pretty good!
--- My Commentary: One of the problems I find is with Volume is - it is skewed by the overwhelming volume around the Open and Close. So, as an experiment, I asked ChatGPT to create an indicator to plot the volume everywhere BUT the open.
I added in the CandleColor() function and set the times.
I also changed the Intraday Volume calculation from Cumulative to live.
still Chat GPT - did about 90% of the heavy lift! And, wrote the summary !
----
The "Intraday Volume" indicator is a custom script designed for use on the TradingView platform. It provides a visual representation of the total accumulated trading volume during the intraday trading session, specifically between the market open and close times. Below is a detailed explanation of its functionality:
#### **Key Features:**
1. **Session Times:**
- The indicator defines the intraday session as the period between 9:30 AM EST (market open) and 4:00 PM EST (market close).
- It uses the `timestamp` function to set these times dynamically for each trading day.
2. **Intraday Volume Calculation:**
- During the defined intraday session, the indicator accumulates the trading volume from each bar (candlestick).
- Outside the intraday session, the volume is reset to `na` (not available) to ensure only intraday data is plotted.
3. **Plotting the Volume:**
- The accumulated intraday volume is plotted as a blue column chart in a separate pane below the price chart.
- This provides a clear visualization of how the trading volume evolves throughout the trading session.
4. **Horizontal Reference Line:**
- A horizontal line is added at zero as a visual reference, making it easier to interpret the volume data.
#### **Use Cases:**
- **Volume Analysis:**
- Traders can use the indicator to identify periods of high or low trading activity during the intraday session.
- Peaks in the volume chart may correspond to key market events, such as news releases or significant price movements.
- **Trend Confirmation:**
- Comparing intraday volume with price action can help traders confirm the strength of a trend or the likelihood of a reversal.
- **Custom Time Frames:**
- Although this script is tailored for regular U.S. market hours, it can be adapted for other markets or time zones by modifying the session times.
#### **Customization:**
- **Colors and Styles:**
- The plot color (blue) and style (columns) can be customized to suit user preferences.
- **Session Times:**
- Users can change the session start and end times to match their trading needs or regional market hours.
This indicator is especially useful for intraday traders seeking insights into trading volume dynamics within the trading day. By visualizing the intraday volume, traders can gain a deeper understanding of market behavior and make informed decisions.
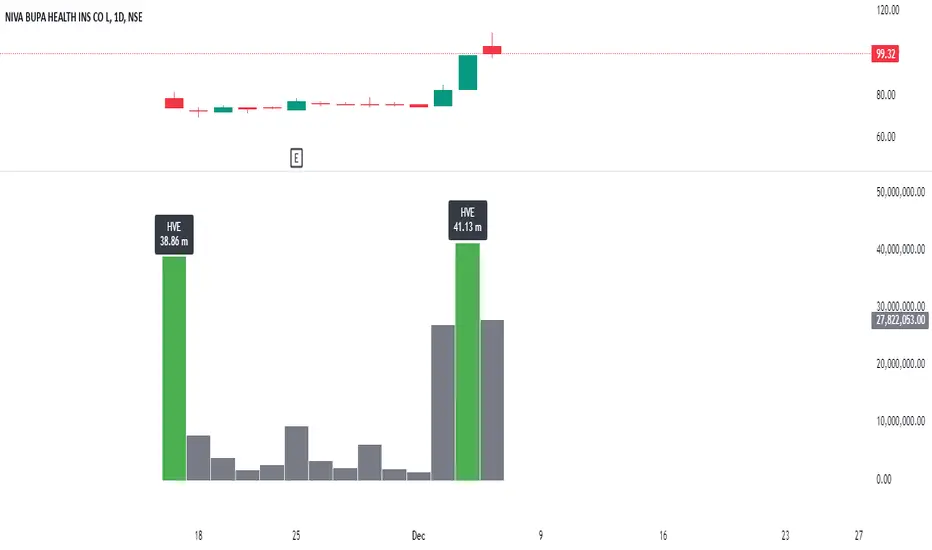
Highest Volume EverOverview:
The Highest Volume Ever (HVE) indicator highlights the highest volume bar in the visible chart history. It visually emphasizes significant volume spikes, helping traders identify key moments of market activity, such as breakout signals or accumulation phases.
Key Features:
Automatic Detection of Highest Volume:
The indicator dynamically scans the entire chart history to identify the bar with the highest trading volume, marking it with a clearly visible label.
Volume in Millions:
The label displays the highest volume in millions, providing a concise and readable format for better interpretation.
Adaptive Positioning:
The label is positioned slightly above the volume bar, ensuring it doesn't obstruct other chart elements while remaining close to the bar for easy reference.
Use Cases:
Identify Significant Market Activity: Detect periods of unusually high volume, often indicating the start of strong trends or the end of consolidations.
Confirm Breakouts: High volume often confirms the strength of breakout moves.
Spot Accumulation or Distribution: Unusually high volume can signal institutional buying or selling.
How to Use:
Add the indicator to your chart on TradingView.
The highest volume bar will be highlighted with a green bar and an "HVE" label above it.
Adjust the chart range to see how the indicator dynamically updates.
Perfect for:
Traders who rely on volume analysis to confirm price movements and detect significant market events.
Volume on levels @gauranshgVolume on Levels @gauranshg is a powerful Pine Script designed to visualize trading volume across price levels directly on the chart. This script allows users to observe volume intensity, offering a clearer perspective on price action and potential support/resistance areas. By utilizing a dynamic, customizable multiplier, the volume is normalized and displayed in proportion, ensuring better scalability across various timeframes and assets.
Usage:
Normalization of Volume: Users can input a multiplier to adjust the normalization of volume. This is useful when analyzing assets with differing price and volume ranges.
Input of 1 means 1 Million volume will be marked with green color of opacity 1 and 2 Million as 2 and so on. In case you are looking at chart with very high volume, you might want to increase the multiplies
Default multiplier is set to 1, and can be customized for different scales.
Volume Visualization: The volume is displayed on the chart as background boxes behind price levels, with the opacity of the boxes changing based on the normalized volume. This helps to quickly visualize areas of high and low trading activity.
This script is ideal for investors who wish to enhance their volume analysis by visualizing it directly on price levels in a clear, normalized format.

Auto Anchored Volume ProfileAuto Anchored Volume profile indicator to identify potential support and resistance zones, along with weak and strong Point of Control (POC) levels.
Understanding the Concepts:
Volume Profile: This chart depicts trading activity at various price levels over a chosen timeframe. Higher volume areas represent price levels where most buying and selling happened.
Point of Control (POC): The price level with the highest volume traded within the timeframe. It represents the price where most agreement existed between buyers and sellers.
High Volume Nodes (HVN): Areas on the volume profile with significantly higher volume compared to surrounding areas. These can indicate potential support or resistance.
Delta (Sentimental): This volume profile type shows the difference between buying and selling volume at each price level. Positive delta indicates buying dominance, while negative delta suggests selling pressure.
Strategy Breakdown:
Identify Volume Shelves:
Look for areas with concentrated volume on the profile. These areas, called shelves, can act as support (high volume at lower prices) or resistance (high volume at higher prices).
Analyze POC Strength (POC Volume Percentage):
Calculate the Volume Percentage: (Volume at Price Level / Maximum HVN Volume over the Period) * 100
This ratio indicates the significance of the POC relative to the strongest volume area.
A high percentage suggests a strong POC, potentially indicating a more reliable support or resistance level.
A low percentage suggests a weak POC, with a higher chance of price breaking through that level.
Leverage Previous Session Data:
The strategy incorporates data from the previous session's POC and Highest Delta Node. These are displayed on the right side of the chart, extending the volume profile for reference.
Identify if the current price is trading above or below the previous session's POC. This can provide context for potential price direction.
The Highest Delta Node from the previous session indicates areas of strong buying or selling sentiment that might carry over to the current session.
Additional Anchor Point Types:
Pivot Points and Fixed Range Volume Profile can be added for further confirmation of support and resistance zones.
Pivot points are calculated automatically based on the price changes direction
Fixed Range Volume Profile focuses on a specific price range, allowing detailed analysis within that zone.
Timeframe Considerations(AUTO):
The resolution for calculating pivot points is determined automatically:
- For intraday resolutions up to and including 15 minutes, the daily (1D) timeframe is used.
- For intraday resolutions more than 15 minutes, the weekly (1W) timeframe is used.
- For daily resolutions, the monthly (1M) timeframe is used.
- For weekly and monthly resolutions, the 12-month (12M) timeframe is used.
Trading with the Strategy:
Look for price approaching a volume shelf identified on the profile.
Analyze the POC Volume Percentage to gauge the strength of the POC as potential support or resistance.
Consider the previous session's POC and Highest Delta Node for additional context.
Combine volume profile insights with other technical indicators and price action confirmation for entry and exit signals.
Remember, strong POCs with high volume shelves suggest more reliable support/resistance, while weak POCs indicate a higher chance of price movement beyond that level.
Important Notes:
Volume profile is a tool to identify potential trading zones, not a guaranteed predictor of future price movements.
Always practice proper risk management techniques, including stop-loss orders.
Backtest this strategy on historical data to understand its effectiveness before risking real capital.
By understanding volume distribution and POC strength, this strategy can help you make informed trading decisions based on where most buying and selling activity has occurred. Remember, a comprehensive trading approach that considers multiple factors is crucial for success.

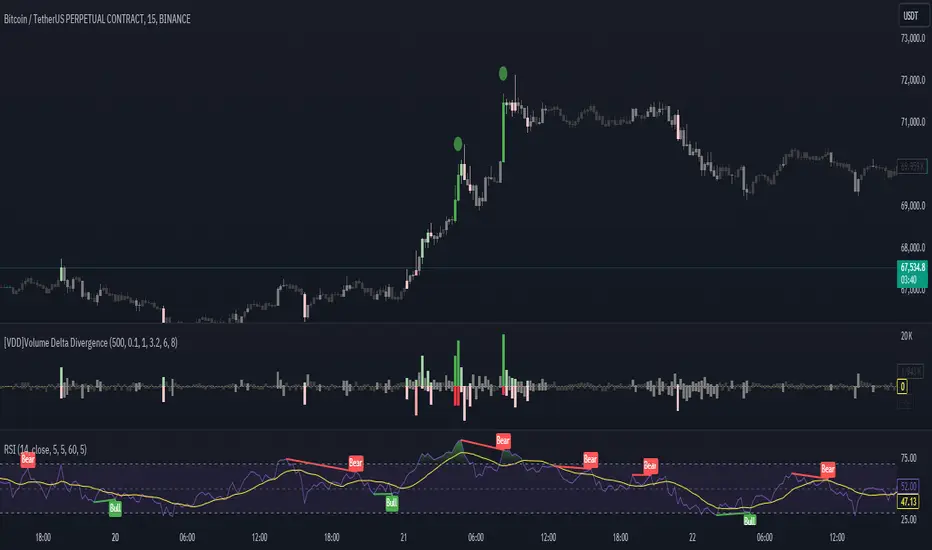
[VDD]Volume Delta DivergenceThis indicator displays volume candles bidirectionally and indicates the strength of the volume. It can create better synergy when used together with the Momentum Squeeze Indicator and can be very useful for bottom and top catching. I am continually modifying it for additional features, so please evaluate it with that in mind.
KillZones & Sessions [TradingFinder] Volume | Asia, London & NY🔵 Introduction
🟣 Session
The forex market operates 24 hours a day, 5 days a week, with only Saturdays and Sundays being off; traders often focus on one of the forex trading sessions instead of trying to trade in all markets 24 hours a day.
Trading sessions are time intervals during which a specific financial market is active and trades are conducted. The Asia, London, and New York sessions are the most important trading sessions throughout the 24-hour period, during which a significant amount of money and liquidity enters the market.
🟣 Kill Zone
Traders in financial markets profit from the difference between the price at which they buy or sell and the current market price. Traders have different time horizons for trading.
Among these, some traders engage in daily or even hourly trading and must operate during times when the market has desirable trading volumes and significant price movements.
Kill zones are segments of a session with higher trading volumes and price fluctuations compared to the rest of the session.
🔵 How to Use
🟣 Session Time
The "Asia Session" consists of two sessions: "Sydney" and "Tokyo." The beginning of this session, according to the "UTC" time zone, is at 23:00 and ends at 06:00. Similarly, the beginning of the "Asia KillZone," according to the "UTC" time zone, is at 23:00, and it ends at 03:55.
The "London Session" consists of two sessions: "Frankfurt" and "London." The beginning of this session, according to the "UTC" time zone, is at 07:00, and it ends at 14:25. Similarly, the beginning of the "London KillZone," according to the "UTC" time zone, is at 07:00, and it ends at 09:55.
The beginning of the "New York am" session, according to the "UTC" time zone, is at 14:30, and it ends at 19:25. Similarly, the beginning of the "New York am KillZone," according to the "UTC" time zone, is at 14:30, and it ends at 16:55.
The beginning of the "New York pm" session, according to the "UTC" time zone, is at 19:30, and it ends at 22:55. Similarly, the beginning of the "New York pm KillZone," according to the "UTC" time zone, is at 19:30, and it ends at 20:55.
Important : To prevent session overlap, the working hours of each session have slightly changed.
🔵 Features
🟣 Simultaneous Session and Kill Zone
With this indicator, you can simultaneously view the kill zone and session. High and low lines are used to indicate sessions, while filled areas with color represent kill zones. If you do not want to see kill zones, you can turn off the display settings.
🟣 Candle, Time, and Volume
Using the "More Info" feature, you can see the number of candles, elapsed time, and traded volume within the colored filled area.
🔵 Settings
•Show More Info: To display "More Info," you need to turn on this feature and turn it off whenever you don't need it.
• You can also customize these settings for each session separately :
o Display or hide session.
o Choose session color.
o Set session time range.
o Display or hide kill zone.
o Set kill zone time range.

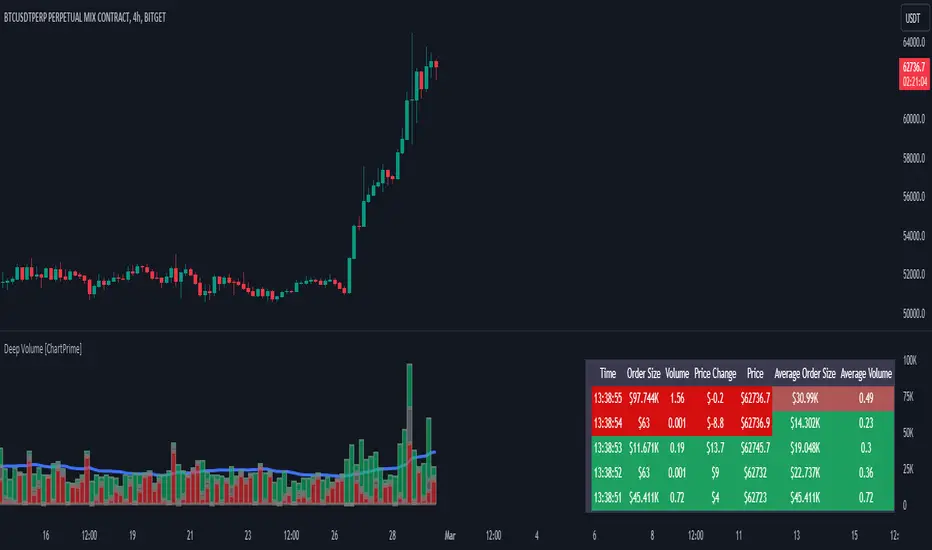
Deep Volume [ChartPrime]Deep Volume is an indicator designed to give you high fidelity volume information. It does this by utilizing real time data provided by Tradingview to generate a wide range of metrics. We have included a convenient column chart to visualize the polarity of the volume, and a table to see the real time data. This works by utilizing pine script's varip feature to get information within candles. This is convenient as it allows users to get lower time frame information without the use of ltf functions. The result is seconds level data with out the need to be on a lower time frame chart. As a result, as you increase the time frame of the chart the updates will become slower. This is because Tradingview doesn't update the chart information as frequently on higher time frames as there isn't as much of a need.
This indicator works on real time data so to compensate for this we generate a simulated history based on candle structure. This helps in estimating the state of the moving average before the real time data starts. As a result the estimated history isn't as accurate and should be treated as such. That being said it is nice to have an estimation when the indicator is first loaded onto the chart.
Finally we have included a cumulative volume comparison that shows you how much volume there is compared to the average cumulative volume for the day. This metric utilizes a gradient to help you interpret the information at a glance. Low daily volume is represented with grays by default, while normal volume and greater is represented with a green color by default.
The table is partitioned into two sections; tick data, and average data. On the left you will see color coded information based on the direction of the move. On the left, the information is color coded based on the average movement direction. You can control how much information is displayed in the table within the indicators settings. This is defaulted to 20 but it can be as long or short as you like. Every new candle open the far left of the table you will see a 🗘 symbol and at the start of a new session you will see a 🗓 symbol.
The included metrics are as follows:
Time: This displays the time of the real time data update.
Time Delta: This displays the elapsed time between updates.
Order Size: This is the volume times the price change between updates.
Volume: This is the volume change for the update.
Price Change: This is the change in price since the last update.
Price: This is the price of the asset at the time of the update.
Speed of Tape: This is the average time delta. Use this to see how quickly the market is moving.
Average Order Size: This is the average order size.
Average Volume: This is the average volume
Volume Ratio: This the the ratio of bullish to bearish volume as expressed by a percent. 100% is all bullish within the window and -100% is all bearish within the window.
Average Price Change: This is the average price change within the window.
Sensitivity: This is a volatility metric designed to show you the price change per 1 volume unit.
Relative Sensitivity: This is a volatility metric designed to show you the average price change per average volume.
Enjoy
Volume Speed [By MUQWISHI]▋ INTRODUCTION :
The “Volume Dynamic Scale Bar” is a method for determining the dominance of volume flow over a selected length and timeframe, indicating whether buyers or sellers are in control. In addition, it detects the average speed of volume flow over a specified period. This indicator is almost equivalent to Time & Sales (Tape) .
_______________________
▋ OVERVIEW:
_______________________
▋ ELEMENTS
(1) Volume Dynamic Scale Bar. As we observe, it has similar total up and down volume values to what we're seeing in the table. Note they have similar default inputs.
(2) A notice of a significant volume came.
(3) It estimates the speed of the average volume flow. In the tooltip, it shows the maximum and minimum recorded speeds along with the time since the chart was updated.
(4) Info of entered length and the selected timeframe.
(5) The widget will flash gradually for 3 seconds when there’s a significant volume occurred based on the selected timeframe.
_______________________
▋ INDICATOR SETTINGS:
(1) Timezone.
(2) Widget location and size on chart.
(3) Up & Down volume colors.
(4) Option to enable a visual flash when a single volume is more than {X value} of Average. For instance, 2 → means double the average volume.
(5) Fetch data from the selected lower timeframe.
(6) Number of bars at chosen timeframe.
(7) Volume OR Price Volume.
_____________________
▋ COMMENT:
The Volume Dynamic Scale Bar should not be taken as a major concept to build a trading decision.
Please let me know if you have any questions.
Thank you.

Filtered Volume Profile [ChartPrime]The "Filtered Volume Profile" is a powerful tool that offers insights into market activity. It's a technical analysis tool used to understand the behavior of financial markets. It uses a fixed range volume profile to provide a histogram representing how much volume occurred at distinct price levels.
Profile in action with various significant levels displayed
How to Use
The script is designed to analyze cumulative trading volumes in different price bins over a certain period, also known as `'lookback'`. This lookback period can be defined by the user and it represents the number of bars to look back for calculating levels of support and resistance.
The `'Smoothing'` input determines the degree to which the output is smoothed. Higher values lead to smoother results but may impede the responsiveness of the indicator to rapid changes in volatility.
The `'Peak Sensitivity'` input is used to adjust the sensitivity of the script's peak detection algorithm. Setting this to a lower value makes the algorithm more sensitive to local changes in trading volume and may result in "noisier" outputs.
The `'Peak Threshold'` input specifies the number of bins that the peak detection mechanism should account for. Larger numbers imply that more volume bins are taken into account, and the resultant peaks are based on wider intervals.
The `'Mean Score Length'` input is used for scaling the mean score range. This is particularly important in defining the length of lookback bars that will be used to calculate the average close price.
Sinc Filter
The application of the sinc-filter to the Filtered Volume Profile reduces the risk of viewing artefacts that may misrepresent the underlying market behavior. Sinc filtering is a high-quality and sharp filter that doesn't manifest any ringing effects, making it an optimal choice for such volume profiling.
Histogram
On the histogram, the volume profile is colored based on the balance of bullish to bearish volume. If a particular bar is more intense in color, it represents a larger than usual volume during a single price bar. This is a clear signal of a strong buying or selling pressure at a particular price level.
Threshold for Peaks
The `peak_thresh` input determines the number of bins the algorithm takes in account for the peak detection feature. The 'peak' represents the level where a significant amount of volume trading has occurred, and usually is of interest as an indicative of support or resistance level.
By increasing the `peak_thresh`, you're raising the bar for what the algorithm perceives as a peak. This could result in fewer, but more significant peaks being identified.
History of Volume Profiles and Evolution into Sinc Filtering
Volume profiling has a rich history in market analysis, dating back to the 1950s when Richard D. Wyckoff, a legendary trader, introduced the concept of volume studies. He understood the critical significance of volume and its relationship with market price movement. The core of Wyckoff's technical analysis suite was the relationship between prices and volume, often termed as "Effort vs Results".
Moving forward, in the early 1800s, the esteemed mathematician J. R. Carson made key improvements to the sinc function, which formed the basis for sinc filtering application in time series data. Following these contributions, trading studies continued to create and integrate more advanced statistical measures into market analysis.
This culminated in the 1980s with J. Peter Steidlmayer’s introduction of Market Profile. He suggested that markets were a function of continuous two-way auction processes thus introducing the concept of viewing markets in price/time continuum and price distribution forms. Steidlmayer's Market Profile was the first wide-scale operation of organized volume and price data.
However, despite the introduction of such features, challenges in the analysis persisted, especially due to noise that could misinform trading decisions. This gap has given rise to the need for smoothing functions to help eliminate the noise and better interpret the data. Among such techniques, the sinc filter has become widely recognized within the trading community.
The sinc filter, because of its properties of constructing a smooth passing through all data points precisely and its ability to eliminate high-frequency noise, has been considered a natural transition in the evolution of volume profile strategies. The superior ability of the sinc filter to reduce noise and shield against over-fitting makes it an ideal choice for smoothing purposes in trading scripts, particularly where volume profiling forms the crux of the market analysis strategy, such as in Filtered Volume Profile.
Moving ahead, the use of volume-based studies seems likely to remain a core part of technical analysis. As long as markets operate based on supply and demand principles, understanding volume will remain key to discerning the intent behind price movements. And with the incorporation of advanced methods like sinc filtering, the accuracy and insight provided by these methodologies will only improve.
Mean Score
The mean score in the Filtered Volume Profile script plays an important role in probabilistic inferences regarding future price direction. This score essentially characterizes the statistical likelihood of price trends based on historical data.
The mean score is calculated over a configurable `'Mean Score Length'`. This variable sets the window or the timeframe for calculation of the mean score of the closing prices.
Statistically, this score takes advantage of the concept of z-scores and probabilities associated with the t-distribution (a type of probability distribution that is symmetric and bell-shaped, just like the standard normal distribution, but has heavier tails).
The z-score represents how many standard deviations an element is from the mean. In this case, the "element" is the price level (Point of Control).
The mean score section of the script calculates standard errors for the root mean squared error (RMSE) and addresses the uncertainty in the prediction of the future value of a random variable.
The RMSE of a model prediction concerning observed values is used to measure the differences between values predicted by a model and the values observed.
The lower the RMSE, the better the model is able to predict. A zero RMSE means a perfect fit to the data. In essence, it's a measure of how concentrated the data is around the line of best fit.
Through the mean score, the script effectively predicts the likelihood of the future close price being above or below our identified price level.
Summary
Filtered Volume Profile is a comprehensive trading view indicator which utilizes volume profiling, peak detection, mean score computations, and sinc-filter smoothing, altogether providing the finer details of market behavior.
It offers a customizable look back period, smoothing options, and peak sensitivity setting along with a uniquely set peak threshold. The application of the Sinc Filter ensures a high level of accuracy and noise reduction in volume profiling, making this script a reliable tool for gaining market insights.
Furthermore, the use of mean score calculations provides probabilistic insights into price movements, thus providing traders with a statistically sound foundation for their trading decisions. As trading markets advance, the use of such methodologies plays a pivotal role in formulating effective trading strategies and the Filtered Volume Profile is a successful embodiment of such advancements in the field of market analysis.

Price Range Volume Profile [Pt]█ Introduction
The Price Range Volume Profile (PRVP) is a revolutionary indicator. This tool stands out from its peers due to its unique ability to capture the entire price chart history, thus providing a comprehensive volume profile of the entire asset's trading history, as available on TradingView chart. It's worth noting that I believe this tool is the first of its kind to accomplish such a feat. A much recommended tool if you are a volume profile trader.
█ Main Features
► Historical Lookback: This feature dives deep into the past, grasping all the historical data of an asset. It's equipped to handle up to 20,000 bars, although users without a premium TradingView account are advised to keep it at a maximum of 10,000 bars, or just use the "Full Historical Lookback" feature.
► Volume Profile / POC: Displays the distribution of volume across price levels for the selected price range. The Point of Control (POC), which is the price level with the highest traded volume, is also highlighted.
► Customization: Users have the flexibility to adjust the profile's appearance, including profile width, horizontal offset, and the option to fill the background of the profile range.
► Time Weighting: This feature allows users to give more weight to recent trading activity, which can be especially useful for intraday traders or during times of high volatility. Note that this feature will impact the volume profile and POC level.
► Settings Table: A settings table is displayed on the chart for users to quickly reference their input parameters.
█ Input Parameters
► Lookback Timeframe: Determines the period for which the volume profile is generated.
► Price Range: The percentage distance to consider for the profile, adjusted above and below the current closing price.
► Profile Step size: The granularity of the volume profile. Users can opt for automatic step size based on a predefined calculation or set their preferred tick step size.
► Historical Bars Lookback: Determines the number of bars to include in the volume profile calculation.
► Profile Visuals: Adjust the appearance and layout of the volume profile on the chart.
► Extra: Additional settings including the display of a settings table and its location.
█ Basic Understanding of Volume Profile - How to use PRVP?
Volume Profile is a valuable tool for traders who want insights into where the majority of trading activity has occurred. Here are some tips to make the most of it:
► Understand the Basics: Before using the Volume Profile, ensure you understand the difference between it and the standard volume histogram. While both represent volume, the former displays it against price while the latter shows it against time.
► Identify High Volume Nodes (HVN) and Low Volume Nodes (LVN):
◊ HVN: Areas where there's a lot of trading activity and where the price has spent a lot of time. These areas can act as strong support or resistance.
◊ LVN: Areas where there's a lack of trading activity. Prices might move quickly through these areas, and they can act as potential breakpoints or accelerators for price movement.
► Locate the Point of Control (POC): This is the price level with the highest traded volume for a specified period. It often acts as a magnet for price, and it can serve as a pivot or reference point.
► Trend Confirmation: A shift in the volume profile from one price level to another can confirm a trend. For instance, if higher volume starts to build at higher price levels, it may indicate a strong uptrend.
► Watch for Volume Gaps: If there's a significant gap in the volume profile, prices may move quickly through these levels as there's little historical trading activity to act as support or resistance.
█ Other Usage Tips
◊ For optimal performance, ensure that the chosen timeframe aligns closely with the chart timeframe. Differences in timeframes may lead to minor discrepancies in the volume profile.
◊ To address any errors arising from too many levels displayed on the volume profile, consider increasing the Profile Step size or reducing the Price Range.

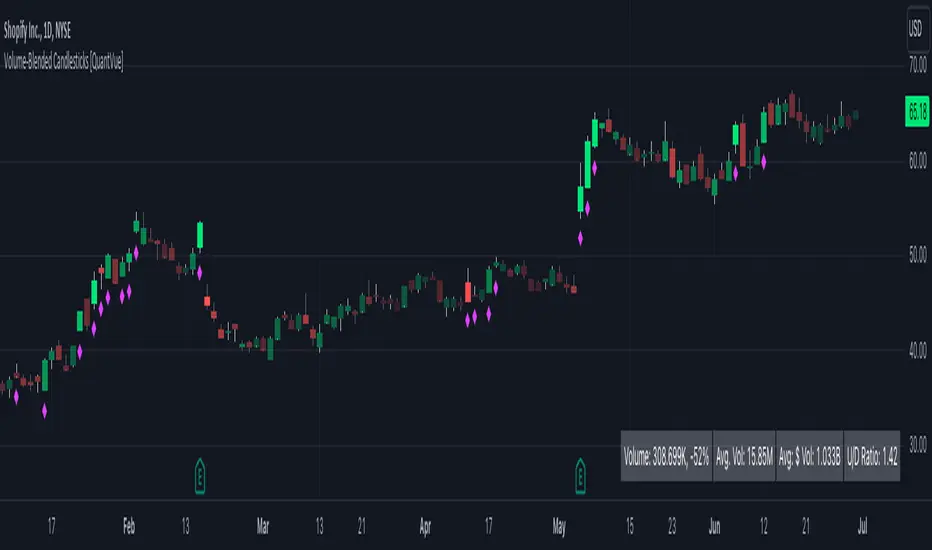
Volume-Blended Candlesticks [QuantVue]Introducing the Volume-Blended Candlestick Indicator, a powerful tool that seamlessly integrates volume information with candlesticks, providing you with a comprehensive view of market dynamics in a single glance.
The Volume-Blended Candlestick Indicator employs a unique approach of projecting volume totals by calculating the total volume traded per second and comparing it to the time left in the session as well as the historical average length selected by the user.
The indicator then dynamically adjusts the opacity of the candlestick colors based on the intensity of the projected volume. As volume intensifies, the candlestick colors become more pronounced, while low volume will cause colors to fade allowing you to visually perceive the level of buying or selling.
One of the standout features of the Volume-Blended Candlestick Indicator is its ability to identify pocket pivots. A pocket pivot is an up day with volume greater than any of the down days volume in the past 10 days. By highlighting these pocket pivots on your chart, the indicator helps you identify potential stealth accumulation.
In addition to blending volume with candlesticks and spotting pocket pivots, this versatile indicator provides you with an insightful table displaying key volume metrics. The table includes the average volume, average dollar volume, and the up-down volume ratio, allowing you to get a clear picture of buying and selling pressure.
Settings Include:
🔹Sensitivty Level: Normal, More, Less
🔹Volume MA Length
🔹Toggle Color based on previous close
🔹Show or hide volume info
🔹Chose candlestick colors
🔹Show or hide pocket pivots
🔹Show or hide volume info table
Don't hesitate to reach out with any questions or concerns.
We hope you enjoy!
Cheers.