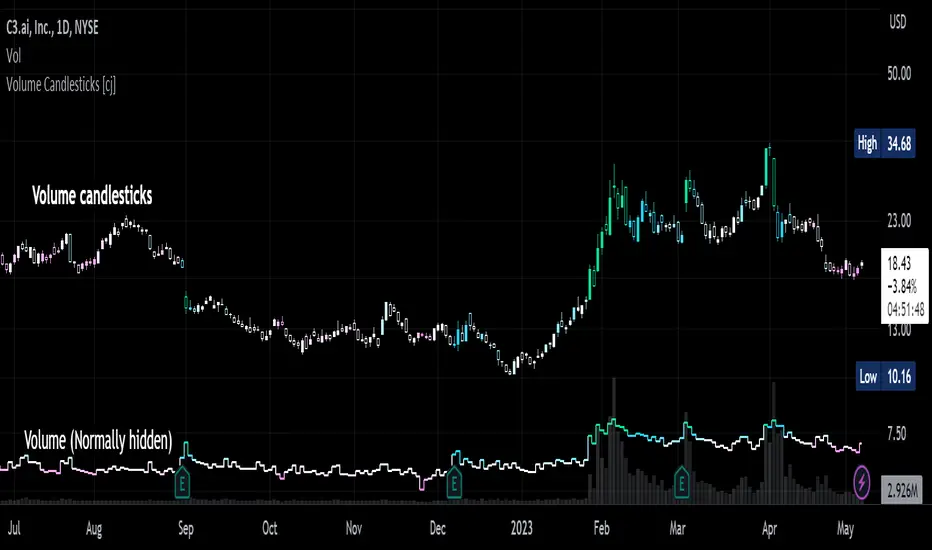
Volume Candlesticks [cajole]
This script lets you create the equivalent of "volume candlesticks" in TradingView.
"Volume candlesticks" normally vary their width according to the bar's volume. This script varies COLOUR instead of WIDTH.
Bar charts are also supported.
Candles/Bars are coloured by their distance from the average volume. You can also add a "huge volume" colour to further highlight the most extremely-high volume bars.
Note that volume is extrapolated for incomplete bars by default. So, if the average volume of the past 10 days is 5M shares, and 5M shares trade in the first 10% of today's session, that bar will be coloured as though 50M shares have traded. Set the "Extrapolate" option to 1.0 to disable this.
For this script to work properly, you should set TradingView's default candle/bar colours to be at least 20% transparent. By default, TradingView tends to overlay its own bars on top of indicators.
Nerdy details:
The script works best on a dark background, because it is easier to change the hue of white bars than of black bars. If you find a set of colours that work for white backgrounds, please comment with them!
The geometric mean is used instead of the arithmetic mean, to keep the 'average' from being strongly influenced by spikes. Bars are
then coloured by assuming a normal probability distribution and highlighting outliers. (This means that the first high-volume bars are coloured differently to later ones.)
Komut dosyalarını "volume" için ara
Volume-Weighted Closing Range (TG Fork)Volume-weighted closing range of each bar. Closing range is (high - close) relative to the length of the wick (high - low). A close at the top of the wick would be 100%, middle 50%, bottom 0%. This is then multiplied by volume to weight towards high volume bars.
A moving average is applied to visualize trend in volume-weighted closing range over time.
Options include changing the threshold of bullish closes. The default is 50%, but you can view a close above 40% as a bullish .
How to use:
Columns indicate per-bar closing range, and can be used as either a buying-selling pressure indicator, or as an overreaction detector (eg, bars that are abnormally big can be used to start a fading/contrarian trade next bars). Green means the bar closed in the upper range, red in the lower range.
The cloud is the moving average over several bars (by default using EMA). This tends to represent sentiment over a period of time, and hence trend/momentum. Can be used in any timescale, even on weekly, then this represents the market cycles.
If you like this indicator, please show the original author your appreciation:

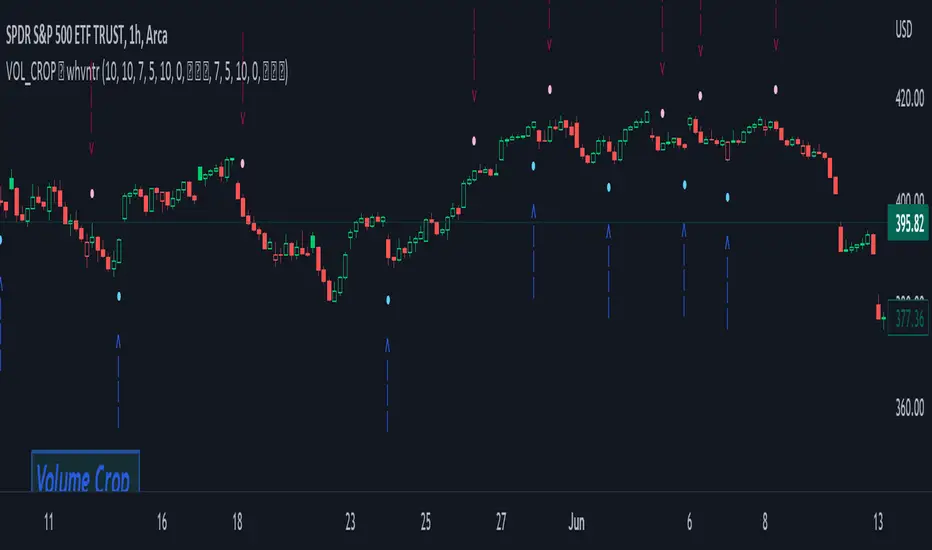
Volume Crop ━ Hidden Volume Divergence [whvntr] Volume Divergence
• Formula originated from: "Hidden Price Divergence" (circles) by TheLark. I did two things to harness its
effectiveness:
• Firstly, I developed a unique way to filter out the divergence signals that were appearing on both sides of the
midline. This filter will be known as the "Midline Tool" . It filters out a lot of the false signals commonly
associated with oscillators.
• Then, I modified the default format from Price to Volume.
• The midline formula "Midline Tool" was developed by me . It adjusts in the thousands since it's volume.
Let me know in the comments if you would rater have a smaller step value than 10,000. How does it work?
Crossover then Crossunder, the arrows only appear during the first sign of hidden volume divergence once
crossing the midline. Normally, these signs appear on both side of the midline both bearish and bullish no
matter if it's on an oversold or overbought side of the spectrum... Also, let
me know in the comments if you would like for me to release an oscillator version of this
indicator for co-witnessing.
Features:
• Volume divergence
• Midline Tool©
• Disclaimer: This indicator does not constitute investment advice. Trade at your own risk with the investments
you can afford to lose because all financial investments have risks and this is not a
guarantee that the volume divergence will be 100% all the time.
Volume Density w/barcolorOpacity limit set to 70 min & barcolor overlay
The transparency of each candle is based on volume density.
Volume density is calculated as follows.
Volume density = Volume / Price range
Price range uses true range "max(high - low, abs(high - close), abs(low - close))".
Since volume density varies drastically by stock or time, the transparency is calculated based on the deviation rate from the average volume density.
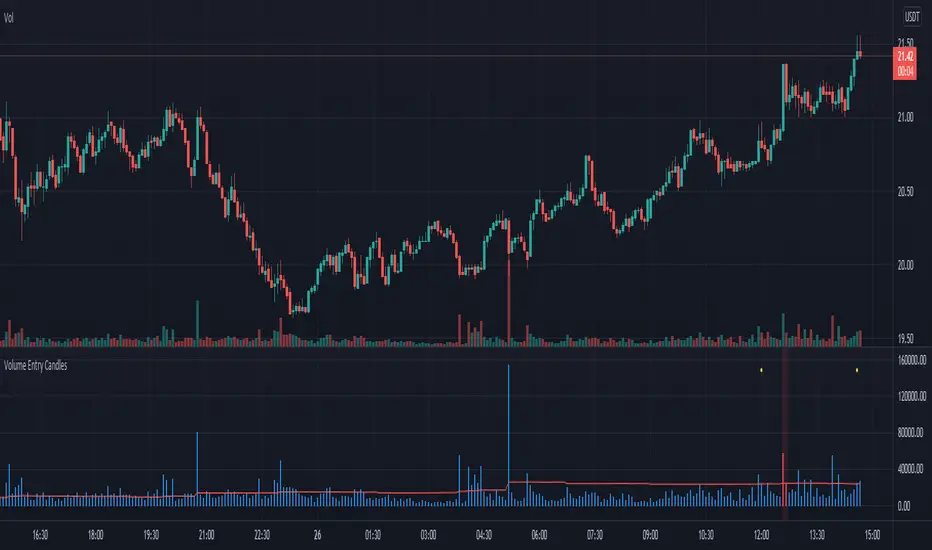
Volume Entry CandlesIntroduction
For Wyckoff, three things are important in analyzing the market: price, time, and volume . This indicator provides two types of signals:
- linked to large movements of volumes (red and purple circles on top);
- large price movements concerning volatility (green/red triangle up/down);
In the first case, it highlights the volumes that differ from the most common values, allowing us to trace the levels that the market feels.
Two levels highlight the volume peaks and two calculation methods can be chosen: by exponential moving average or by standard deviation.
In the second case, the signal is based on Volatility and highlights the cases in which the high and low of the last three candles exceed the ATR by a certain number of times. This may indicate situations where the market corrects the price after a fairly large move.
in addition, a table will give us statistical information that tells us:
- from how many candles a condition does not occur
- the average of the candles for which it occurs
- the maximum number of candles for which this condition has not occurred
Obviously, like any statistical tool, it is not intended as absolute certainty
Settings
Analyze all / Minutes: By checking the box, we analyze all the candles in the chart, removing the check will only analyze the period set in minutes.
Type of Level: Select the strategy to calculate the critical levels of the volumes, we can choose Ema or Standard Deviation.
Minimum tail in %: here we can exclude candles where tails aren't enough big, for example if we want to exclude candles without a tail. Use a negative value to ignore this control
We then have three groups:
- the first for the EMA ;
- the second for the Standard Deviation;
- the third for the ATR and its multiplier;
each has configuration parameters such as period and multiplier
Period: length for Ema , or Standard Deviation or ATR function
level1 and level2: they are the multipliers for the two levels
ATR multiplier: multiply the ATR value that must be exceeded by ( high-low ) of the last few candles
n candles: set the number of candles
Help
Show Vol Histogram to fine-tuning: if checked show histogram and lines to tune the indicator
Dimension: to set the histogram dimension
Base: set the price level where we want the histogram, in fact, the histogram is not dynamically displayed, it needs a price to appear
How to use
I follow this step for scalping trading:
- Select time frame 1 minute;
- Personally, I deselect "show the first level", and use only the second level;
- In the candles indicated by the purple circle and I draw a horizontal line on the closing of the candle;
- I can use the levels plotted with time frames at 1min also the time frames at 3min and 5 min
the volatility trigger appears as green/red columns in the histogram.
- green colors indicate a bullish reversal;
- red colors indicate a bearish reversal;
Example Bullish reversal
Moderate risk:
Entry point: above high
Stop loss: below low
High risk:
Entry point: a half body of the trigger candle
Stop loss: 1 ATR below the low of the trigger candle
Tips
Pair this indicator with some Moving Average and/or divergence indicator.
This is the twin of an indicator that I made, called "Volume Analysis". It's better if you prefer to analyze levels by yourself and keep the volume values always visible
Volume Price Change RatioMessing around with this two point selecting ability I recently learned about from Tradingview's CAGR. Here is a script that will tell you changes in volume(obv)/price, volume to price change ratio, and the average volume to price change ratio for the length you define in the settings menu. You can use this to compare the ratio of a current pump to an older pump to help assess the strength of a movement. Enjoy!

Volume Ranges (VSA)The script is intended for volume analysis
It shows if the volume is low, average, high or ultra-high.
Can be applied to any timeframe and any asset.
There're two calculation methods user can choose from:
1. Ranges - it allows to set a lookback period and moving average type to calculate averages
2. Deviations. In this case only one setting is applied - lookback period. Average type is not involved in this calculation method
Play around to figure out which one is better for you
Colors are:
Red - low volume
Green - avg volume
Yellow - high volume
Blue - ultra high volume

Volume RSI Crypto This is a special version RSI, in this case , I am using the volume, which is measuring the speed and change of volume to the price both up and down size.
Volume RSI attempts to gauge price trend changes via changes in bullish and bearish movements.
Its formula is :
VoRSI = 100 - 100 / (1 + VoRS)
where VoRS is Volume Relative Strength over specified period which is calculated as a ratio between averages of Up-Volumes and Down-Volumes:
VoRS = (Average Up-Volume) / (Average Down-Volume)
The logic for this strategy is simple
We entry long when we have a crossover with the Overbought level and we entry short when we have a crossunder with oversold level.
If you have any questions, please let me knw !

[AKM] VolumeVolume breakout as entry indicator. This indicator will mark the candle as the volume spike/surge, indicate that institution/big player a.k.a jerung/shark make their entry on the market. Please use this indicator along with the AKM Setup4 indicator, as your entry will be depending on the divider line indicate in indicator AKM Setup4.
Rules:
1. Make sure which one are the latest candle volume breakout.
2. Make sure the 1-2-3 pattern has been formed.
3. Your entry position will be based on divider line in AKM Setup4 indicator. Buy entry if the volume breakout happen in Buy Zone or vice versa.
Background Color = Volume that lower than the value set in Low Volume will be in yellow color. Green color will be indicate if close > open and volume bigger than Low Volume. Red color for open > close and volume bigger than Low Volume.
Volume Surge = This will mark a boundary if volume bigger than the value set in Low Volume until the new surge detected.
Average Volume = This will mark a boundary if volume bigger than the value set in Average Volume Candle Bar until the new surge detected.
Remarks : Default value is for Future Crude Palm Oil (FCPO) in 3 minutes timeframe.
Send us private message on TV to gain access to the indicator.

Volume xSMA ModSimple Volume indicator. showing rounded ratio of Current volume and simple moving average as xSMA (read as times SMA).
Quick metric to understand the impact of volume in trends, etc.
Example:
if Vol = 50 and SMA = 5
xSMA = 50/5 = 10
Indicated as the Third Number in Volume label.

Volume Price Analysis 2Best indicator for volume price analysis:
-Trend detection
-Breakout detection
-Fakeout detection
Use pure candlestick chart and volume .
No need to use any other indicator.
You can feel about the battle between bulls and bears.
Read my book for more information!

Volume Profile Delta & DOM @MaxMaserati 2.0Volume Profile Delta & DOM @Maxserati 2.0- Real Order Flow Analysis
What this indicator actually does!!!
Most volume indicators just show you total volume - which honestly doesn't tell you much. This one breaks down WHO is driving that volume. Big difference between 1000 shares of balanced buying/selling versus 800 buy + 200 sell. This tool shows you exactly that breakdown at every price level.
Trading without this kind of data means you're basically trading blind. Price action is important, but without knowing if smart money is buying or selling, you're mostly guessing. This gives you the same view that institutional traders have.
The main components
**DOM Display**: Shows real-time order flow with separate columns for buying and selling volume at each price level. You can toggle any column on/off depending on what you actually use.
**Volume Delta**: This is the key part - it shows net buying pressure (buy volume minus sell volume) at each price. When you see heavy buying at a support level, that's usually a good sign. When you see heavy selling at resistance, different story.
**Understanding the key columns:**
- **VPS (Volume Profile Sell)**: Shows selling volume (bid volume) at each price level - how much selling pressure exists
- **VPB (Volume Profile Buy)**: Shows buying volume (ask volume) at each price level - how much buying pressure exists
- **VPD (Volume Profile Delta)**: The difference between VPB and VPS (buy volume minus sell volume) - this tells you who's winning the battle at each price
**Time & Sales**: Live trade data with timestamps. There are filters so you can ignore the small retail trades and focus on the size that actually moves markets.
**Recent Activity**: Tracks momentum by showing cumulative buying/selling above and below current price. Useful for seeing if institutions are accumulating or distributing.
Why volume analysis works
Professional traders don't just look at price. They look at volume because volume precedes price movement. When smart money starts accumulating a position, you'll see it in the volume before you see it in price.
Think about it - if a stock is at $100 and someone wants to buy 100,000 shares, they can't just market buy it all at once without moving the price. They'll spread it out, but you can still see the accumulation pattern if you know where to look.
Real trading applications
**For day trading**: This works well for timing entries. If you see price breaking a level but volume delta is negative, that's usually a fake breakout. If volume confirms the move, much higher probability trade.
**For swing positions**: Great for finding accumulation zones. When you see consistent buying volume at certain levels over multiple days, institutions are likely building positions there.
**Risk management**: Volume shifts often happen before price reversals. If you're long and suddenly see heavy selling volume while price is still going up, that's a good exit signal.
Multi-market setup
Works on stocks, futures, forex, and crypto. The indicator automatically detects what type of market you're trading and adjusts accordingly. For forex it uses tick volume since real volume isn't available. For crypto it handles the decimal precision properly.
Customization options
You can show or hide any column depending on your trading style. If you're just scalping, maybe you only need price and delta. If you're doing deeper analysis, turn on all the columns.
There's color customization since everyone has their preferences, and text sizing because not everyone trades on huge monitors.
The indicator has both real-time and backtesting modes. Real-time for live trading, backtesting for developing strategies with historical volume data.
Learning curve
Fair warning - this isn't a simple moving average. There's a learning curve to reading order flow properly. Start by watching how volume patterns develop around known support and resistance levels.
Pay attention to volume divergences. If price makes a new high but volume delta is weaker, that's often a warning sign. If price breaks down but there's no real selling volume, it might be a false breakdown.
Performance notes
This processes a lot of data in real-time, so disable any columns you don't actually use. The more features you enable, the more processing power it needs.
Works best on lower timeframes (1-15 minutes) where you can see the tick-by-tick order flow. Still useful on higher timeframes but less granular.
## Bottom line
If you're serious about trading and want to see what institutional money is doing instead of just guessing from price action alone, this will help. It's not magic - you still need to understand market structure and have a trading plan. But it gives you information that most retail traders don't have access to.
The goal is to stop trading against smart money and start trading with them. Volume tells you where they're active.
---
*Works on all markets. Real volume for stocks/futures, tick volume for forex. Compatible with TradingView's replay feature for backtesting.*

Volume Momentum [BackQuant]Volume Momentum
The Volume Momentum indicator is designed to help traders identify shifts in market momentum based on volume data. By analyzing the relative volume momentum, this indicator provides insights into whether the market is gaining strength (uptrend) or losing momentum (downtrend). The strategy uses a combination of percentile-based volume normalization, weighted moving averages (WMA), and exponential moving averages (EMA) to assess volume trends.
The system focuses on the relationship between price and volume, utilizing normalized volume data to highlight key market changes. This approach allows traders to focus on volume-driven price movements, helping them to capture momentum shifts early.
Key Features
1. Volume Normalization and Percentile Calculation:
The signed volume (positive when the close is higher than the open, negative when the close is lower) is normalized against the rolling average volume. This normalized volume is then subjected to a percentile interpolation, allowing for a robust statistical measure of how the current volume compares to historical data. The percentile level is customizable, with 50 representing the median.
2. Weighted and Smoothed Moving Averages for Trend Detection:
The normalized volume is smoothed using weighted moving averages (WMA) and exponential moving averages (EMA). These smoothing techniques help eliminate noise, providing a clearer view of the underlying momentum. The WMA filters out short-term fluctuations, while the EMA ensures that the most recent data points have a higher weight, making the system more responsive to current market conditions.
3. Trend Reversal Detection:
The indicator detects momentum shifts by evaluating whether the volume momentum crosses above or below zero. A positive volume momentum indicates a potential uptrend, while a negative momentum suggests a possible downtrend. These trend reversals are identified through crossover and crossunder conditions, triggering alerts when significant changes occur.
4. Dynamic Trend Background and Bar Coloring:
The script offers customizable background coloring based on the trend direction. When volume momentum is positive, the background is colored green, indicating a bullish trend. When volume momentum is negative, the background is colored red, signaling a bearish trend. Additionally, the bars themselves can be colored based on the trend, further helping traders quickly visualize market momentum.
5. Alerts for Momentum Shifts:
The system provides real-time alerts for traders to monitor when volume momentum crosses a critical threshold (zero), signaling a trend reversal. The alerts notify traders when the market momentum turns bullish or bearish, assisting them in making timely decisions.
6. Customizable Parameters for Flexible Usage:
Users can fine-tune the behavior of the indicator by adjusting various parameters:
Volume Rolling Mean: The period used to calculate the average volume for normalization.
Percentile Interpolation Length: Defines the range over which the percentile is calculated.
Percentile Level: Determines the percentile threshold (e.g., 50 for the median).
WMA and Smoothing Periods: Control the smoothing and response time of the indicator.
7. Trend Background Visualization and Trend-Based Bar Coloring:
The background fill is shaded according to whether the volume momentum is positive or negative, providing a visual cue to indicate market strength. Additionally, bars can be color-coded to highlight the trend, making it easier to see the trend’s direction without needing to analyze numerical data manually.
8. Note on Mean-Reversion Strategy:
If you take the inverse of the signals, this indicator can be adapted for a mean-reversion strategy. Instead of following the trend, the strategy would involve buying assets that are underperforming and selling assets that are overperforming, based on volume momentum. However, it’s important to note that this approach may not work effectively on highly correlated assets, as their price movements may be too similar, reducing the effectiveness of the mean-reversion strategy.
Final Thoughts
The Volume Momentum indicator offers a comprehensive approach to analyzing volume-based momentum shifts in the market. By using volume normalization, percentile interpolation, and smoothed moving averages, this system helps identify the strength and direction of market trends. Whether used for trend-following or adapted for mean-reversion, this tool provides traders with actionable insights into the market’s volume-driven movements, improving decision-making and portfolio management.

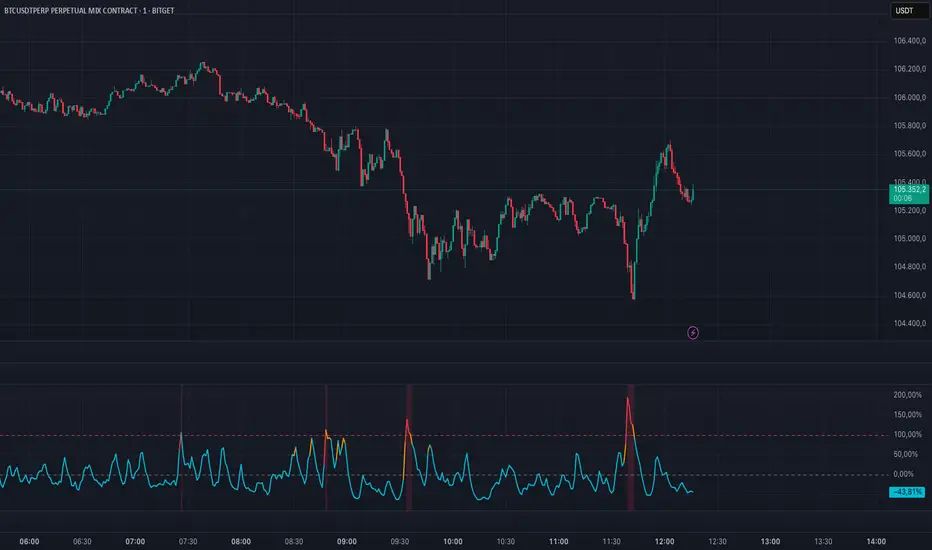
Volume Oscillator Pro – Spike Visualizer{NJ}📊 **Volume Oscillator Pro – Spike Visualizer (NJ)**
An enhanced volume oscillator for scalpers, day traders, and momentum traders.
This indicator visually highlights significant volume surges to help identify real market strength.
---
🔍 **Features:**
– Dynamic color changes based on volume pressure
– Warning zone starts at 70% (orange), confirmed spike at 100% (red)
– Horizontal spike line at 100% for clear reference
– Optional background color for extreme volume breakouts
---
⚙️ **Recommended Use:**
– Use on **1–5 minute charts** for scalping and fast momentum entries
– Combine with **price structure or candle pattern setups**
– Spikes above 100% often indicate large player entries or exits
– Helps you distinguish real movement from market noise
---
🧪 **Suggested Settings:**
– Short Length: `5`
– Long Length: `10`
– Spike Threshold: fixed at 100% (can be adjusted)
---
Created by **Nasir Jebri**
Volume Stack US Top 40 [Pt]█ Overview
Volume Stack US Top 40 is a versatile TradingView indicator designed to give you an at-a-glance view of market sentiment and volume dynamics across the top 40 U.S. large-cap stocks. Inspired by the popular Saty Volume Stack, this enhanced version aggregates essential volume and price strength data from major tickers on both the NYSE and NASDAQ, and works seamlessly on all timeframes.
█ Key Features
Dynamic Buy / Sell Volume Stack: This indicator dynamically stacks the volume bars so that the side with higher volume appears on top. For example, green over red signals more buy-side volume, while red over green indicates greater sell-side volume.
Cross-Market Analysis: Easily toggle between NYSE and NASDAQ to analyze the most influential U.S. stocks. The indicator automatically loads the correct set of tickers based on your selection.
Flexible Coverage: Choose from Top 10, Top 20, Top 30, or Top 40 tickers to tailor the tool to your desired scope of analysis.
Dynamic Table Display: A neat on-chart table lists the selected ticker symbols along with visual cues that reflect each stock’s strength. You can even remove exchange prefixes for a cleaner look.
█ Inputs & Settings
Market Selector: Choose whether to view data from the NYSE or NASDAQ; the indicator automatically loads the corresponding list of top tickers.
Number of Tickers: Select from ‘Top 10’, ‘Top 20’, ‘Top 30’, or ‘Top 40’ stocks to define the breadth of your analysis.
Color Options: Customize the colors for bullish and bearish histogram bars to suit your personal style.
Table Preferences: Adjust the on-chart table’s display style (grid or one row), text size, and decide whether to show exchange information alongside ticker symbols.
█ Usage & Benefits
Volume Stack US Top 40 is ideal for traders and investors who need a clear yet powerful tool to gauge overall market strength. By combining volume and price action data across multiple major stocks, it helps you:
Quickly assess whether the market sentiment is bullish or bearish.
Confirm trends by comparing volume patterns against intraday price movements.
Enhance your trading decisions with a visual representation of market breadth and dynamic buy/sell volume stacking.
Its intuitive design means you spend less time adjusting complex settings and more time making confident, informed decisions.

Volume Spike DetectorVolume Spike Detector
This script is designed to identify significant spikes in trading volume and visually represent them on the chart. It calculates the 20-period simple moving average (SMA) of the trading volume and multiplies it by a user-defined threshold to determine the spike threshold. When the current volume exceeds this threshold, the script detects and highlights a volume spike.
Key Features:
Dynamic Spike Threshold:
The script calculates the spike threshold dynamically based on the average trading volume. Users can customize the threshold multiplier using an input setting.
Example: A threshold multiplier of 2.0 means the current volume must be twice the 20-period SMA to trigger a detection.
Visual Representation:
The current volume is plotted in blue bars.
The spike threshold is plotted as a red line, making it easy to visually identify when the volume crosses the threshold.
Alert Notification:
When a volume spike is detected, an alert is triggered to notify the user.
This feature is useful for real-time monitoring and spotting potential trading opportunities.
Use Case:
Traders can use this tool to identify sudden increases in trading activity, which may indicate a significant market move or event. It’s suitable for all markets, including cryptocurrencies, stocks, and forex.

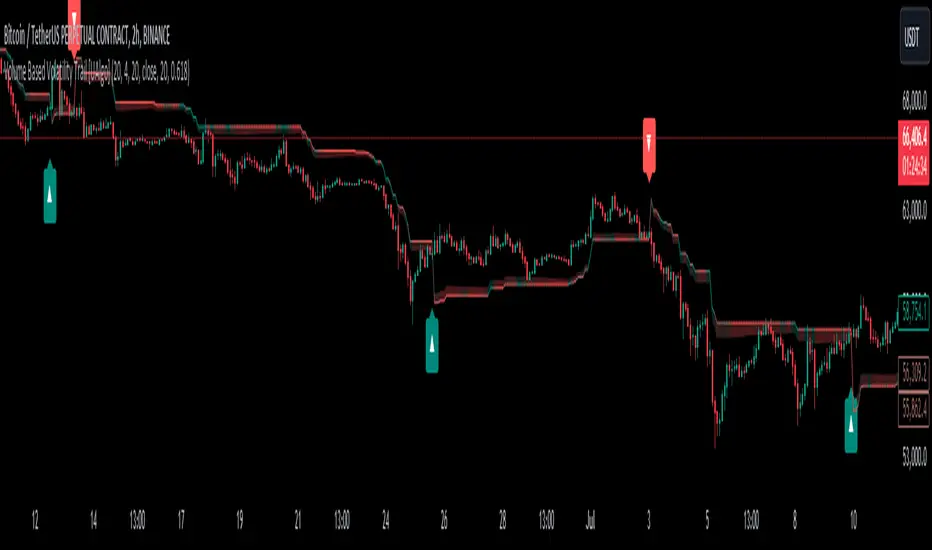
Volume Based Volatility Trail [UAlgo]"Volume Based Volatility Trail ", is designed to identify potential trading opportunities based on volatility and volume analysis. It calculates the Average True Range (ATR) to gauge market volatility and uses a volume-based multiplier to dynamically adjust a trailing stop level. The indicator also incorporates volume analysis to identify high volume periods that might signal potential breakouts.
🔶 Key Features
Volume-Based Volatility Trail: The indicator calculates a trailing stop level based on the ATR, which is then adjusted based on volume. Higher volume periods can lead to a wider trailing stop to account for increased volatility.
Price Source: Users can select the price source (e.g., close, open) for volume calculations.
Customizable Inputs: Users can adjust various parameters like the ATR period, multiplier, smoothing period, volume SMA period, ATR adjustment factor, and colors for buy/sell signals and the trailing stop area.
Buy/Sell Alerts: The indicator generates alerts for potential buy and sell opportunities based on the trailing stop crossing the price.
🔶 Usage
Look for buy signals (▲ marker) when the price crosses above the trailing stop level, potentially indicating a bullish trend.
Conversely, sell signals (▼ marker) appear when the price falls below the trailing stop, suggesting a bearish trend.
The shaded area around the trailing stop represents a buffer zone that might offer some protection against price fluctuations, but it can also indicate areas of potential pullbacks. During volatile periods or after strong price movements, the price might retrace back towards the trailing stop before continuing its trend. This shaded area can help visualize these potential retracement zones.
High volume periods (highlighted by the indicator) can be used in conjunction with other technical analysis to confirm potential breakouts. Analyze these high volume periods alongside price action and other indicators to assess the strength of the breakout and the likelihood of the price continuing its upward move.
🔶 Disclaimer:
Use with Caution: This indicator is provided for educational and informational purposes only and should not be considered as financial advice. Users should exercise caution and perform their own analysis before making trading decisions based on the indicator's signals.
Not Financial Advice: The information provided by this indicator does not constitute financial advice, and the creator (UAlgo) shall not be held responsible for any trading losses incurred as a result of using this indicator.
Backtesting Recommended: Traders are encouraged to backtest the indicator thoroughly on historical data before using it in live trading to assess its performance and suitability for their trading strategies.
Risk Management: Trading involves inherent risks, and users should implement proper risk management strategies, including but not limited to stop-loss orders and position sizing, to mitigate potential losses.
No Guarantees: The accuracy and reliability of the indicator's signals cannot be guaranteed, as they are based on historical price data and past performance may not be indicative of future results.
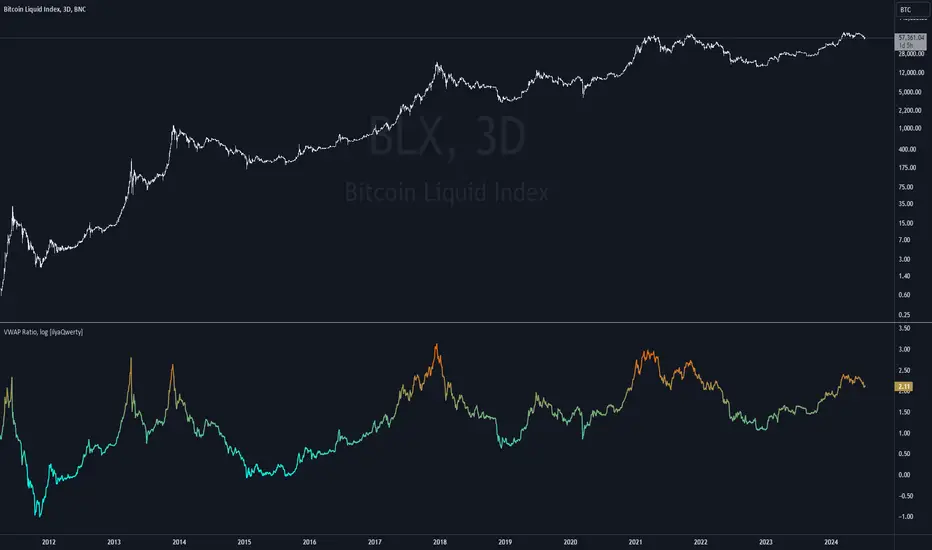
Volume Weighted Average Price Ratio (log) [ilyaQwerty]The VWAP Ratio indicator is a valuable tool for traders aiming to assess market trends and price movements in relation to the Volume Weighted Average Price (VWAP). Volume Weighted Average Price Ratio represents the ratio of the price of the asset compared to total traded volume in US Dollars. In a context of Bitcoin, VWAP ratio helps traders assess the market state, if it is overvalued or undervalued. High values of the indicator can suggest that the market is highly overvalued and low values can indicate a great buying opportunity.
Ratio Calculation: The VWAP Ratio is computed by dividing the current price by the VWAP (Price / VWAP). VWAP represents a ratio between a cumulative sum of a traded value (price multiplied by the volume) and a cumulative traded volume.
BTC-Specific Optimization: Although the indicator can be applied to various assets, the VWAP Ratio indicator is particularly useful for Bitcoin (BTC) due to its significant trading volume and unique market behaviour.
Volume Delta Candles [LuxAlgo]Volume Delta Candles provides insights about Intrabar trading activity in an easy-to-interpret manner. Lower timeframe or real-time data is used for displaying Volume Delta percentage against the total volume as a coloured bar part.
The script also highlights the intrabar price with the maximum trading activity, as well as complementary information.
🔶 USAGE
The tool focuses on intrabar volume to provide more information about the trading activity associated with a candle, without having to use an external volume indicator.
Each indicator components is further explained below:
🔹 Volume Delta
The volume delta is obtained by the difference between buy volume and sell volume, where buy volume is the volume associated with a bullish intrabar candle, and sell volume with a bearish intrabar candle.
Positive volume delta is displayed with a green candle area, while negative delta is displayed with a red candle area.
🔹 Bar Coloring
The script displays VD as a percentage of the whole, or from the candle half, depending on the setting ' Display '.
Bars can be coloured as follows:
Full (100%) when Display is set at ' Full Bar '
Half (50% or 100% of half a bar) when Display is set at ' Half Bar '
A negative VD (more bearish than bullish volume) will fill the bar from the top (or centre) of the bar towards the bottom, and a positive VD will fill a bar from the bottom (or centre) of the bar towards the top.
A negative VD on a green candle will show a red-coloured VD against a green-bordered candle. On the other hand, a positive VD on a red candle will show a green-coloured VD against a red-bordered candle.
Colours for VD sentiment opposite to the candle sentiment can be set differently if desired.
🔹 Highest Volume Price Level
The script displays a white (black on light mode) line highlighting the intrabar price level with the highest volume.
When ' Show Previous Max Volume Price ' is checked, a white (black on light mode) dot is displayed 1 bar to the right.
🔶 DETAILS
🔹 Tick/LTF data
The above example used Lower TimeFrame (LTF) data.
The following example uses real-time tick data ( Settings -> Data From )
Both options, LTF or tick data, will show a vertical dotted line where the data starts.
🔹 LTF settings
When ' Data from ' LTF is chosen and ' Auto ' enabled, the LTF will be the nearest possible x times smaller TF than the current TF. When 'Premium' is disabled, the minimum TF will always be 1 minute to ensure TradingView plans lower than Premium don't get an error.
Examples with current Daily TF (when Premium is enabled):
500 : 3 minute LTF
1500 (default): 1 minute LTF
5000: 30 seconds LTF (1 minute if Premium is disabled)
🔹 Notes
Different LTFs give different data, which means different results; this doesn't mean it isn't correct; they are just different data sets.
(LTF is displayed at the top right corner)
To ensure maximum visibility of values, we recommend using Bars from the Bar's style menu.
🔶 SETTINGS
Data from: Lower TimeFrame or real-time Tick data
Resolution: LTF setting
Auto + multiple: Adjusts the initial set resolution
Premium: Enable when your TradingView plan is Premium or higher
🔹 Intrabar Data
Colours
Display: Full/Half bar
Show previous max volume price: White/black dot, showing previous highest volume price level
🔹 Table
Show TF: Show LTF at the top right corner
Colour + table text size
🔹 Details
Show details: label with 'Volume', 'Delta' (VD) and '%'
See USAGE for more information

Volume change > 50% alert color coded GAAAPThis indicator, titled "Volume Change Alert," is designed to visually represent and alert traders to significant changes in trading volume on any given asset within the TradingView platform. The core functionality of the indicator revolves around detecting and highlighting instances where the volume of trades has experienced a notable increase compared to the previous trading period.
Key Features:
Percentage-Based Volume Change Detection: The indicator calculates the percentage change in trading volume from one bar to the next. This allows for a dynamic analysis of volume fluctuations that can be indicative of significant market events.
Threshold-Based Alerts: It employs a tiered alert system based on predefined volume increase thresholds:
Light Blue Highlight: When the volume increase is between 50% and 100%, the indicator marks the bar in light blue, signaling a moderate but noteworthy increase in trading activity.
Purple Highlight: An increase of more than 100% but less than 500% is highlighted in purple, indicating a substantial rise in volume that could be the result of significant market developments.
Black Highlight: For extraordinary situations where the volume increase exceeds 500%, the bar is highlighted in black, underscoring a dramatic surge in trading activity that could suggest major market moves.
Customizable Alerts: Traders can set up alerts based on these volume changes, allowing them to be notified in real-time when such conditions are met. This feature is invaluable for those looking to capitalize on volume-driven market opportunities or to monitor unusual market activity.
Visual and Textual Annotations: The indicator not only changes the color of the bars based on the volume increase but also attaches labels to these bars, providing the exact percentage increase in volume. This dual representation ensures that traders can quickly quantify the volume change at a glance.
Use Cases:
Identifying Breakouts: Sudden increases in volume can often precede or accompany price breakouts. Traders can use this indicator to spot potential breakouts as they are happening or to confirm the strength of a breakout based on the accompanying volume change.
Spotting Reversals: Significant changes in volume can also signal potential market reversals. A dramatic increase in volume might indicate the culmination of a trend and the potential start of a new one in the opposite direction.
Enhancing Trading Strategies: The indicator can be integrated into existing trading strategies to add a volume-based dimension to trading decisions, providing a more holistic view of market movements.

Volume Oscillators Focus IndicatorVolume Oscillators Focus Indicator
Short name VolumeFocus
This indicator seeks to show episodes of high and low volumes analyzing these by calculating three lines and create colorings on the basis of where these lines go relative to each other.
The first line is a percent based on the current volume level, for which a 3 period sma is taken.
It is calculated by using the lowest volume in the lookback as zero, the highest as 100 percent
This line is called “current volume level”
The second line is a percent, based on the median volume of the last five periods. This line is called “new normal volume”
The third line is a percent, based on the median volume of the lookback period. This is called “old normal volume”
For the second and third line the lowest “new normal volume” in the lookback is used as zero while the 100 percent level is the same as in the calculation of the first line.
The reasoning for the colors is as follows:
When both current en new normal level are below old normal, the volume is to be considered ‘low’. When volume is low, the background color is gray and the fill color between the old normal and current lines is navy.
When both current and new normal level are above old normal, the volume is to be considered ‘significantly expanded’. When this happens the fill color between current and old normal is orange.
When volume is not low it is considered normal or high and the background color is green.
The lookback is set to 50, it advise to keep it that way.
Use of the indicator.
Volume results from focus of the market on the instrument. When the price seems correct, some buy it, some sell it but most don’t care. Then the volume is low, the background is gray. The navy fill color indicates ‘how low’.
When the price seems off, many will care and start trading. Then volume is high, background is green. When the trading is really heating up the orange fill color appears, showing that the market has high focus on this instrument, perhaps move in a trend.
Of course we don’t know in which way the market tries to ‘correct’ the price, for that purpose I use this indicator together with REVE Cohorts which provide useful markers to explain what the excess volume means.
Eykpunter

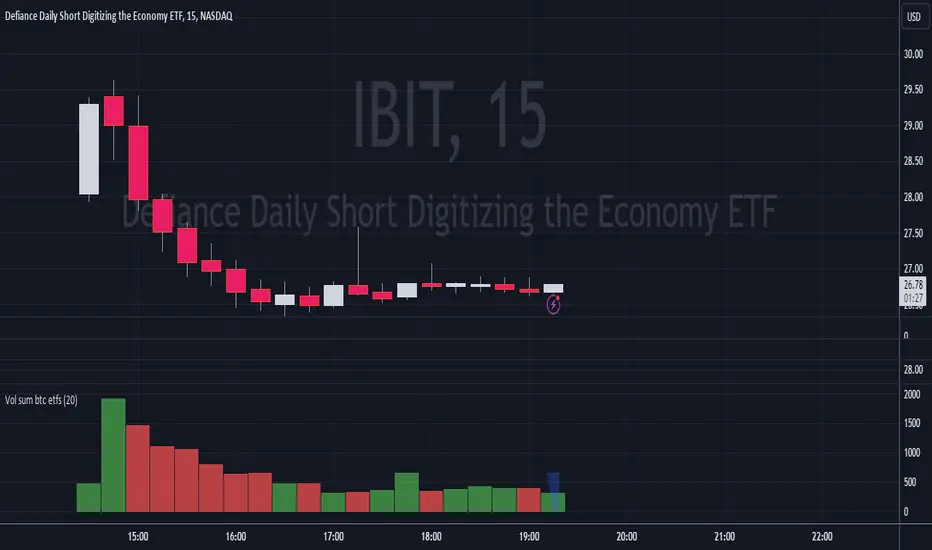
Volume Sum BTC ETFsThis volume indicator tracks the volume of these 10 bitcoin ETFS:
AMEX:GBTC, NASDAQ:IBIT, AMEX:BTCO, AMEX:ARKB, AMEX:HODL, AMEX:EZBC, NASDAQ:BRRR, AMEX:BTCW, AMEX:DEFI, AMEX:BITB
It multiplies the traded shares with the hl2 share price and then devides the volume by the bitcoin hl2 price.
You can change to usd volume in settings.
Enjoy!
Notice that historical volume comes from etfs which traded already before launch like GBTC.
Also notice that that btc trades also when tradfi markets are closed, so then the indicator will show the last available volume. Something to fix later.