Volume Predictor [PhenLabs]📊 Volume Predictor
Version: PineScript™ v6
📌 Description
The Volume Predictor is an advanced technical indicator that leverages machine learning and statistical modeling techniques to forecast future trading volume. This innovative tool analyzes historical volume patterns to predict volume levels for upcoming bars, providing traders with valuable insights into potential market activity. By combining multiple prediction algorithms with pattern recognition techniques, the indicator delivers forward-looking volume projections that can enhance trading strategies and market analysis.
🚀 Points of Innovation:
Machine learning pattern recognition using Lorentzian distance metrics
Multi-algorithm prediction framework with algorithm selection
Ensemble learning approach combining multiple prediction methods
Real-time accuracy metrics with visual performance dashboard
Dynamic volume normalization for consistent scale representation
Forward-looking visualization with configurable prediction horizon
🔧 Core Components
Pattern Recognition Engine : Identifies similar historical volume patterns using Lorentzian distance metrics
Multi-Algorithm Framework : Offers five distinct prediction methods with configurable parameters
Volume Normalization : Converts raw volume to percentage scale for consistent analysis
Accuracy Tracking : Continuously evaluates prediction performance against actual outcomes
Advanced Visualization : Displays actual vs. predicted volume with configurable future bar projections
Interactive Dashboard : Shows real-time performance metrics and prediction accuracy
🔥 Key Features
The indicator provides comprehensive volume analysis through:
Multiple Prediction Methods : Choose from Lorentzian, KNN Pattern, Ensemble, EMA, or Linear Regression algorithms
Pattern Matching : Identifies similar historical volume patterns to project future volume
Adaptive Predictions : Generates volume forecasts for multiple bars into the future
Performance Tracking : Calculates and displays real-time prediction accuracy metrics
Normalized Scale : Presents volume as a percentage of historical maximums for consistent analysis
Customizable Visualization : Configure how predictions and actual volumes are displayed
Interactive Dashboard : View algorithm performance metrics in a customizable information panel
🎨 Visualization
Actual Volume Columns : Color-coded green/red bars showing current normalized volume
Prediction Columns : Semi-transparent blue columns representing predicted volume levels
Future Bar Projections : Forward-looking volume predictions with configurable transparency
Prediction Dots : Optional white dots highlighting future prediction points
Reference Lines : Visual guides showing the normalized volume scale
Performance Dashboard : Customizable panel displaying prediction method and accuracy metrics
📖 Usage Guidelines
History Lookback Period
Default: 20
Range: 5-100
This setting determines how many historical bars are analyzed for pattern matching. A longer period provides more historical data for pattern recognition but may reduce responsiveness to recent changes. A shorter period emphasizes recent market behavior but might miss longer-term patterns.
🧠 Prediction Method
Algorithm
Default: Lorentzian
Options: Lorentzian, KNN Pattern, Ensemble, EMA, Linear Regression
Selects the algorithm used for volume prediction:
Lorentzian: Uses Lorentzian distance metrics for pattern recognition, offering excellent noise resistance
KNN Pattern: Traditional K-Nearest Neighbors approach for historical pattern matching
Ensemble: Combines multiple methods with weighted averaging for robust predictions
EMA: Simple exponential moving average projection for trend-following predictions
Linear Regression: Projects future values based on linear trend analysis
Pattern Length
Default: 5
Range: 3-10
Defines the number of bars in each pattern for machine learning methods. Shorter patterns increase sensitivity to recent changes, while longer patterns may identify more complex structures but require more historical data.
Neighbors Count
Default: 3
Range: 1-5
Sets the K value (number of nearest neighbors) used in KNN and Lorentzian methods. Higher values produce smoother predictions by averaging more historical patterns, while lower values may capture more specific patterns but could be more susceptible to noise.
Prediction Horizon
Default: 5
Range: 1-10
Determines how many future bars to predict. Longer horizons provide more forward-looking information but typically decrease accuracy as the prediction window extends.
📊 Display Settings
Display Mode
Default: Overlay
Options: Overlay, Prediction Only
Controls how volume information is displayed:
Overlay: Shows both actual volume and predictions on the same chart
Prediction Only: Displays only the predictions without actual volume
Show Prediction Dots
Default: false
When enabled, adds white dots to future predictions for improved visibility and clarity.
Future Bar Transparency (%)
Default: 70
Range: 0-90
Controls the transparency of future prediction bars. Higher values make future bars more transparent, while lower values make them more visible.
📱 Dashboard Settings
Show Dashboard
Default: true
Toggles display of the prediction accuracy dashboard. When enabled, shows real-time accuracy metrics.
Dashboard Location
Default: Bottom Right
Options: Top Left, Top Right, Bottom Left, Bottom Right
Determines where the dashboard appears on the chart.
Dashboard Text Size
Default: Normal
Options: Small, Normal, Large
Controls the size of text in the dashboard for various display sizes.
Dashboard Style
Default: Solid
Options: Solid, Transparent
Sets the visual style of the dashboard background.
Understanding Accuracy Metrics
The dashboard provides key performance metrics to evaluate prediction quality:
Average Error
Shows the average difference between predicted and actual values
Positive values indicate the prediction tends to be higher than actual volume
Negative values indicate the prediction tends to be lower than actual volume
Values closer to zero indicate better prediction accuracy
Accuracy Percentage
A measure of how close predictions are to actual outcomes
Higher percentages (>70%) indicate excellent prediction quality
Moderate percentages (50-70%) indicate acceptable predictions
Lower percentages (<50%) suggest weaker prediction reliability
The accuracy metrics are color-coded for quick assessment:
Green: Strong prediction performance
Orange: Moderate prediction performance
Red: Weaker prediction performance
✅ Best Use Cases
Anticipate upcoming volume spikes or drops
Identify potential volume divergences from price action
Plan entries and exits around expected volume changes
Filter trading signals based on predicted volume support
Optimize position sizing by forecasting market participation
Prepare for potential volatility changes signaled by volume predictions
Enhance technical pattern analysis with volume projection context
⚠️ Limitations
Volume predictions become less accurate over longer time horizons
Performance varies based on market conditions and asset characteristics
Works best on liquid assets with consistent volume patterns
Requires sufficient historical data for pattern recognition
Sudden market events can disrupt prediction accuracy
Volume spikes may be muted in predictions due to normalization
💡 What Makes This Unique
Machine Learning Approach : Applies Lorentzian distance metrics for robust pattern matching
Algorithm Selection : Offers multiple prediction methods to suit different market conditions
Real-time Accuracy Tracking : Provides continuous feedback on prediction performance
Forward Projection : Visualizes multiple future bars with configurable display options
Normalized Scale : Presents volume as a percentage of maximum volume for consistent analysis
Interactive Dashboard : Displays key metrics with customizable appearance and placement
🔬 How It Works
The Volume Predictor processes market data through five main steps:
1. Volume Normalization:
Converts raw volume to percentage of maximum volume in lookback period
Creates consistent scale representation across different timeframes and assets
Stores historical normalized volumes for pattern analysis
2. Pattern Detection:
Identifies similar volume patterns in historical data
Uses Lorentzian distance metrics for robust similarity measurement
Determines strength of pattern match for prediction weighting
3. Algorithm Processing:
Applies selected prediction algorithm to historical patterns
For KNN/Lorentzian: Finds K nearest neighbors and calculates weighted prediction
For Ensemble: Combines multiple methods with optimized weighting
For EMA/Linear Regression: Projects trends based on statistical models
4. Accuracy Calculation:
Compares previous predictions to actual outcomes
Calculates average error and prediction accuracy
Updates performance metrics in real-time
5. Visualization:
Displays normalized actual volume with color-coding
Shows current and future volume predictions
Presents performance metrics through interactive dashboard
💡 Note:
The Volume Predictor performs optimally on liquid assets with established volume patterns. It’s most effective when used in conjunction with price action analysis and other technical indicators. The multi-algorithm approach allows adaptation to different market conditions by switching prediction methods. Pay special attention to the accuracy metrics when evaluating prediction reliability, as sudden market changes can temporarily reduce prediction quality. The normalized percentage scale makes the indicator consistent across different assets and timeframes, providing a standardized approach to volume analysis.
Komut dosyalarını "volume" için ara

Volume to Shares Outstanding Ratio IndicatorDescription:
This indicator shows the ratio of trading volume to the total number of shares outstanding.
Formula:
Volume to Shares Outstanding Ratio = (Trading Volume / Shares Outstanding) * 100
説明:
このインジケーターは、出来高を発行済株式数で割った比率を表示します。
式:
出来高の割合 = (出来高 / 発行済株式数) × 100

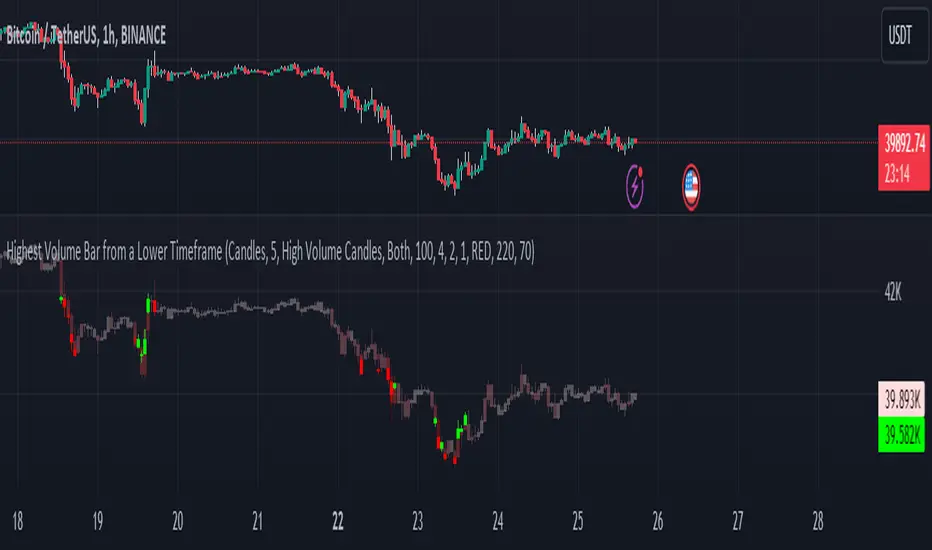
Highest Volume Bar from a Lower TimeframeVolume is an essential indicator in technical analysis as it can signal confirmations of movement, reversals, and more. This indicator was developed to identify candles with high volume in both the current timeframe and a lower timeframe
SETTINGS
The indicator has two display modes: Candles and Volume.
- Candles: it presents a traditional candlestick chart that shows the candles of the current timeframe, along with the candle with the highest volume from the lower timeframe.
- Volume: it features a volume chart displaying the volume of the current timeframe in histogram form, as well as the bar with the highest volume from the lower timeframe represented in columns.
LOWER TIME FRAME SETTINGS
- Lower Time Frame: the lower timeframe to be taken into consideration.
- LTF Candle Display: determines which candles from the current timeframe chart will display the candles with the highest volume from the lower timeframe.
- Volume Display: determines how the volume bars will be presented for both the current timeframe and the lower timeframe.
VOLUME LEVEL SETTINGS
- SMA Period: the time period for calculating the volume average.
- High Volume: the multiplier used to classify a candle as having high volume.
- Medium Volume: the multiplier used to classify a candle as having medium volume.
- Low Volume: the multiplier used to classify a candle as having low volume.
- Show Volume MA: enable this option to display the Volume MA on the chart.
COLOR SETTINGS
- Candle Color: the color to be used in the charts.
- Shade Intensity : the intensity of the shades for volume levels.
- Transparency : the transparency to be used for the candles of the current timeframe when displaying candles with higher volume from the lower timeframe.
Volume Candle DistributionThe Volume Candle Distribution (VCD) indicator examines the volume distribution across candle type, distinguishes between neutral, bullish and bearish volume pressures.
The VCD indicator calculates and displays the cumulative volume of bullish and bearish candles over a user-defined period, aggregates the volumes of bullish and bearish candles separately and plots them.
Bullish Volume : This is accumulated when the closing price of a candle is higher than the opening price, the VCD adds up the volume of bullish candle within the user-defined period, and consequently subtracts the volume when bearish candle.
Bearish Volume : Conversely, when the closing price is lower than the opening price, the volume of that candle is considered bearish, the VCD sums the volume of bearish candles over the same period, and consequently subtracts the volume when bullish candle.
Neutral Volume : In cases where the opening and closing prices are equal, the volume of that candle is treated as neutral, and the VCD subtracts the volume from both candles.
The 3 Simple Moving Average (SMAs) included is based volume calculated separately for both bullish and bearish volume data, and the sum of them.

Volume Profile PlusThis indicator provides a high-resolution and high-precision implementation of Volume Profile with flexible range settings. Its key features include:
1. Support for a high resolution of up to 2,500 rows.
2. Capability to examine lower timeframe bars (default 5,000 intra-bars) for enhanced precision.
3. Three range modes — "Visible Range", "Anchored Range", and "All Range".
4. Highlighting of Point of Control and Value Area.
5. Extensive customization options allowing users to configure dimensions, on-chart placements, and color schemes.
🔵 Settings
The settings screen, along with the explanations for each setting, is provided below:
🔵 High Resolution using Polyline
Inspired by @fikira, this indicator utilizes the newly introduced `polyline` type in PineScript to plot the volume profile. It employs a single polyline instance to represent the entire histogram. With each polyline instance supporting up to 10,000 points and each histogram row requiring 4 points, this indicator can accommodate 2500 rows, resulting in a significantly higher resolution compared to conventional volume profile indicators that use `line`s or `box`es to draw the histogram.
🔵 High Precision Data-binning using Lower Timeframe Data
Conventional volume profile indicators often face one or both of the following limitations:
1. They only consider volume within the chart's current timeframe.
2. They assign each bar's total volume to a single price bucket based on the bar's average price, rather than distributing volume across multiple price buckets.
As a result, when the number of bars in the chart is low, those indicators may provide imprecise results, making it difficult to accurately identify significant volume nodes and the point of control.
To address these limitations and enhance accuracy, this indicator examines data from lower timeframes and distributes the volume to fine-grained price buckets. It intelligently selects an appropriate lower timeframe to ensure precise output while complying with a maximum specified number of bars to maintain good performance.
🔵 Three Range Modes
This indicator offers users the flexibility to choose from three range modes:
1. Visible Range (Default Mode): In this mode, the volume profile calculation begins at the time of the left-most bar displayed in the current viewport. As the user scrolls through the viewport, the volume profile updates automatically.
2. Anchored Range: This mode allows the user to set the start time either by using the datetime input boxes or by dragging the anchor line on the chart.
3. All Range: In this mode, the volume profile calculation is based on all the historical bars available in the chart.

Volume Spread AnalyzerThis indicator is unseen on Tradingview and wants to be the number 1 indicator for the volume spread analysis. Its formula, as simple as useful, compares the effort (volume) of the candle with the results, or the price movement.
This way it's possible to apply the famous Volume Spread Analysis with a simple and complete indicator that's 100% objective.
This indicator can be used on almost any market, but it gives the best results on markets which has constant and high volume, like forex markets, for example.
There are 4 different modes that you can choose from, and all of the use different approaches and techniques to measure the same concept: the efficiency of the price compared to the effort of buyers and sellers:
1. The first one analyzes the formula for ONLY buy candles and ONLY for sell candles, and then plots the column oscillator to show the difference.
2. The second function shows the same formula but applied to any candle, and then confronts the two lines generated by the effort of the positive candle and the negative one as an area. You also have a single-step line on the chart that shows the real-time single-candle effort to result from efficiency.
3. Comparison between the single candle effort and the average efficiency, useful to filter out bad entry candles that could lead to a stop loss.
4. Absorbion analyzer: with this option, you can choose between the single candle and multi-candle mode.
4.1: Single candle mode display, as a pink circle on the oscillator, the candles that are more likely an absorption.
4.2: Multi-candle mode display the summation of the single candle value, to analyze the entire movement and identify the part of the trend that can be absorbed when compared to the other.
For almost any function o the indicator, the fast line input changes the fast line that you see on the chart (i suggest not increasing it above 3 for optimal results), and the slow line changes the moving average or the area that shows the difference between the other lines, you can set the slow line to 1 to have as a result the simple difference of the other lines, or you can set it to a higher value like 50 to show the middle or long term bias.

Volume with forceThis indicator shows the classic stock volume chart with a plottable 20 periods SMA line. Along with this, it shows to the top right of the pane a percent, showing the current "volume force".
This force is calculated as the SMA of the last 3 volume candles excluded the current candle (only counts finished candles) and then compare it with the standard 20 periods volume SMA.
Some examples for a better understanding:
A value of 200% means that the SMA of last 3 candles is equals to 2 times of the 20 periods volume SMA
A value of 100% means that the SMA of last 3 candles is equals to the 20 periods volume SMA
A value of 50% means that the SMA of last 3 candles is equals to 1/2 of the 20 periods volume SMA
A value of 25% means that the SMA of last 3 candles is equals to 1/4 of the 20 periods volume SMA
If the value is above 100%, the background will be green, red otherwise. A green value means that the symbol is having a nice volume income.
Customizable settings
Timeframe: the main TF to plot volume and calculate force
MA Length: the length of the standard volume SMA to plot (and to compare for the force calculation)
Diff force length: the length of the last candles (excluded the current candle) to compare with the standard volume SMA
Show moving average: if checked, plots the standard SMA
Show volume force: if checked, shows to the top right the volume force

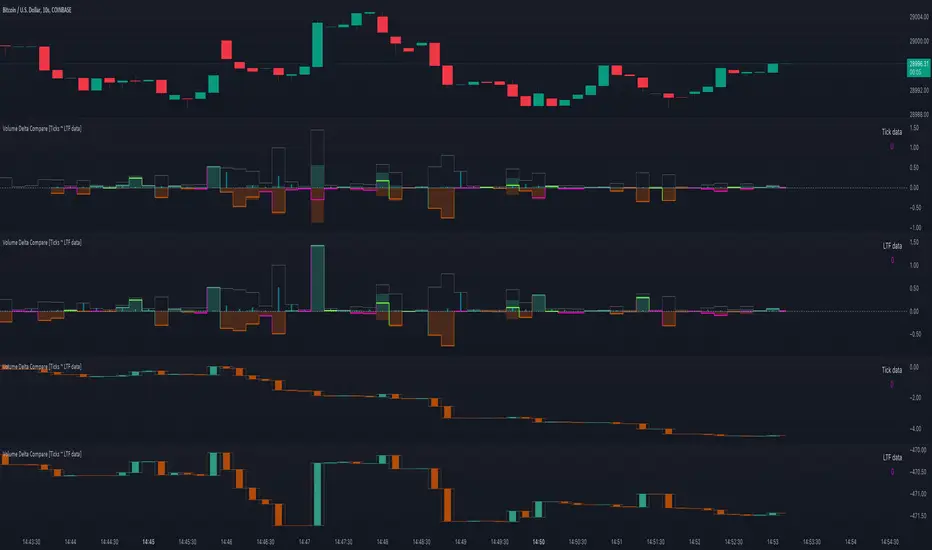
Volume Delta Compare [Ticks ~ LTF data]
The "Volume Delta Compare " publication shows 2 different techniques to show into-depth details of Volume, using Tick and Lower-Time-Frame (LTF) data.
🔶 USAGE
Check for divergences between price and volume movement
Check details (why and when a ΔV developed)
Or if you want to see a lot of data stacked on each other )
🔶 CONCEPTS
🔹 Tick vs. LTF data
a Tick is an measure of (upward or downward) movement in price OR volume.
We can use this data by using varip in the code.
Advantage:
• Detail, detail, detail
• Accurate, per tick
Disadvantage:
• Only realtime
• Can reset 'easily' -> loss of data
• Will reset when settings are changed
LTF data, through the request.security_lower_tf() function, measures the OHLCV data per LTF bar
Advantage:
• Access to history when loading a chart
• No 'loss' of data when chart resets
Disadvantage:
• Less detailed
• Less accurate
This script makes it possible to compare the 2 techniques and enables you to show different values.
🔹 Values
There are mainly 3 important values:
• UP volume (uV): volume when price rises
• DOWN volume (dV): volume when price falls
• NEUTRAL volume (nV): volume when price stays the same
From this, additional data is calculated:
• Volume Delta (ΔV): uV minus dV
• Cumulative Delta Volume (cΔV): sum of ΔV
One typical nV is at open: at that moment there isn't a base price to compare with,
so when the first trade doesn't fully fill the first supply (up or down), volume will rise, but price just is 'open', no movement -> no uV or dV.
• Tick data: every volume changement per tick will be added to the concerning variable (uV, dV or nV)
• LTF data: every volume changement of each bar will be added to the concerning variable (uV, dV or nV)
-> this can easily give a difference, for example (Tick vs. 1 minute LTF), when most of the ticks caused a rise of price, but at the last few seconds, a few ticks causes the close to come below open, with Tick data this could give more UP Volume, while LTF data will show 1 value of DOWN Volume.
🔶 EXAMPLES
🔹 Details
In these examples you can see:
• grey line: Total volume (higher precision)
• UP/DOWN/NEUTRAL Volume
• green columns: uV
• orange columns: dV
• blue pillars: nV
• coloured stepline: reflects ΔV
• close > open and positive ΔV -> green
• close > open but negative ΔV -> fuchsia
• close < open and negative ΔV -> orange
• close < open but positive ΔV -> bright lime green
• Right side -> indication of used data (Tick/LTF data) + last ΔV
• labels (can be disabled)
Above 0 (only with Tick data): data from EVERY tick (ΔV ):
• first the amount of Volume (0 when the amount is very minimal)
• between brackets: price movement
Below 0:
• Σ V: sum of uV, dV and nV, for that bar
• Σ up: sum of uV for that bar
• Σ dn: sum of dV for that bar
• Σ nt: sum of nV for that bar
• Σ P: sum of price movement, for that bar (only at Tick data)
(At the right you'll see a new bar just started)
Here is a detail of the first second at opening:
🔹 Cumulative Volume Delta (CVD)
Difference CVD based on Tick vs. LTF data :
(horizontal lines added for reference)
🔶 FEATURES
🔹 Minimal plotting of na values
Data window and status line only show what is applicable (tick or LTF data) to diminish clutter of data values:
The Tick option has a label above 0 which includes details of every Tick.
If data is added every tick, that label on a 10 minute chart will be filled beyond limitations pretty quickly (string max_length = 4096 limit).
To prevent the script stopping to execute, at a certain limit, this label will stop updating and show the message "Too much data".
The label below the 0-line won't reach that limit, so it will keep on updating.
Timeframes closer to 1 second will have less risk to reach that 4096 limit. Details will remain to show in this case.
🔹 Automatic label colour adaption when changing between dark/light mode values
Label background/text-colour will adapt according to the dark/light-mode by using chart.fg_color / chart.bg_color
🔶 SETTINGS
🔹 Data from: Ticks vs. LTF data
🔹 LTF: Lower Time-Frame for when LTF option is chosen: 1, 5, 10, 15, 30 Seconds or 1 minute
🔹 Also start when bar already has data: only for tick data -> when disabled calculations only start on a new bar.
🔹 CVD, Only show Cumulative Delta Volume: enable to just display CVD
🔹 Colours: colour at the right is for price/volume direction divergences
🔹 Label: choose what you want to display + size labels
🔹 0-line: The label under the 0-line sometimes goes below the chart. this can be adjusted with this setting.
Volume Delta Methods (Chart) [LuxAlgo]The Volume Delta Methods (Chart) aims at highlighting the relationship between Buying or Selling Pressure and Price by presenting Volume Delta , and multiple derivatives of volume delta such as Cumulative Volume Delta (CVD) , Buy/Sell Volume , Total Volume , etc on top of the Main Price Chart .
The script uses two different intrabar (chart bars at a lower timeframe than the chart's) analyses to achieve the most approximate calculation of the volume delta and offers fully customizable visualization features using various types of charts such as line, area, baseline, candles, and histograms.
The script allows traders to see "within" the price bar, provides more transparency over a traditional volume histogram, and also allows users to monitor price and volume activity together.
🔶 USAGE
Volume delta is the difference between the buying volume and the selling volume, in other words, it is the net demand at a given bar allowing traders a more detailed insight when analyzing the market sentiment. A volume delta greater than 0 indicates more buying than selling pressure, whereas a volume delta less than 0 indicates more selling than buying pressure.
Volume delta plus total volume (regular volume) adds additional insight, where the total volume represents all the recorded trades for security that occurs in a given time interval. It is a measurement of the participation, enthusiasm, and interest in a given security.
Divergences occur when the polarity of the volume delta does not match the polarity of the price bar.
The users can enable the display of the numerical values of the volume delta.
Cumulative Volume Delta (CVD) is a way of using Volume Delta to measure an asset’s mid-to-long-term buy and sell pressure. It compares buying and selling volume over time and offers insights into market behavior at specific price points. Cumulative Volume Delta is effectively a continuation of the principles of Volume Delta but involves longer time periods and offers different trading signals.
Like the Volume Delta, the Cumulative Volume Delta (CVD) indicator measures the relationship between buy and sell pressure but does not focus on one specific candle in particular. Rather, the Cumulative Volume Delta takes the relative differences and combines them all over an extended time period.
Users have the ability Cumulative Volume Delta in various types of charts along with an optional smoothing line.
Placed above price bars options.
Interacting with price bar options helps to better identify CVD Divergences.
CVD Divergences
CVD reveals buying and selling trends that may or may not complement the price trend of the asset itself. Sometimes, price trends can run in contrast to trading behavior — sell volume can be dominant while the spot price is rising, and vice versa.
🔶 DETAILS
Theoretically, volume delta is calculated by taking the difference between the volume that traded at the ask price and the volume that traded at the bid price. The most precise calculation method uses tick data but requires huge amounts of data on historical bars, which usually limits the historical depth of charts. This indicator uses two different intrabar analysis methods for the volume delta calculation, where intrabars are chart bars at a lower timeframe than the chart's timeframe:
The logic used to assign intrabar volume to the "up" or "down".
- Buying/Selling pressure of the intrabar option (default)
(close - low) > (high - close) => UP
(close - low) < (high - close) => DOWN
(close - low) = (high - close) => close - previous close is used
- Polarity of the intrabar option
close > open => UP
close < open => DOWN
close = open => close - previous close is used
🔶 SETTINGS
The script takes into account user-defined parameters and performs calculations and presentations based on them, where detailed usage for each user-defined input parameter in indicator settings is provided with the related input's tooltip.
🔹 Calculation Settings
Calculation Method: Calculation method selection, available options 'Intrabar Buying/Selling Pressure' or 'Intrabar Polarity'.
Lower Timeframe Precision: Sets indicator precision, default option is 'Auto'.
🔹 Presentation Settings
Volume Delta: Toggles the visibility of the Volume Delta
Cumulative Volume Delta: Toggles the visibility of the Cumulative Volume Delta
Volume Delta/Price Bar Divergences: Toggles the visibility of the Volume Delta Divergences
Volume Delta Numerical Values: Toggles the visibility of the Volume Delta Numerical Values
🔹 Other Features
Volume MA: Toggles the visibility of the Volume Moving Average
CVD Smoothing: Toggles the visibility of the Cumulative Volume Delta's Smoothing Line
🔹 Volume Delta, Others
Volume Delta: Positive, Negative: Volume Delta color customization options
Volume Histogram: Growing, Falling: Volume Histogram color customization options
Display Length: Length of the visual objects presented with this indicator
Volume Delta Height: Volume delta height customization options
Volume Histogram Height: Volume histogram height customization options
Vertical Offset: Volume delta and histogram vertical positioning customization options
🔹 Cumulative Volume Delta, Others
CVD Line, Width, and Color: Cumulative Volume Delta - Line Width and Color customization options
CVD Area/Baseline, Gradient Coloring: Cumulative Volume Delta - Area and Baseline background gradient coloring customization options
CVD Candles Color, Positive, and Negative: Cumulative Volume Delta - Candles coloring customization options
CVD/Smoothing Background: Highlights and adjusts the transparency of the area between the Cumulative Volume Delta Line and it's Smoothing Line
🔶 RELATED SCRIPTS
Liquidity-Sentiment-Profile
EquiVolume
Volume-Footprint

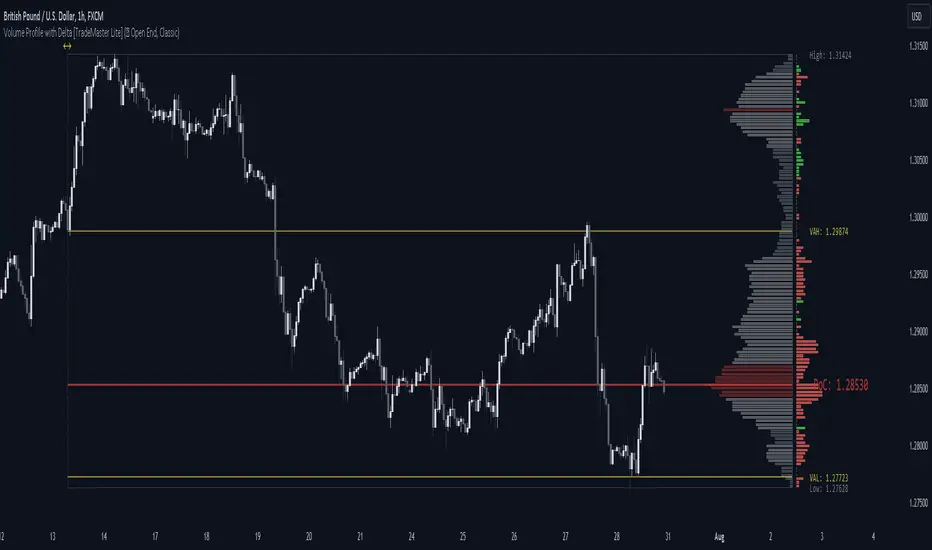
Volume Profile with Delta [TradeMaster Lite]The indicator estimates and displays the total traded volume and it's delta** at each price level during the user-defined period. It can be used to identify key support and resistance levels, determine logical take profit and stop loss levels, identify balanced and unbalanced markets and determine trend strength. The indicator offers different approaches to visualize the volume profile and can be chosen based on your preferred trading strategy and analysis method. The position and size of the Volume Profile is fully customizable, it can even be flipped if needed!
Three different display types (cosmetic effect only):
Classic
Compact
Modern
The Lite version offers three different range types:
Visible Range: displays the volume profile for the visible range of bars or candles on the chart. It adjusts dynamically as you change the chart view making it ideal for the modern trader who values both precision and simplicity.
Open End: displays the volume profile from a specific start date without a defined end, including real delta data. It provides an overview of the volume activity across all price levels of the examined period.
Fixed End: lets you define a specific start and end point for the volume profile. It can be useful if you want to analyze the volume activity within a specific time period or price range.
👉 Usage
The Volume Profile is a histogram that shows the estimated trading volume at certain price levels, how much was sold and how much was bought of the asset. The longer the histogram, the greater the trading volume at that price level. The Delta estimates which side was dominant at that price level and by how much.
To make the most out of the indicator, you can look for
pullbacks to high volume nodes or value areas,
initial equilibrium pullbacks,
buy or sell opportunities for price reversals,
institutional order flow.
The largest histogram node is called the Point of Control (POC). It is the estimated real market price of a coin. There's a common belief that when the price is above this point, the market sentiment is bullish, and when it's below, the sentiment turns bearish. It can act as a strong support if the price is above it and as strong resistance if the price is below it.
Price action usually finds the most support and resistance and the edge of the high volume areas. The indicator can mark these as VAH and VAL (Value Area High and Low).
In addition to the indication of support and resistance zones, the volume profile can also be used to infer the speed of price movements. At levels where there is little trading volume, faster and more volatile price movements are expected. In such scenarios the price may fall or rise faster to the next high volume zone.
👉 General advice
Confirming Signals with other indicators:
As with all technical indicators, it is important to confirm potential signals with other analytical tools, such as support and resistance levels, as well as indicators like RSI, MACD, and volume. This helps increase the probability of a successful trade.
Use proper risk management:
When using this or any other indicator, it is crucial to have proper risk management in place. Consider implementing stop-loss levels and thoughtful position sizing.
Combining with other technical indicators:
The indicator can be effectively used alongside other technical indicators to create a comprehensive trading strategy and provide additional confirmation.
Keep in Mind:
Thorough research and backtesting are essential before making any trading decisions. Furthermore, it's crucial to have a solid understanding of the indicator and its behavior. Additionally, incorporating fundamental analysis and considering market sentiment can be vital factors to take into account in your trading approach.
Limitations:
The Lite version shows simple delta with current timeframe volume data.
The indicators within the TradeMaster Lite package aim for simplicity and efficiency, while retaining their original purpose and value. Some settings, functions or visuals may be simpler than expected.
**The Delta estimates which side was dominant at that price level and by how much. It is the difference between bull and bear volume of the candle.
⭐ Conclusion
We hold the view that the true path to success is the synergy between the trader and the tool, contrary to the common belief that the tool itself is the sole determinant of profitability. The actual scenario is more nuanced than such an oversimplification. Our aim is to offer useful features that meet the needs of the 21st century and that we actually use.
🛑 Risk Notice:
Everything provided by trademasterindicator – from scripts, tools, and articles to educational materials – is intended solely for educational and informational purposes. Past performance does not assure future returns.
Volume Price and FundamentalsVolume Price and Fundamentals indicators contains 4 exponential moving averages based upon Fibonnaci numbers as period (8, 21, 55 & 144) with crossovers and crossunders.
It also contain a table for volume and 50 Day Avg. Volume, Relative volume, Change in Volume, Volume Value, Up-Down Closing Basis days in last 50 days, Volume ratio (U/D Ratio) on last 50-day Up / Down days and along with fundamental analysis table with various Fundamental Analysis parameters and QoQ & YoY comparison basis for better investment decision making.

Volumetric Tensegrity🧮 Volumetric Tensegrity unifies two of the Leading Indicator suite's critical engines — ZVOL ( volume anomaly detection ) and OBVX ( directional conviction ). Originally designed as a structural economizer for traders navigating strict indicator limits (e.g. < 10 slots per chart), it was forced to evolve beyond that constraint simply to fulfill it, albeit with a difference. The fatal flaw of traditional fusion, where two metrics are blended mathematically, is that they lose scale integrity (i.e. meaning). VTense encodes optical tensegrity to scale the amplitude of the ZVOL histogram and the slope of the OBVX spread independently, so that expansion and direction may coexist without either dominating the frame.
🧬 Tensegrity , by definition, is an intelligent design principle where elements in compression are suspended within a network of continuous tension, forming a stable, self-supporting structure . Originally conceived in esoteric biomorphology (c.f. Da Vinci, Snelson, Casteneda), tensegrity balances force through opposition, not rigidity. Applied to financial markets, Volumetric Tensegrity captures this same principle: price compresses, volume expands, conviction builds or fades — yet structure holds through the interplay. The result is not a prediction engine, but a pressure field — one that visualizes where structure might bend, break, or rebound based on how volume breathes.
🗜️ Rather than layering multiple indicators and consuming precious chart space, VTense frees up room for complementary overlays like momentum mapping, liquidity tiers, or volatility phase detection — making it ideal for modular traders operating in tight technical real estate.
🧠 Core Logic - VTense separates and preserves two essential structural forces:
• ZVOL Histogram : A Z-score-based expansion map that measures current volume deviation from its historical average. It reveals buildup zones, dormant stretches, and breakout pressure — regardless of price behavior.
• OBVX Spread : A directional conviction curve that tracks the difference between On-Balance Volume and its volume-weighted fast trend. It shows whether the crowd is leaning in (accumulation/distribution) or backing off.
🔊 ZVOL controls the amplitude of the histogram, while OBVX controls the curvature and slope of the spread. Without sacrificing breathing behavior or analytical depth, VTense provides a compact yet dynamic lens to track both expansion pressure and directional bias within a single footprint.
🌊 Volumetric Tensegrity forecasts breakout readiness, trend fatigue, and compression zones by measuring the volatility within volume . Unlike traditional tools that track volatility of price, this indicator reveals when effort becomes unstable — signaling inflection points before price reacts. Designed to decode rhythm shifts at the volume level, it operates as a pre-ignition scanner that thrives on low-timeframe charts (15m and under) while scaling effectively to 1H for validation.
🪖 From Generals to Scouts
👀 When used jointly, ZVOL + OBVX act as the general : deep-field analysts confirming stress, commitment, or exhaustion. VTense , by contrast, functions as a scout — capturing subtle buildup and alignment before structure fully reveals itself. The indicator aims to be a literal vanguard, establishing a position that can be confirmed or flexibly abandoned when the higher authority arrives to evaluate.
🥂 Use the ZVOL + OBVX pair when :
• You need independent axis control and manual dissection
• You’re building long-form confluence setups
• You have more indicator slots than you need
🔎 Use VTense when :
• You need compact clarity across multiple instruments
• You’re prioritizing confluence _detection_ over granular separation
• You’re building efficient multi-layered systems under slot constraints
🏗️ Structural Behavior and Interpretation
🫁 Z VOL Respiration Histogram : Structural Effort vs Baseline
🔵 Compression Coil – volume volatility is low and stable; the market is coiling
🟢 Steady Rhythm – volume is healthy but unremarkable; balanced participation
🟡 Passive/Absorbed Effort – expansion failing to manifest; watch for reversal
🟠 Clean Expansion – actionable volatility rise backed by structure
🔴 Volatile Blowout – chaos, climax; likely end-phase or fakeout
⚖️ ZVOL Respiration measures how hard the crowd is pressing — not just that volume is rising, but how statistically abnormal the surge is. Because it is rescaled proportionally to OBVX, the amplitude of the histogram reflects structural urgency without overwhelming the visual field.
🖐️ OBVX Spread : Real-Time Directional Conviction Behind Price Moves
🔑 The curvature of the spread reveals not just directional bias but crowd temp o: sharp slopes = urgent transitions; gradual slopes = building structural shifts. Curvature is key: sharp OBVX slope = urgency; gentle arcs = controlled drift or indecision.
• Green Rising : Accumulation — upward pressure from real buyers
• Red Falling : Distribution — sell pressure, downward slope
• Flat Curves : Transitional → uncertainty, microstructure digestion
🎭 Synchronized vs Divergent Behavior
⏱️ Synchronized (high-confluence) : often precedes structural breakouts, with internal conviction clearly visible before price resolves.
• ZVOL expands (yellow/orange/red) and OBVX climbs steeply green = strong bullish pressure
• ZVOL expands while OBVX steepens red = growing sell-side intent
🪤 Divergent (conflict tension) : flags potential traps, fakeouts, and liquidity sweeps.
• ZVOL expands sharply, but OBVX flattens or opposes → reactive expansion without crowd commitment
⛔️ Latent Drift + Structural Holding Patterns : tensegrity in action — the market holds tension without directional release.
• ZVOL compresses (blue) + OBVX meanders near zero → structure is resting, building up energy
• After prolonged drift, expect violent asymmetry when balance finally breaks
📚 Phase Interpretation: Dynamic Structural Read
• 1️⃣ Quiet Coil : Histogram flat, OBVX flat → no urgency
• 2️⃣ Initial Pulse : Yellow bars, OBVX slope builds → actionable tension
• 3️⃣ Structural Breath : Synchronized expansion and slope → directional commitment
• 4️⃣ Disagreement : Spike in ZVOL, flattening OBVX → exhaustion risk or false signal
💡 Suggested Use
• Run on 15m charts for breakout anticipation and 1H for validation
• Pair with ZVOL + OBVX to confirm crowd conviction behind the tension phase
• Use as a rhythm filter for the suite's trend indicators (e.g., RDI , SUPeR TReND 2.718 , et. al.)
• Ideal during low-volume regimes to detect pressure buildup before triggers
🧏🏻 Volumetric Tensegrity doesn’t signal. It breathes , and listens to pressure shifts before they speak in price. As a scout, it lets you see structural posture before signals align — helping you front-run resolution with clarity, not prediction.

Volume Profile & Smart Money Explorer🔍 Volume Profile & Smart Money Explorer: Decode Institutional Footprints
Master the art of institutional trading with this sophisticated volume analysis tool. Track smart money movements, identify peak liquidity windows, and align your trades with major market participants.
🌟 Key Features:
📊 Triple-Layer Volume Analysis
• Total Volume Patterns
• Directional Volume Split (Up/Down)
• Institutional Flow Detection
• Real-time Smart Money Tracking
• Historical Pattern Recognition
⚡ Smart Money Detection
• Institutional Trade Identification
• Large Block Order Tracking
• Smart Money Concentration Periods
• Whale Activity Alerts
• Volume Threshold Analysis
📈 Advanced Profiling
• Hourly Volume Distribution
• Directional Bias Analysis
• Liquidity Heat Maps
• Volume Pattern Recognition
• Custom Threshold Settings
🎯 Strategic Applications:
Institutional Trading:
• Track Big Player Movements
• Identify Accumulation/Distribution
• Follow Smart Money Flow
• Detect Institutional Trading Windows
• Monitor Block Orders
Risk Management:
• Identify High Liquidity Windows
• Avoid Thin Market Periods
• Optimize Position Sizing
• Track Market Participation
• Monitor Volume Quality
Market Analysis:
• Volume Pattern Recognition
• Smart Money Flow Analysis
• Liquidity Window Identification
• Institutional Activity Cycles
• Market Depth Analysis
💡 Perfect For:
• Professional Traders
• Volume Profile Traders
• Institutional Traders
• Risk Managers
• Algorithmic Traders
• Smart Money Followers
• Day Traders
• Swing Traders
📊 Key Metrics:
• Normalized Volume Profiles
• Institutional Thresholds
• Directional Volume Split
• Smart Money Concentration
• Historical Patterns
• Real-time Analysis
⚡ Trading Edge:
• Trade with Institution Flow
• Identify Optimal Entry Points
• Recognize Distribution Patterns
• Follow Smart Money Positioning
• Avoid Thin Markets
• Capitalize on Peak Liquidity
🎓 Educational Value:
• Understand Market Structure
• Learn Volume Analysis
• Master Institutional Patterns
• Develop Market Intuition
• Track Smart Money Flow
🛠️ Customization:
• Adjustable Time Windows
• Flexible Volume Thresholds
• Multiple Timeframe Analysis
• Custom Alert Settings
• Visual Preference Options
Whether you're tracking institutional flows in crypto markets or following smart money in traditional markets, the Volume Profile & Smart Money Explorer provides the deep insights needed to trade alongside the biggest players.
Transform your trading from retail guesswork to institutional precision. Know exactly when and where smart money moves, and position yourself ahead of major market shifts.
#VolumeProfile #SmartMoney #InstitutionalTrading #MarketAnalysis #TradingView #VolumeAnalysis #CryptoTrading #ForexTrading #TechnicalAnalysis #Trading #PriceAction #MarketStructure #OrderFlow #Liquidity #RiskManagement #TradingStrategy #DayTrading #SwingTrading #AlgoTrading #QuantitativeTrading

Volume with EMA and Coloring RulesSummary
This indicator plots the market’s volume as a histogram in a separate panel (not overlaid on the main price chart). An EMA (Exponential Moving Average) is then calculated based on the volume. The color of each volume bar switches dynamically:
• Blue when the bar’s volume is higher than the EMA
• White when the bar’s volume is lower than or equal to the EMA
This simple visual cue allows you to quickly see if the market’s current volume is above or below its average trend.
How to Use
1. Add to Chart
Apply the indicator to your TradingView chart, and it will open in a separate panel beneath the price.
2. Adjust EMA Length
Modify the “EMA Length” to control how quickly the average volume adapts to changes.
3. Interpretation
• Blue bars may indicate stronger-than-usual participation.
• White bars indicate volume is relatively lower compared to its recent average.
This indicator provides an at-a-glance way to see if trading activity is intensifying or easing, which can be paired with other technical or fundamental tools to help confirm market shifts or potential opportunities.

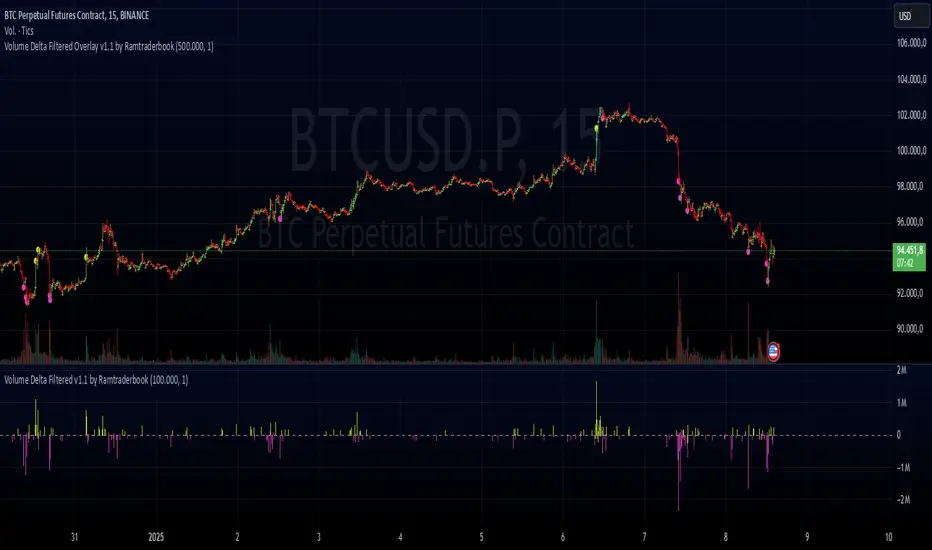
Volume Delta Filtered Overlay v1.1 by RamtraderbookVolume Delta Filtered Overlay v1.1 by Ramtraderbook
This indicator visually displays the volume delta directly on the price chart using colored circles. Its main goal is to highlight significant changes in the volume delta, categorizing them by direction and magnitude.
How It Works
1. Volume Delta Calculation
- Measures the difference between buying and selling volume on a lower time frame.
2. Threshold Filter
- Only displays data if the delta exceeds a minimum threshold set by the user.
3. Colors by Direction
- Bullish color: If the delta is positive (more buying).
- Bearish color: If the delta is negative (more selling).
4. Circle Placement
- Circles are placed above the candle for a positive delta and below the candle for a negative delta.
Customizable Inputs
- Delta Threshold: Defines the minimum delta value that will be plotted.
- Customizable Colors: Allows you to set different colors for positive and negative delta circles.
- **Lower Time Frame**: Scans data on a lower time frame for greater accuracy.
Important Note on Data
TradingView does not handle market depth data such as order book information. The volume delta calculation is an approximation based on the asset’s volume and price behavior. This means it does not precisely reflect the actual flow of buy or sell orders in the market, but rather an estimate derived from available data.
Conclusion
The **Volume Delta Filtered Overlay v1.1 by Ramtraderbook** is a visual tool that helps quickly identify significant buy or sell volume movements, making it ideal for strategies that rely on order flow analysis. However, it is recommended to combine it with other tools for a more comprehensive analysis.

Volume Delta Filtered v1.1 by RamtraderbookIndicator Explanation: Volume Delta_RTB (Filtered)
General Description
The Volume Delta_RTB (Filtered) indicator is designed to analyze the volume delta of a financial asset and highlight only significant changes based on a configured threshold. This indicator is useful for detecting moments when buying volume exceeds selling volume (or vice versa), providing a clear view of market pressure.
What is Volume Delta?
Volume delta measures the difference between buying and selling volume over a given time period. A positive delta indicates that buying prevails over selling, while a negative delta indicates the opposite.
Indicator Inputs
The indicator has several customizable parameters to suit the user’s needs:
1. Volume Delta Threshold
- Allows you to set a minimum volume delta value.
- Only indicator values that exceed this absolute delta threshold will be displayed.
- Default value: 100,000.
2. Use of a Lower Time Frame
- Option to analyze data from a lower time frame than the main chart.
Operating Logic
1. Selection of the Lower Time Frame
- The indicator scans data from a lower time frame to accurately calculate the volume delta.
- By default, it automatically selects an appropriate lower time frame, though it can be set manually.
2. Calculation of Volume Delta
- Using the `ta.requestVolumeDelta` function, the indicator calculates:
- Volume delta at the start of the period (`openVolume`).
- Maximum delta (`maxVolume`).
- Minimum delta (`minVolume`).
- Last recorded delta (`lastVolume`).
3. Filtering Values
- If the absolute value of `lastVolume` (the last volume delta) is below the configured threshold (`deltaThreshold`), the data will not be displayed on the chart.
- This allows the indicator to highlight only significant movements, avoiding unnecessary noise.
4. Visualization
- Volume delta is represented by candles to facilitate interpretation:
- Yellow candles for positive delta (buying prevails).
- Pink candles for negative delta (selling prevails).
- A horizontal line at `0` serves as a reference.
- Colors can be configured as needed.
5. Data Validation
- If the data provider does not provide volume information for the asset, the indicator will display an error message.
Indicator Advantages
- Efficient Filtering: Focus on the most relevant movements in terms of volume, ignoring small or insignificant values.
- Adaptable: Offers customization options for both the delta threshold and the time frame.
- Clear Visualization: Colored candles make it easier to spot dominant buying or selling trends.
NOTE:
- Estimated Delta Data: Since TradingView does not have access to market depth data or an exact breakdown of buying and selling volume, the delta calculations are approximations based on price and volume behavior.
- Data Provider Dependency: Some assets or instruments may not have volume information available, limiting the indicator’s use.
Volume Volatility and Delta Indicator (HN)This Volume Volatility Indicator with Overall Average from Hossein.N helps you visualize the volatility of volume on different timeframes and compares it to the average volume over a given period. It includes several components:
Volume Volatility Indicator (Blue Line): This shows the volatility of volume relative to its moving average over a specified period. Higher values indicate more volatile trading conditions.
Long-Term Volatility Average (Orange Line): This line shows the moving average of the volume volatility indicator over a longer period. It acts as a benchmark for comparing the current volume volatility with historical trends.
Average Volume on Up Days (Green Line): Displays the average volume on days when the price is going up (green).
Average Volume on Down Days (Red Line): Displays the average volume on days when the price is going down (red).
Delta in Percentage (Blue Line): This shows the difference between the average volume of up days and down days, expressed as a percentage of the overall moving average of volume. It can be used to identify bullish or bearish volume imbalances. For example:
Positive values indicate that the volume on up days is stronger than on down days, which could suggest a bullish trend.
Negative values suggest that volume on down days is stronger than on up days, potentially indicating a bearish trend.
Zero Line (Gray Dotted Line): A reference line at 0 that helps you identify when the delta is positive or negative, and visualize the neutral point where volume is balanced between up and down days.
How to Use This Indicator:
Add to Your Chart: Copy the script above and paste it into TradingView's Pine Script editor. Click "Add to Chart" to visualize the indicator.
Interpret the Indicator:
Volume Volatility: A higher value suggests high market volatility. When volume is highly volatile, it may indicate more significant price movements or market uncertainty.
Long-Term Average of Volatility: Use this line as a reference to see whether current volatility is above or below average over a longer period.
Delta in Percentage: This is particularly useful to compare the strength of buying and selling volume. A positive delta percentage suggests strong buying pressure, while a negative delta suggests strong selling pressure. The closer the delta is to zero, the more balanced the volume between up and down days.
Use for Trend Confirmation: The indicator can help confirm trends. If the delta percentage is positive and increasing, and the volume volatility is above average, it could signal strong bullish momentum. Conversely, if the delta is negative and the volume volatility is rising, it may suggest bearish sentiment.
Risk Disclaimer:
Important: This indicator is a tool designed to help analyze market conditions. It does not guarantee success in trading and should not be used as the sole basis for making trading decisions. Always do your own research, consider other factors (e.g., price action, market news, fundamentals), and manage your risk appropriately. Trading involves significant risk, and you should only trade with money you can afford to lose. Always ensure you understand the risks involved in trading and use risk management strategies.
By using this tool, you accept full responsibility for any trading decisions and the outcomes thereof. The information presented is for educational and informational purposes only.

Volume Positive & Negative Levels [ChartPrime]Volume Positive & Negative Levels
Overview:
The Volume Positive & Negative Levels indicator by ChartPrime is designed to provide traders with a clear visualization of volume activity across different price levels. By plotting volume levels as histograms, this tool helps identify significant areas of buying (positive volume) and selling (negative volume) pressure, enhancing the ability to spot potential support and resistance zones.
Key Features:
⯁ Lookback Period:
- The `lookbackPeriod` parameter, set to 500 bars, determines the range over which the volume analysis is conducted, ensuring a comprehensive view of the market’s volume activity. The maximum lookback period is 500 bars or the bars currently visible on the chart, whichever is smaller.
⯁ Dynamic Volume Calculation:
- Volume is calculated dynamically based on the price action, with positive volume indicating buying pressure (close > open) and negative volume indicating selling pressure (close < open).
⯁ Color Coding for Clarity:
- Positive Volume: Represented with a distinct color (`#ad9a2c`), making it easy to identify areas of buying interest.
- Negative Volume: Highlighted with another color (`#ad2cad`), simplifying the detection of selling pressure.
Volume Threshold and Bins:
- The indicator allows users to set a volume threshold (`volume_level`) to highlight significant volume levels, with the default set at 70.
- The number of bins (`numBins`) defines the granularity of the volume profile, with a higher number providing more detail.
⯁ Volume Profile Visualization:
- The volume profile is plotted as a histogram, with the height of each bar proportional to the volume at that price level. This visualization helps in quickly assessing the strength of volume at various price points.
⯁ Interactive Labels and Threshold Indicators:
- Labels: The indicator uses labels to mark significant volume levels, providing quick reference points for traders.
- Threshold Lines: Lines are drawn at specified volume thresholds, with colors and widths dynamically adjusted based on the volume levels.
⯁ User Inputs:
- Volume Threshold (`volume_level`): Sets the minimum volume required to highlight significant levels.
- Number of Bins (`numBins`): Determines the resolution of the volume profile.
- Line Width (`line_withd`): Specifies the width of the lines used in the visualization.
The Volume Positive & Negative Levels indicator is a powerful tool for traders looking to gain deeper insights into market dynamics. By providing a clear visual representation of volume activity across different price levels, it helps traders identify key support and resistance zones, spot trends, and make more informed trading decisions. Whether you are a day trader or a swing trader, this indicator enhances your ability to analyze volume data effectively, improving your overall trading strategy.

Volume peak based zonesThis is a simple but effective indicator based on simple volume.
What does this indicator for you:
Zones are drawn on the basis of volume peaks. It is used for this purpose the closing price to the high or to the low depending on the direction of the candle.
How can this be used:
With volume peaks one assumes that a movement has reached your end for the time being or a new movement is initiated.
This cannot be verified by simple volume alone.
If a zone is displayed is now to pay attention to the following:
Narrow zone: indicate when creating mostly a continuation of the trend. Can later, however, be used as support or resistance.
Medium zones: The price is in an accumulation phase. Here is crucial, whether a candle with increased volume (preferably above the volume SMA) arises and the high or the low of the zone by closing price leaves. Accordingly, a short or long position can be taken. As SL, the high or low of the zone or the candle itself can be used.
Large zones: The high and low of the zone indicate a range in which the price will stay in the near future. The low or the high can be used as a once if the price does not leave the zone despite high volume at the close.
Otherwise, this can be interpreted as a breakout.
Principles of Volume:
Rising Volume at Rising Price = Intact Trend
Rising Volume at Falling Price = Intact Trend
Falling volume at rising price = correction movement
Falling volume at falling price = correction movement
Have Funn!!

Volume Profile Matrix [LuxAlgo]The Volume Profile Matrix indicator extends from regular volume profiles by also considering calculation intervals within the calculation window rather than only dividing the calculation window in rows.
Note that this indicator is subject to repainting & back-painting, however, treating the indicator as a tool for identifying frequent points of interest can still be very useful.
🔶 SETTINGS
Lookback: Number of most recent bars used to calculate the indicator.
Columns: Number of columns (intervals) used to calculate the volume profile matrix.
Rows: Number of rows (intervals) used to calculate the volume profile matrix.
🔶 USAGE
The Volume Profile Matrix indicator can be used to obtain more information regarding liquidity on specific time intervals. Instead of simply dividing the calculation window into equidistant rows, the calculation is done through a grid.
Grid cells with trading activity occurring inside them are colored. More activity is highlighted through a gradient and by default, cells with a color that are closer to red indicate that more trading activity took place within that cell. The cell with the highest amount of trading activity is always highlighted in yellow.
Each interval (column) includes a point of control which highlights an estimate of the price level with the highest traded volume on that interval. The level with the highest traded volume of the overall grid is extended to the most recent bar.

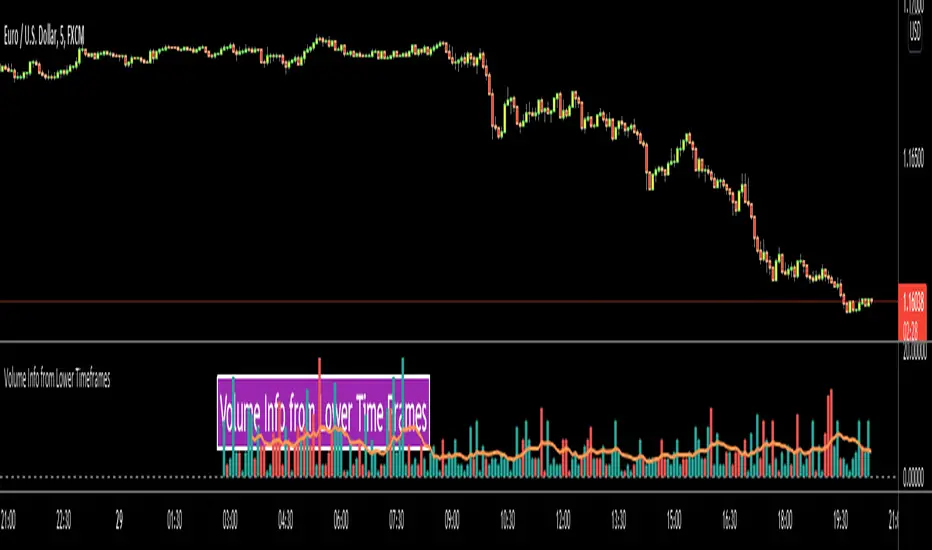
Volume Info from Lower Time FramesHello Traders,
We are now able to get info from lower time frames, Many Thanks to Pine Team .This script gets volume info from lower time frames and give alert if there is extreme volumes on last X lower time frame candles (if last X volumes are higher than volume moving average). so that if you set alerts on different securities then you will be able get alert if there is extreme volume moves and you can check the chart immediately.
The options:
Timeframe in Seconds : you can set lower time frames in seconds. by default it's 5 seconds. if you set it 60 then it will show 1min volumes, if you set it 1 then it will show 1 seconds volumes
MA Length : The script draws simple moving average using this length info. by default it's 20.
Number of Bars to Check for Alert : by default it's 5. meaning that if last 5 candles is greater than moving average and if you set alert then you get the alert "Extreme Volume"
Other options are for colors and line width.
As you can see in following example, chart time frame is 1 hour and the script shows volume info of 5 seconds candles:
Enjoy!
Volume Delta, Total Volume, Buy & Sell VolumeThis indicator comes with multiple functions:
▪ Better Volume - Total Volume, Buy Volume, Sell Volume
This mode shows the traded volume during each interval in a more detailed way.
The advantage is that you can see both sides of the market: the Buy Volume and the Sell Volume.
You have the option to see the traded volume per interval:
- on a 0 centered y-axis, a green bar above for the Buy Volume and a red bar below for the Sell Volume;
- or to see it normally, total volume as a shade-like bar and two other brighter bars for either Buy or Sell volume.
▪ Volume Delta
It is the difference between the Buy Volume and the Sell Volume. It can help see the direction of the market.

Volume Profile + Price Action Strategy (POC-based)This indicator combines volume dynamics, price action patterns, and a simplified Point of Control (POC) to highlight potential high-probability trade zones.
🔍 Key Features
POC-Based Logic
Plots the POC from the most recent closed 10-minute candle as a horizontal level for intraday structure.
Volume Spike Detection
Highlights unusual activity based on volume compared to the average of the last N candles.
Effort vs. Result Analysis
Based on Wyckoff-inspired logic:
Absorption: Large volume, small body → possible buyer/seller absorption
False Move: Small volume, large body → potential fakeout
Price Action Recognition Detects:
Inside Bars
Pin Bars
Engulfing Candles
Signal Highlights
🔺 Absorption Signals (below bar, teal triangle)
🔻 False Move Signals (above bar, orange triangle)
🔷 POC Line
⚙️ Customizable Inputs
You can control signal sensitivity with these inputs:
Volume Spike Multiplier
Raise to filter only extreme volume spikes
→ Recommended: 2.0 to 3.0 for cleaner setups
Absorption Body Ratio
Lower to detect only very small bodies (tight candles)
→ Try 0.3 to 0.4 for stricter absorption logic
False Move Body Ratio
Raise to catch only large candles on low volume
→ Use 2.0+ to filter weak moves
🧠 How to Use
Use in confluence with:
Support/Resistance
VWAP or moving averages
Session opens/closes
Best on 10-minute charts, but adjustable
✅ Signal Tuning Tips
Want fewer but cleaner signals?
Increase Volume Spike Multiplier: 2.5+
Decrease Absorption Body Ratio: 0.3
Increase False Move Ratio: 2.0+
Want more frequent signals?
Lower Volume Multiplier: 1.2–1.5
Raise Absorption Ratio: 0.6+
Lower False Move Ratio: 1.2–1.4
📊 Recommended Timeframe
Optimized for 10-minute charts
Works intraday, especially around session opens and POC re-tests
⚠️ Disclaimer
This script is for educational and informational purposes only. It does not constitute financial advice or a recommendation to buy or sell any asset. Past performance is not indicative of future results. Always do your own research and consult a licensed financial advisor before making trading decisions.
Use at your own risk.
