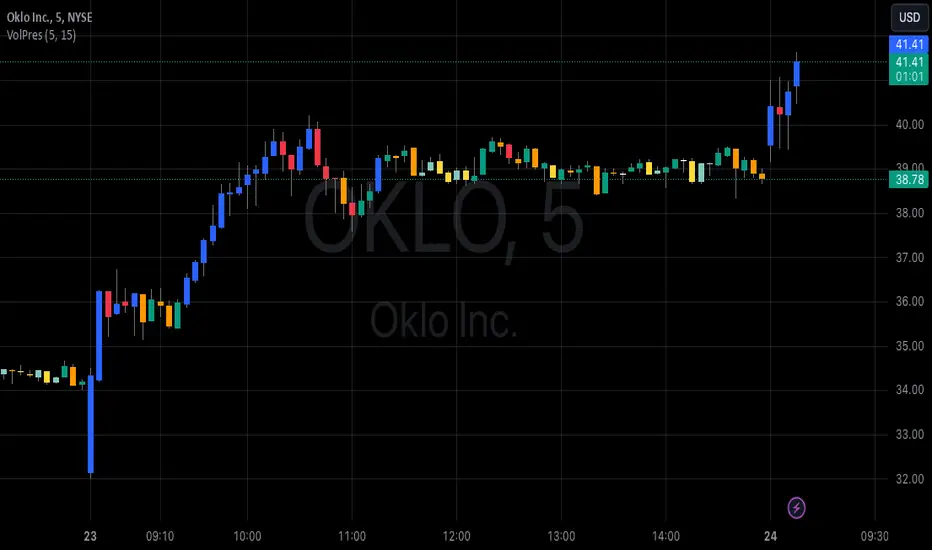
Volume PressureDraws the candle chart with colors to represent low, medium and high volumes. You get 3 colors for downward and 3 colors for upward movement. This will aid with immediately seeing the relative volume pushing the stock candle in the direction of movement.
You can control the percentage threshold for low and high volume. You also can change the colors to represent each volume level for upward and downward movement.
"volume" için komut dosyalarını ara
Volume Equilibrium Overlay(2 of 2)This is an overlay for a prior script I've created: Volume Equilibrium.
To sum it up in a brief manner, this script plots when there is "volume-equilibrium" aka prices that the market may see as "fair-value" relative to the specified timeframe. This script provides what my last code lacked and that is a visual representation of critical prices.
The arrows beside the indications indicate the direction that the buying/selling volume was heading towards.
UP ARROW - indicates that equilibrium was had via increasing buy volume
DOWN ARROW - indicates that equilibrium was had via decreasing buy volume
Remember, this doesn't inherently mean that a stock is supposed to go up or down. Its just a representation of 'fair-value' points using volume. Also remember... both indicators provide what the other lacks. It isn't necessary to use both but for a broad overview of volume it definitely helps to at least be aware of how this information can be represented. Perhaps... consider switching between the two to see what you may be missing.
I believe finding 'fair-value' points via volume and price action provides a more objective way to measure what prices one should look at rather then arbitrary lines plotted on a chart. For more information feel welcome to look at the script that this code is based off of.

Volume Explosion [ProjeAdam]OVERVIEW
The purpose of the indicator is to detect significant changes in trading volume in financial markets.
USER GUIDE:
The user can change the sensitivity of the indicator by adjusting the multiplier value. The higher the multiplier, the harder it is to detect high volume bars.
The multiplier set by the user determines how much a move above the volume values is considered an "explosion". A higher multiplier results in fewer volume bursts being detected.
ALGORITHM
LANGUAGE
We have two different language options in our indicator. Users can use it in Turkish or English.
If we change the language option on our indicator, the language on our indicator that shows the upper and average level of our Band changes.
CALCULATING EXPLOSIONS
The indicator calculates the simple moving average of volume over a certain period of time. This average is used to identify abnormal movements by comparing it with the current volume.
If the current volume is higher than a certain multiple of the moving average, this is considered a volume burst. This indicates significant activity in the market.
ALARMS
We can change the parity for which we want to receive an alarm from the settings panel and ensure that we receive an alarm at the parity we want.
VİSUALİZATİON
When an alarm occurs in our parities, a separate indicator appears at the bottom right of the chart showing which parities the alarm is triggered in.
If there is no signal in the next bar, this table is automatically deleted.
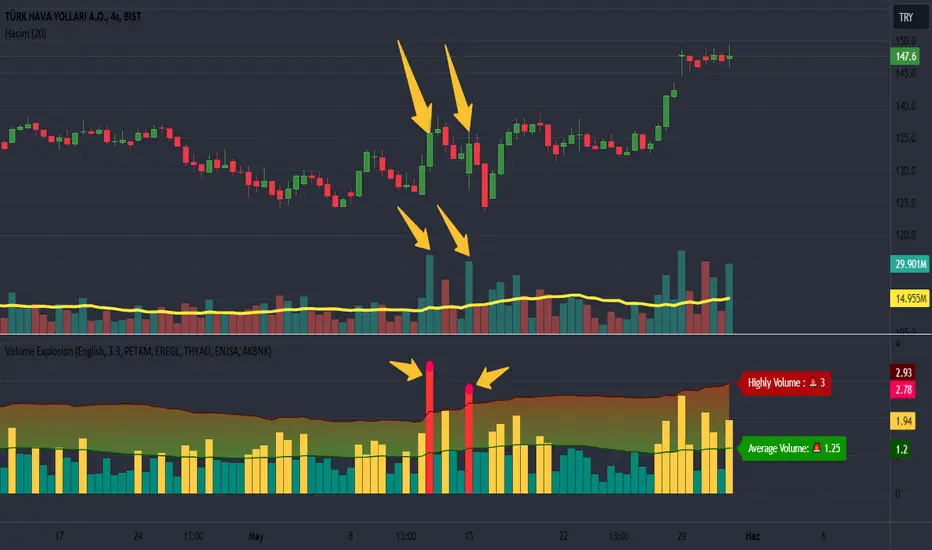
Example
We understand that we have excessive volume in the two bars in our example and that interest in this financial product has increased in this region.
Benefits
This indicator is especially useful for traders who care about volume changes.
This indicator can be used as a helpful tool in trading decisions, as sudden increases in volume can be the beginning of a significant move in the market.
If you have any ideas what to add to my work to add more sources or make calculations cooler, suggest in DM .
Volume Directional OscillatorVolume Directional Oscillator is an indicator that combines several types of metrics for a convenient understanding of price movements.
The indicator displays a histogram of red, dark red, green, dark green and yellow columns, as well as a red-green line.
Red columns indicate an increase in selling volumes as the price moves.
Dark red indicates a decline compared to the previous candle.
Green indicates an increase in buy volumes.
Dark green indicates a decline from the previous candle.
Yellow columns appear when the market moves without volume, in other words, by inertia.
The red-green line passing through the tops of the columns indicates that buyers or sellers currently prevail. Green are buyers and red are sellers.
It is also possible to display overbought and oversold levels. By default, they correspond to the values 50 and -50. When the indicator goes beyond one of the levels, the background turns orange. Line and background colors can be changed in the settings.
Also, the indicator can be used to determine divergences and convergences and use them in a trading strategy.
-------------------------------------------
Volume Directional Oscillator - индикатор осциляторного типа, который объединяет в себе несколько видов показателей для удобного понимания движения цен.
Индикатор отображает гистограмму из красных, темно-красных, зеленых, темно-зеленых и желтых полос, а также красно-зеленую линию.
Красные полосы обозначают увеличение объемов на продажу по мере движения цены.
Темно-красные обозначают снижение, по сравнению с предыдущей свечой.
Зеленые обозначают увеличение объемов на покупку.
Темно-зеленые обозначают снижение, по сравнению с предыдущей свечой.
Желтые полосы появляются, когда движение рынка происходит без объёма, другими словами — по инерции.
Красно-зеленая линия проходящая через вершины полос указывает на то, покупатели или продавцы в данный момент преобладают. Зеленая — покупатели, а красная — продавцы.
Еще есть возможность отобразить уровни перекупленности и перепроданности. По умолчанию, они соответствуют значениям 50 и -50. Вы выходе индикатора за один из уровней, фон окрашивается в оранжевый. Цвета линий и фона можно изменить в настройках.
Также, по индикатору можно определять дивергенции и конвергенции и использовать их в торговой стратегии.

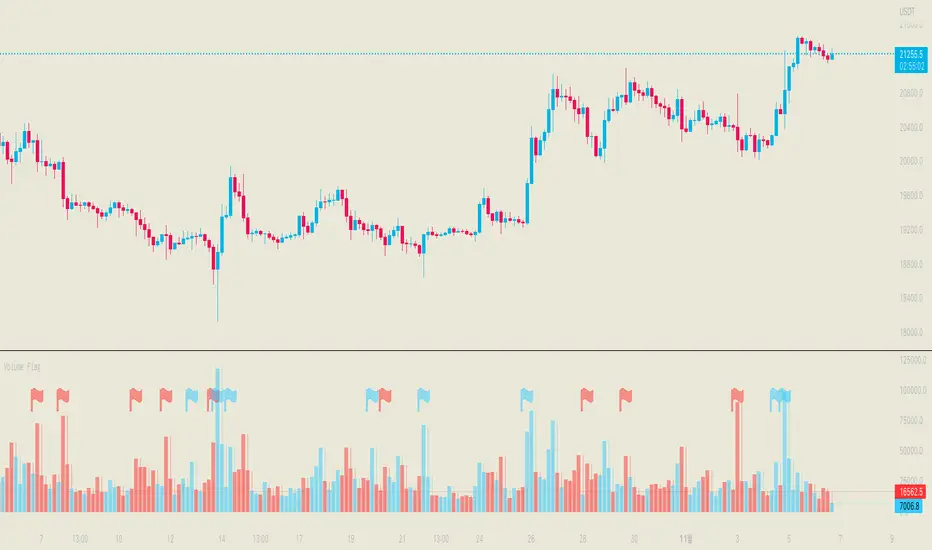
Volume FlagThis indicator shows the increased volume compared to the previous volume.
A flag is displayed when the trading volume increased by *n of the previous candle.
Receive a signal as an alert.
Thank you.
(Please comment and click on the rocket.)
-------------------
이 지표는 이전 캔들의 거래량 대비 증가된 거래량을 확인할 수 있습니다.
깃발을 사용하여 증가 감소를 확인할 수 있으며 n배 만큼의 증가 되었을때 표시됩니다.
그리고 깃발이 표시될 경우 알람을 받으실 수 있습니다.
감사합니다.
댓글과 로케트 클릭 부탁드립니다.
Volume Profile, Pivot Anchored by DGTVolume Profile (also known as Price by Volume ) is an charting study that displays trading activity over a specified time period at specific price levels. It is plotted as a horizontal histogram on the finacial isntrumnet's chart that highlights the trader's interest at specific price levels. Specified time period with Pivots Anchored Volume Profile is determined by the Pivot Levels, where the Pivot Points High Low indicator is used and presented with this Custom indicator
Finally, Volume Weighted Colored Bars indicator is presneted with the study
Different perspective of Volume Profile applications;
Anchored to Session, Week, Month etc : Anchored-Volume-Profile
Custom Range, Interactive : Volume-Profile-Custom-Range
Fixed Range with Volume Indicator : Volume-Profile-Fixed-Range
Combined with Support and Resistance Indicator : Price-Action-Support-Resistance and Volume-Profile
Combined with Supply and Demand Zones, Interactive : Supply-Demand-and-Equilibrium-Zones
Disclaimer : Trading success is all about following your trading strategy and the indicators should fit within your trading strategy, and not to be traded upon solely
The script is for informational and educational purposes only. Use of the script does not constitutes professional and/or financial advice. You alone the sole responsibility of evaluating the script output and risks associated with the use of the script. In exchange for using the script, you agree not to hold dgtrd TradingView user liable for any possible claim for damages arising from any decision you make based on use of the script

Volume SpikesOVERVIEW
Easily identify volume spikes. This indicator identifies volume spike bars and highlights them to facilitate studying volume spikes alongside price action.
CONCEPTS
Bars with abnormally high volume indicate market interest and are worth a closer look. They could indicate market exhaustion or act as future areas of S/R (as shown by the horizontal rays above).
The question is the level of volume that should prompt our interest.
Here, we use the Upper Band of a long-term Bollinger Bands applied on volume to identify bars with outlier volumes. (The lower panel of the chart shown serves to illustrate this concept, and is not included in this indicator.)
HOW TO USE
Volume spike bars will be highlighted in green by default. You may study how the market price action reacts to these volume spikes without the distraction of a separate plot.
Parameters
Period - Lookback period for the Bollinger Bands applied on volume.
Multiple - Multiple for the same Bollinger Bands.
Feel free to experiment with the parameters, but the default parameters work well for me on daily charts. However, for intraday timeframes, due to the typical skewing of volume to the beginning and end of a session, they do not work as well.

Volume Trend MeterSweet little indicator which measures volume pressure over a specific period of time.
i call it Volume Trend Meter, or just VTM,
The indicator sums up all green candles volume and red candles volumes over a specific period of bars (you set in settings) and plots their values.
Use this indicator to identify increasing volume with the green candles (close higher than open) and increasing volume of the red candles (close is lower than open).
======= Calculation ==========
For Green Column: Total volume of green candles is higher than total red candles volume.
For Red Column: Total volume of red candles is higher than total green candles volume.
======= Volume Trend Meter Colors =======
Green: Increasing buying pressure.
Red: Increasing selling pressure.
Like if you like and Follow me for upcoming indicators/strategies.

Δ Volume Finder Vol Delta v1.0 by 🇨🇷🇾🇵🇹🇴🇷🇹🇭🇾🇭🇲🇸Δ Volume Finder Vol Delta v1.0 by 🇨🇷🇾🇵🇹🇴🇷🇹🇭🇾🇭🇲🇸
General Description
💰This indicator is given FREE to all our premium indicator subscribers.
🔊Volume Finder is an indicator designed to provide additional insights, and actionable information from the vanilla volume indicator you are all used to.
ℹ More information is never a bad thing! This indicator gives you several tools in one package. The aim is to give volume some additional depth and utility.
🕞The indicator works on any timeframe and any market that has basic volume data (stocks, forex, crypto).
📜 Features
🎚 First off the volume bars are split into positive volume and negative volume. This allows you to more easily visualize the amount of a "green" candle that was actually SELLS, and vice versa - the amount of a "red" candle that were actually BUYS.
🌈It will auto gradient the volume levels based on historical volume range for whatever instrument you are looking at. Yellow bars are deviated outside the lower range (many times this will precede a breakout / breakdown).
🚫If you do not wish to set the auto gradient, you can manually set the levels you would like via settings, or turn it off.
🚦 Next is the Volume Delta. This is the line that is oscillating above and below zero. This shows you the net positive or negative volume. In other words, it shows you the total positive or negative volume.
➕➖ Third are options for EMA plots of the total positive volume and total negative volume. This should be pretty self explanatory.
📩 Lastly is a system that generates alerts when volume breaks out past a certain user defined level. You can plot these alerts as one or both of the following: colored bars on the price chart, or alert bubbles within the indicator pane.
💭Please leave me any ideas or feedback you have!
💬Questions? Comments? Want to get access to an entire suite of proven trading indicators? Come visit us on telegram and chat, or just soak up some knowledge. We make timely posts about the market, news, and strategy everyday. Our community isnt open only to subscribers - everyone is welcome to join.

Volumes on CandleThis script uses standard deviation of volume from the mean to color the candles.
IMPORTANT: Hide original candle, clicking in the "eye" near title.
I prefer use large Length input for more stability at mean and standard deviation values.
Uses 5 colors, by default:
Red = Volume >= 4 stdev;
Orange = 4 stdev > Volume >= 2.5 stdev;
Yellow = 2.5 stdev > Volume >= 1 stdev;
White = 1 stdev > Volume >= -0.5 stdev;
Aqua = -0.5 stdev > Volume.
I coded another script, called "Colored Volumes Histogram". It uses the same idea, but color directly the volume histogram.

Volume Pressure and PercentVPP Volume Pressure and Percentage Indicator with a Volume Trendline that indicates which side is driving the flow.
Features:
1. Buy/Sell Pressure Bars (Core Volume Split)
The indicator separates each candle’s volume into buy volume (green) above the zero line and sell volume (red) below it. This gives you a real-time visualization of which side is more aggressive within the current bar. Instead of waiting for prices to move or candles to close, you can instantly see whether buyers or sellers are stepping in.
2. Dynamic Total Volume (Invisible Histogram + Status Line Color)
The total volume of each bar is tracked behind the scenes and displayed in the pinned status line using a dynamic color—green when buyers dominate, red when sellers dominate. The histogram for total volume is invisible to keep the chart clean, but the total volume figure stays visible and changes color based on who is in control. This gives you instant confirmation of whether institutional-sized volume supports the direction shown by the buy/sell pressure, which is especially valuable when evaluating the risk or conviction behind a potential entry.
3. Percentage Mode (% of Bar Volume)
When toggled on, the indicator converts each bar into percent buy vs percent sell, normalizing all flow to a 0–100% scale. This mode is incredibly useful when comparing pressure across different times of day, gaps, or varying volume conditions—such as early morning spikes versus lunchtime chop. By removing absolute volume from the equation, you gain a clean look at the actual imbalance between buyers and sellers.
4. 70% Pressure Band (Imbalance Threshold Zone)
In percentage mode, the indicator displays a subtle 70% band (a light gray zone) above and below the zero line, showing where buy or sell pressure reaches extreme dominance (≥70%). When a bar’s buy or sell percentage enters this zone, it highlights moments of exhaustion, acceleration, or potential reversal. The band acts like a real-time overbought/oversold gauge specifically for volume imbalance, not price.
5. Trend Line (Net Pressure Trend / Reversal Detector)
The trend line smooths out the net volume pressure (buy volume minus sell volume or its percentage equivalent) and shows the overall direction of order flow. When the line slopes upward, buyers are gaining control; when it slopes downward, sellers are taking over. This trend line acts as a real-time momentum indicator based directly on flow rather than price. Because it reacts quickly to intrabar shifts in buy/sell pressure, it often turns before price does—giving you a measurable timing edge.
6. Auto-Selecting Trend Source (Volume Net, Percent Net, or CVD)
The indicator lets you choose how the trend line is calculated: Volume Net (buy minus sell volume), Percent Net (normalized imbalance), or CVD (Cumulative Volume Delta) for long-term flow bias. The default “Auto” mode automatically switches between Volume Net and Percent Net depending on which view you’re using. This flexibility allows the trend line to remain meaningful whether you’re analyzing raw volume or normalized percentage data.
7. Pinned (Status Line) Totals in K/M/B Format
Regardless of whether you’re in volume or percentage mode, the indicator always displays Total Volume, Buy Volume, and Sell Volume in the status line using abbreviated K, M, B formatting. These values update in real time and are color-coded: green for bullish dominance, red for bearish. This gives you a concise snapshot of order flow strength on every bar.
---------------------
How To Use:
Support Level Zones
• Watch for Buy bars increasing + Trend line flipping up right at or slightly below support.
• This often signals absorption — market makers filling large buy orders before reversal.
• Confirmation: Price reclaims VWAP ... enter calls / longs.
Resistance Level Zones
• Watch for Sell bars increasing + Trend line flattening/turning down near resistance.
• This signals distribution or stop runs.
• Confirmation: Price rejects VWAP ... enter puts / shorts.
Breakout Traps
• Sometimes you’ll see price break a level, but the flow doesn’t confirm (buy volume doesn’t expand).
• That’s a false breakout — fade it with options opposite the move.

Volume Spikes + Daily VWAP SD BandsVolume Spikes + Daily VWAP SD Bands
This indicator combines volume spike detection to help traders identify potential absorption zones with daily VWAP and standard deviation bands , key price levels, continuation opportunities, and possible institutional bias.
Features:
Volume Spike Detection
Highlights candles with unusually high volume relative to a configurable SMA.
Optional filters:
Local highs/lows only (Only Use Valid Highs & Lows)
Candle shapes: Hammer / Shooter only
Candle color match: bullish spikes on green, bearish on red
Plots small circles above/below bars for bullish and bearish volume spikes.
Alerts available for both bullish and bearish spikes.
Interpretation: Volume spikes at local highs/lows can indicate absorption, where one side absorbs aggressive buying/selling pressure.
Daily VWAP
Calculates volume-weighted average price (VWAP) for the current day.
Optionally shows previous day’s VWAP for reference.
Plot lines are customizable with optional circles on lines for visual clarity.
Labels on the last bar show exact VWAP values.
Institutional Bias Insight: Price above both current and previous VWAPs may indicate bullish positioning; price below both VWAPs may indicate bearish positioning. Many professional traders consider this a clue to institutional bias, but it’s not guaranteed. Always confirm with volume, delta, or orderflow analysis.
Standard Deviation Bands
Optional x1 and x2 SD bands around the daily VWAP.
Visual fill between bands shows price volatility zones.
Can be used to identify potential support/resistance or absorption zones.
Use Case: Price bounces off first SD band may indicate continuation signals, especially when volume spikes occur at those levels.
Customizable Visuals
Colors for bullish and bearish volume spikes
VWAP and SD band colors and thickness
Optional circles and filled bands for better readability
Alerts
Bullish / Bearish Volume Spikes
Supports TradingView alert system for automated notifications
Advanced Use Cases:
Combine with Cumulative Delta or Orderflow tools to confirm true absorption zones.
Identify high-volume rejection candles signaling possible trend continuation.
Use VWAP positioning relative to price to assess potential institutional bias, keeping in mind it is probabilistic, not guaranteed.
Visualize intraday VWAP levels and volatility with SD bands for better trade timing.
Settings: Fully customizable, including volume multiplier, SMA length, session filter, candle shape, color options, and VWAP/SD display preferences.

Volume Delta DashboardHow It Works:
This script creates a Volume Delta Dashboard on TradingView, which helps traders visualize the balance between buying and selling volume (Volume Delta) directly on the chart. Here's a breakdown of the key components:
Volume Delta Calculation:
The script calculates the Volume Delta by comparing the volume of bars where the price closed higher (buying pressure) to those where the price closed lower (selling pressure).
Positive Volume Delta (green background) indicates more buying activity than selling, suggesting upward price movement. Negative Volume Delta (red background) indicates more selling than buying, signaling a potential downward move.
Smoothing with EMA:
To make the volume delta trend smoother and more consistent, an Exponential Moving Average (EMA) of the Volume Delta is used. This helps to reduce noise and highlight the prevailing buying or selling pressure over a 14-period.
Dynamic Position Selection:
The user can choose where the Volume Delta dashboard table will appear on the chart by selecting a position: top-left, top-right, bottom-left, or bottom-right. This makes the indicator adaptable to different chart setups.
Coloring:
The background of the table changes color based on the value of the Volume Delta. Green indicates a positive delta (more buyers), and Red indicates a negative delta (more sellers).
Use of This Strategy:
This Volume Delta Dashboard strategy is particularly useful for traders who want to:
Monitor Market Sentiment:
By observing the volume delta, traders can get a sense of whether there is more buying or selling pressure in the market. Positive volume delta can indicate a bullish sentiment, while negative delta can point to bearish sentiment.
Confirm Price Action:
The Volume Delta can be used alongside price action to confirm the strength of a price move. For example, if the price is moving up and the volume delta is positive, it suggests that the price increase is supported by buying pressure.
Identify Divergences:
Volume delta can help traders spot divergences between price and volume. For example, if the price is moving higher but the volume delta is negative, it may suggest a weakening trend and a potential reversal.
Optimize Entry/Exit Points:
By understanding the relationship between price movement and volume, traders can make more informed decisions about entering or exiting positions. For instance, a sudden increase in buying volume (positive delta) may indicate a good entry point for a long position.
Overall, the Volume Delta Dashboard can serve as a powerful tool for improving decision-making, by providing real-time insights into market dynamics and trading sentiment.

Volume Zones Internal Visualizer [LuxAlgo]The Volume Zones Internal Visualizer is an alternate candle type intended to reveal lower timeframe volume activity while on a higher timeframe chart.
It displays the candle's range, the highest and lowest zones of accumulated volume throughout the candle, and the Lower Timeframe (LTF) candle close, which contained the most volume in the session (Candle Session).
🔶 USAGE
The indicator is intended to be used as its own independent candle type. It is not a replacement for traditional candlesticks; however, it is recommended that you hide the chart's display when using this indicator. Another option is to display this indicator in an additional pane alongside the normal chart, as displayed above.
The display consists of candle ranges represented by outlined boxes, within the ranges you will notice a transparent-colored zone, a solid-colored zone, and a line.
Each of these displays different points of volume-related information from an analysis of LTF data.
In addition to this analysis, the indicator also locates the LTF candle with the highest volume, and displays its close represented by the line. This line is considered as the "Peak Activity Level" (PAL), since throughout the (HTF) candle session, this candle's close is the outcome of the most volume transacted at the time.
We are further tracking these PALs by continuing to extend them into the future, looking towards them for potential further interaction. Once a PAL is crossed, we are removing it from display as it has been mitigated.
🔶 DETAILS
The indicator aggregates the volume data from each LTF candle and creates a volume profile from it; the number of rows in the profile is determined by the "Row Size" setting.
With this profile, it locates and displays the highest (solid area) and lowest (transparent area) volume zones from the profile created.
🔶 SETTINGS
Row Size: Sets the number of rows used for the calculation of the volume profile based on LTF data.
Intrabar Timeframe: Sets the Lower Timeframe to use for calculations.
Show Last Unmitigated PALs: Choose how many Unmitigated PALs to extend.
Style: Toggle on and off features, as well as adjust colors for each.

Volume Profile [ZeroHeroTrading]Volume Profile by ZeroHeroTrading provides Volume Profile information fully leveraging the high/low values associated with the volume. As such, it closely aligns with the price action.
You can change the indicator settings as you see fit to achieve the best results for your use case.
Algorithm Notes
The indicator retrieves high/low/volume data within the set lookback period (number of bars back). It then sorts high/low boundaries, and accumulates the volume within the boundaries. Finally, it draws the Volume Profile as a filled out polyline joining all the boundaries together with the relevant accumulated volume proportion, and the POC as a box between the boundaries with the highest accumulated volume starting from the lookback.
When the lookback period is based on days back (instead of bars back), the indicator first dynamically calculates the number of bars to look back within the set number of days.
Please note that the lookback upper limit is 1000 bars back regardless of the settings. For instance, if the requested number of days results in the calculated bars back count (relative to the chart's timeframe) to be higher than 1000, the effective lookback will be 1000 bars back.
Features
It draws the Volume Profile and POC on the chart.
It allows for setting the number of bars or days to look back for retrieving the volume information.
It allows for setting the length of the Volume Profile being displayed (as a number of bars).
It allows for setting the offset from the last bar for the Volume Profile being displayed (as a number of bars).
It allows for setting the orientation of the Volume Profile being displayed from right to left and vice versa.
It allows for setting the colors for the Volume Profile and POC.
It allows for turning the POC functionality on/off.
Settings
Volume Lookback field: Sets number of bars or days to look back for retrieving the volume information. If the Volume Lookback field is set to 0, the volume data is retrieved for the current day regardless of the Bar(s)/Day(s) selection. Default is 200. Minimum is 0 and maximum is 1000.
Volume Lookback dropdown: If Bar(s) is selected, the volume data is retrieved for the set number of bars back. If Day(s) is selected, the volume data is retrieved for the current day plus the set number of day(s) back. Default is Bar(s).
Profile Bar Length field: Sets length of the Volume Profile being displayed as a number of bars. Default is 50. Minimum is 10 and maximum is 100.
Profile Bar Offset field: Sets offset from the last bar for the Volume Profile being displayed as a number of bars. Default is 10. Minimum is 0 and maximum is 100.
Profile Orientation dropdown: Selects Volume Profile orientation. Left is -right to left- and Right is -left to right-. Default is Left.
Profile Color select: Selects Volume Profile color. Default is blue (100% opacity).
Show POC checkbox: Turns on/off POC. Default is on.
POC Color select: Selects POC color. Default is orange (80% opacity).

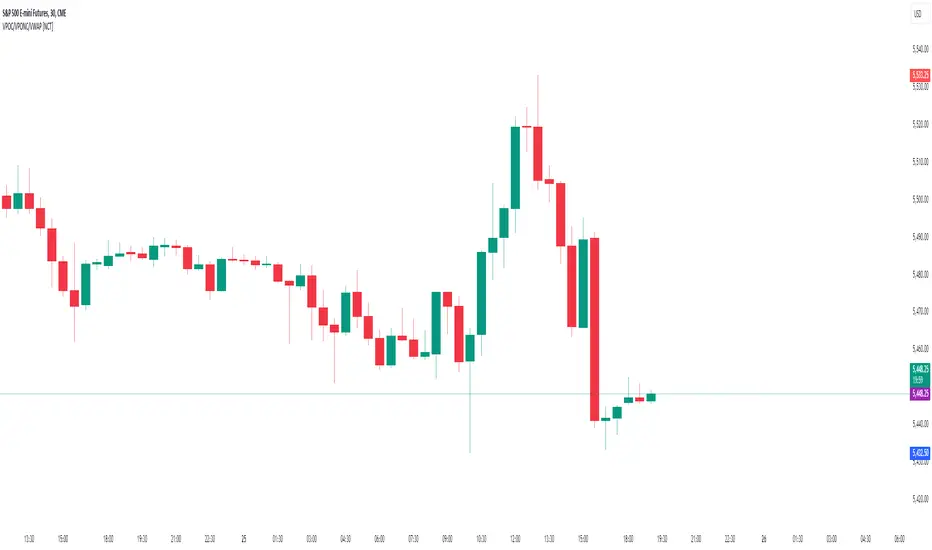
Volume Points of Control and No Control [NariCapitalTrading]Overview:
The "Volume Points of Control and No Control" (VPOC/VPONC) is a trading indicator/concept I designed to identify key price levels based on volume activity. It shows (on the price label on the y-axis) where there was the most (red) and the least (blue) volume over a specified lookback period. Read below for interpretation.
Key Features:
Identifies key price levels based on volume
Customizable lookback period and trade timeframe
Plots Volume Point of Control (VPOC) and Volume Point of No Control (VPONC)
Inputs and Calculations:
Custom Trade Timeframe: Allows users to set the desired timeframe for analysis (e.g., Daily, Weekly).
Lookback Period: Users can specify the period over which to analyze volume data.
VPOC Calculation: Determines the price level with the highest volume within the lookback period.
VPONC Calculation: Finds the price level with the lowest volume within the lookback period.
Indicator Usage:
The VPOC is considered a significant level where traders have shown the most interest, often acting as a strong support or resistance level. The VPONC, conversely, is a concept I made up. It represents a price level where 1) in an trending market, this price was accepted quickly, thus suggesting continuation of an trend. 2) price retracements will typically revisit thinly-traded price areas, the VPONC can sometimes signal an area of support in a downtrend.
Chart Representation:
VPOC Label: Plotted on the y-axis in red, indicating the price level with the highest volume.
VPONC Label: Displayed on the y-axis in blue, showing the price level with the least volume.
These labels are dynamically updated based on the user-specified lookback period and trade timeframe.
Volume 20% Above 100-day Avg & Below 200-day MAThis custom indicator is designed to assist cryptocurrency traders in identifying potential trading opportunities based on volume and moving average analysis. It highlights tokens that meet specific criteria, helping users to gauge potential market strength and reversals.
Features:
Volume Above 100-day Average: The indicator plots the 100-day volume average on the chart (blue line) and displays the percentage change in volume from the average (gray line). Green columns indicate volumes that are 20% or more above the 100-day average.
Below 200-day Moving Average: The indicator calculates and plots the 200-day moving average (orange line) of the token's closing price. This moving average acts as a long-term trend reference.
Market Conditions Highlighting: When the token's volume is above the 100-day average and the closing price is below the 200-day moving average, the indicator highlights the bars in the chart with a transparent red color. This condition can be indicative of potential reversal opportunities.
How to Use:
Volume Strength: Observe the green columns on the chart, which indicate periods of higher-than-average volume. These spikes can suggest increased market interest and potential price movements.
Long-Term Trend: Monitor the position of the closing price concerning the 200-day moving average. Prices below the moving average suggest a potential downtrend, while prices above the moving average imply a potential uptrend.
Reversal Opportunities: Focus on bars highlighted with a transparent red color. These are instances when the token's volume is above the 100-day average, while the closing price is below the 200-day moving average. Such situations may indicate potential reversal points.
Please note that this indicator should not be used in isolation for trading decisions. It is essential to combine it with other technical and fundamental analysis tools to form a comprehensive trading strategy.
Remember to backtest this indicator on historical data and adjust the input parameters to suit your trading preferences and risk tolerance.
Disclaimer: Trading cryptocurrencies involves significant risk, and past performance does not guarantee future results. Always exercise caution and perform your research before making any trading decisions.

Volume Spike Scanner█ OVERVIEW
This script adds a volume spike scanner table to the top-right of the chart space. Table cells light up with colored signals when volume spikes occur on the associated tickers on a low timeframe. The colored signals correspond to different levels of volume spike intensity and the table columns are continuously sorted so that the tickers with the most intense volume spikes are always at the top. One table can have up to 40 tickers (this is a pine script limitation) and the indicator comes with 7 pre-load ticker lists. (6 stock lists and 1 crypto list) Add the indicator several times and use all the pre-load lists to scan 280 stocks and 40 cryptocurrencies simultaneously.
By monitoring so many tickers simultaneously for volume spikes you will have early awareness of tickers that are reacting to catalysts/news. In some cases there may be no known catalyst, but the ticker is still making a significant move with high volume. Getting to these charts early in the move can provide trade-able opportunities.
█ SIGNALS
There are 6 signals for increasing levels of volume spike intensity
Orange - Most Intense
Yellow
Green
Light Green
Blue
Pink - Least Intense
█ USER INPUTS
Alerts
Check the boxes in the Alerts section next to the color signals you want alerts for. Then after closing the user inputs pane right-click on the table and select "Add Alert on ..."
Filters
Currently the only filter available is the Minimum Volume Filter. More filters may be added on future updates.
When this filter is turned on any signals that are generated by a spike that has volume below the set value will be filtered out and will not show up on the scanner.
The default value of 10,000 is recommended for stocks. There is no recommendation for crypto.
Positioning
• Compact Mode - Reduces the table width to about half size to conserve screen space.
• Table Number - Table number 1 is the farthest right position. Each increase in this value by 1 will move the table roughly one table space inward from the right side of the chart.
• Move Down - Each increment of 1 will move the table downward roughly the height of one table row.
Usually the lowest rows of the table are insignificant so it's okay to move the table down and have these rows offscreen.
• Left/Right Spacing - Each increment of 1 or -1 will move the table slightly left and right respectively. This is for fine tuning the left/right positioning if you like all your tables equally spaced.
Ticker Lists
• Pre-Built List # - The first release of this script contains seven pre-built lists each containing 40 tickers. Lists 1 thru 6 are all stocks. List 7 is all crypto.
For day trading stocks and options add the indicator 6 times to the chart, set the tables side by side, and set a different pre-built list number for each table.
• Symbol Lists - The pre-built lists can all be customized to your preference. Remove tickers you don't like and replace with ones you like. Save your lists as the new default.
Also not every table has to contain 40 tickers. You can uncheck the boxes next to the tickers to shorten the list.
█ TIPS
General
1 — Use news alert/notification services to add context to volume spikes and resulting price movements.
2 — When a ticker goes straight to the highest two signals (Orange and Yellow) that is usually noteworthy
and worth looking at the ticker's chart to see how the volume inflow is affecting price.
3 — When the lowest signals (Pink and Blue) appear for a ticker that is often not noteworthy except in the most liquid tickers
4 — It is best to use a multi-chart layout with one chart in the layout dedicated to the scanner.
This will allow you to switch tickers on the other charts without re-rendering the tables each time.
Set the chart dedicated to the scanner to the 3m timeframe or lower due to an issue mentioned lower down.
To make the scanner easier to see you can turn off visibility of all chart features on this chart.
Stocks
1 — Very liquid stocks such as AAPL, AMZN, MSFT, TSLA, NVDA, NFLX, BA, GOOGL, META, etc. rarely have volume spikes that give the highest signals (Orange and Yellow).
For these tickers the lower signals are significant. To prevent them from getting lost at the bottom of a 40 ticker table you can give them their own dedicated table
along with other favorite stocks to ensure they are always easily visible. You can set alerts for the lower level signals on this table.
2 — To use all 6 pre-loaded stock lists and scan 240 stocks simultaneously add the indicator 6 times.
Each time you add the indicator customize the user incrementing the Table Number and Pre-Load List #. This will give you 6 tables side-by-side with 40 tickers each.
3 — The Minimum Volume Filter is recommended to be set on and at the default value for the stock pre-load lists.
Crypto
1 — The Minimum Volume Filter is recommended to be set off for the crypto list.
2 — Use mobile app notifications to get 24/7 crypto volume spike alerts to your phone.
█ KNOWN ISSUES
Alerts are sometimes given more than once for the same volume spike signal.
The table does not display when using higher timeframes. It is recommended to use a split chart layout and dedicate one section of the layout to this indicator. Set the timeframe on this section to 3m or lower.
If fixes are found for the above issues they will be included in future updates.
█ SPECIAL THANKS
With permission this script utilizes some of the logic from the open-source script "Screener for 40+ instruments" by QuantNomad.

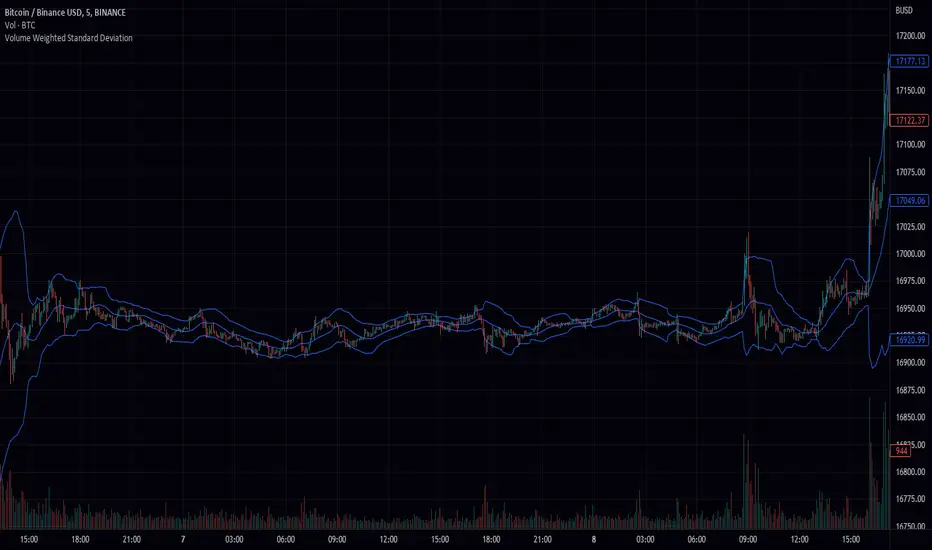
Volume Weighted Standard Deviation (VWSD)The Volume Weighted Standard Deviation indicator is a custom technical analysis tool that uses the volume of trading to calculate the standard deviation of a stock's price. This indicator takes the source of data, the length of data, and the deviation as inputs, and calculates the volume weighted standard deviation using the values.
The indicator first calculates the mean price and mean volume by using simple moving average over the given length of data. Then it calculates the squared difference between the mean price and the actual price, multiplied by the volume. This gives a volume-weighted squared difference. The indicator then calculates the square root of the sum of the volume-weighted squared differences divided by the sum of the volumes over the given length of data. This gives the volume weighted standard deviation.
The indicator then plots the standard deviation and deviation as a band around the simple moving average of the source data, providing a clear view of the volatility of the stock.
In summary, the Volume Weighted Standard Deviation indicator is a powerful tool for measuring the volatility of a stock by taking into account the volume of trading. It uses the volume of trading to calculate the standard deviation of a stock's price, giving a more accurate representation of the volatility of the stock. It can be useful for traders to identify entry and exit points and make more informed trading decisions.
Volume CVD and Open Interest HeatmapTaking Volume and Open Interest data to the next level of visualization I created a 'heatmap'. The indicator uses a colour gradient and plots boxes from the source candle to the current candle with one of the following data sources:
- Volume - the total volume of transactions, buys and sells
- Up Volume - the total volume from buys only
- Down Volume - the total volume from sells only
- Up/Down Volume (Net) - the difference in the Buy Volume and Sell Volume
- Cumulative Delta - the sum of the up/down volume for the previous 14 bars
- Cumulative Delta EMA - a smoothed average of the sum of the up/down volume for the previous 14 bars, over a 14 period EMA
- Open Interest - a user defined ticker, whose value is added to the plot, while this is designed to be used with Open Interest tickers, you can actually choose any ticker you want, perhaps you want to see DXY while charting Bitcoin!
You can define the lookback period, though you should make sure your timeframe for volume source data, is high enough to accommodate the lookback. TradingView will only fetch 5000 candles worth of data, so at 1 min volume data, you can only lookback 83 hours.
While similar, Volume and Open Interest are not the same. To me the simplest explanation is Volume shows the trades that have been executed and the buy/sell direction, while Open Interest shows the value of open trades that are yet to be completed.
Volume shows strength, sentiment and volatility .
Open Interest does not show direction, but does indicate momentum and liquidity in the market.
With this novel way of visualizing these, you can also now determine where all that liquidity and positions came from and therefore might have resting liquidity below.

Volume Pace & Pressure TableHave you ever wanted to know if a particular tickers volume is above or below average while still in the trading day? This indicator displays an easy-to-read table that informs the user exactly what is occurring in intraday volume. And a whole lot more!
Description
This indicator displays a variable table with either two or three columns and always three rows. It packs everything a user needs to know about volume in one small table. The table shows:
Current trading days volume
Average daily volume
Volume Pace
Volume Pressure (Buying & Selling)
Volume Pace
Volume Pace is a mathematical calculation invented by the author, Infinity_Trading . The problem was to figure out a way to know if the current days volume was below average or above average while still in the trading day. Calculations like Percent Daily Volume don’t work during the intraday trading hours. For example, say SPY has a 20-day volume average of 100 million shares. If in the first hour SPY has only traded 10 million shares then dividing the current volume into the average daily volume doesn’t tell the user anything when there is still 5.5 hours of trading left in the trading day. There had to be a better way! The solution was to chop up the trading day into evenly divisible time periods (i.e. <= 30 minutes). The Volume Pace algorithm takes the average daily volume and chops it up into small time periods based upon the charts current timeframe. This is the average volume per smaller time period. Then use the current days volume and the number of time periods that have occurred in the trading day so far (at the current moment in time i.e. the current candlestick) to form a calculation that returns the volume above or below the average volume up to that point in time.
Volume Pace Equations
Intraday Vol. Pace = Today’s Current Vol. - ( ( Average Daily Vol. / Time periods in trading day ) * Time periods that have occurred so far in trading day )
Postday Vol. Pace = Today’s Trading Vol. - Average Daily Vol.
^ Vol. = Volume (because TradingViews pine tags are dumb)
Volume Pace Definitions
Volume Pace is the difference in cumulative volume between todays current volume and the average daily volume up to same time of the day
Volume Pace Usage
If the Volume Pace is a positive number then it means that up to the current trading time the volume is that amount greater than the average daily volume over that same intraday time span.
If the Volume Pace is a negative number then it means that up to the current trading time the volume is that amount smaller than the average daily volume over that same intraday time span.
If the Volume Pace is positive during the intraday then the volume is on track to be an above average volume trading day.
If the Volume Pace is negative during the intraday then the volume is on track to be a below average volume trading day.
The Percent Volume Pace is the percent increase or decrease of the current volume compared to the average volume up to the same time of day. Or the Percent Volume Pace is the Volume Pace expressed as a percentage.
After the trading day is complete the Volume Pace will be the difference between the Daily Volume and the Average Daily Volume. And the same thing applies to the Percent Volume Pace.
Volume Pressure
The author, Infinity_Trading, did not invent the calculations for Volume Pressure but the definitions and explanations of Volume Pressure are their own creations. In specific terms, Volume Pressure is a mathematical calculation that uses the direction and distances of individual candlesticks bodies and wicks to assign a numerical value to volume.
buyingPressure = vol * (close - low) / (high - low)
sellingPressure = vol * (high - close) / (high - low)
^ vol = Volume (because TradingViews pine tags are dumb)
The author wants to make clear that volume “pressure” isn’t a real thing. Trades in any market require a buyer and a seller. So there is always an equal number of buyers and sellers. Thus, the idea that there are more buyers or more sellers isn’t rooted in reality. BUT the author believes that the calculation and understanding of “volume pressure” takes a very complex subject (price moment in a market) and condenses into something that intuitively makes sense to humans (pressure) and places it onto something that is already on everyone’s charts (volume bars).
The calculation for Buying Pressure is really calculating the upward distance between the low and the close of the candle. While Selling Pressure is measuring the downward distance from the high to the close. And both are using volume bars to express these measurements. So if an individual candle goes down then the red Selling Pressure will be more on the stacked bar chart than the green Buying Pressure. And vice versa for candles that went up. If a Volume Pressure bar is completely one color then it means, for a downward candle, the low and close were equivalent, and for an upward candle, the high and the close were the same. Lastly, the Buying & Selling Pressure will always add up to 100%.
Inputs and Style
In the Input section the user can set the number of days to use for all of the average calculations. All aspects of the table can be controlled. The background color, text color, border widths, and border colors. Also, the table can be moved to 9 unique locations around the chart for complete user control. Also, the user can use their cursor to hover over each cell in the table to reveal a tooltip definition of the calculation in the cell.
Special Notes
The volume table won’t display when the chart timeframe is weekly or monthly because the logic uses “daily” volume.
The Volume Pace column in the table disappears when the timeframe is greater than 30 minutes. Because for Volume Pace to work the time periods must be equally divisible into 6.5 hours (the duration of trading day).

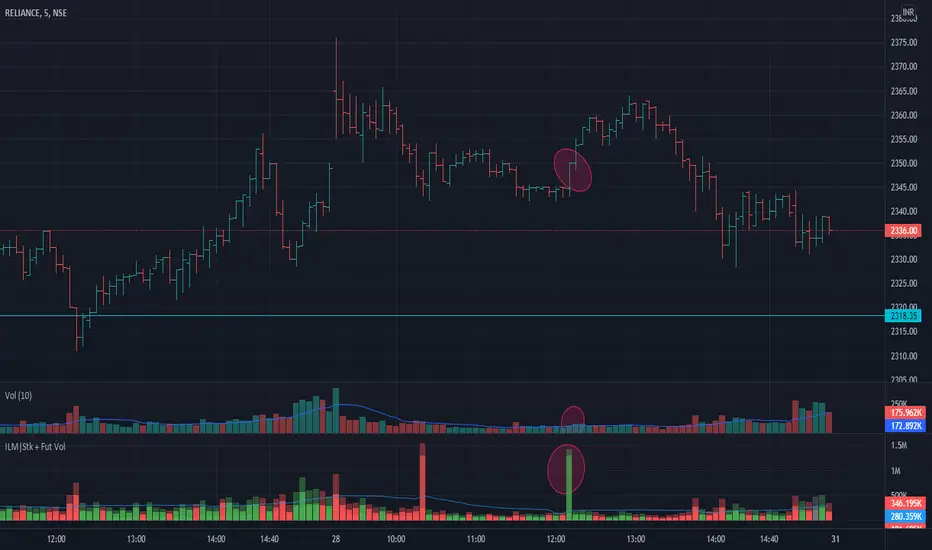
Volume Indicator NSE + BSE + Future Current & Next MonthThis indicator combines all the volumes from both the NSE & BSE exchanges as well as Future volumes ( Current Month & Next Month) if the symbol is available in FnO
Indicator shows 3 volumes
Total Volume = NSE + BSE + Current Month + Next Month
Stock Volume = NSE + BSE
Future volume = Current Month + Next Month
Benefits
As shown in the chart above, price shot up as the volume appeared in BSE but not NSE. These conditions can be caught easily and right decisions can be made
Since Future volumes are also combined, it gives an accurate picture of volumes on any given instrument during last of week of monthly expiries when contract rollovers happen
Volume Average % Cross - ChartVolume Average Percentage Cross Indicator - Chart
This version is specialized for notifications on your chart. If you wish to see notifications on your volume bars please choose "Volume Average Percentage Cross Indicator - Default".
What is the Volume Average % Cross - Chart Indicator you might ask yourself - what is it for?
I will tell you!
Use Case:
In my Indicator you have an Input to set the period for the volume average period.
Once the volume average period is calculated it is now necessary to choose the percentage value.
What is the percentage value?
The percentage value multiplies the past volume bar with a positive percentage value and a negative percentage value. I give this calculation the name "VolPercentage".
If the volume average is below the negative VolPercentage Value it means that the last volume bar is stronger than the volume average period by the percentage you set the percentage value input at.
If the volume average is above the positive VolPercentage Value it means that the last volume bar is weaker than the volume average period by the percentage you set the percentage value input at.
That means that if for example the percentage value would be 20 it would require the volume average to be 20% above the past volume bar.
That means that if for example the percentage value would be 20 it would require the volume average to be 20% lower than the past volume bar.
Once I uploaded my 100 Indicators I will accurately describe each indicator with videos, this will be huge!
Interpretation:
Volume is the amount of market participants who bought in a candlestick bar a set amount of shares at varying prices from within the bar itself.
If volume decreases it means that there has been fewer market participants and if it increases it means that there is an increase of market participants.
If this is used with candlestick patterns it helps tremendously to identify strong or weak doji candlesticks.
