ZigZag Levels (Polytrends Method)Overview
This is a comprehensive technical analysis indicator that identifies price trends, support/resistance levels, and containment patterns on trading charts. It uses advanced zigzag analysis to detect trend reversals and automatically draws key levels that traders can use for decision-making.
Key Features
Trend Analysis
Zigzag Pattern Detection: Automatically identifies significant highs and lows to create a clean trend visualization
Multi-Timeframe Support: Analyze trends from any timeframe while viewing on your preferred chart timeframe
Trend Direction Alerts: Real-time notifications when trend direction changes
Support & Resistance Levels
Automatic Level Detection: Identifies key horizontal support and resistance levels based on historical price action
Smart Level Filtering: Option to show only the most relevant levels to avoid chart clutter
Customizable Level Count: Control how many support and resistance levels are displayed
Containment Analysis
Range-Bound Detection: Highlights when price is trading within defined boundaries
Visual Containment Alerts: Color-coded system to show when price breaks out of or remains within established ranges
How to Use
Getting Started
Add the Indicator: Apply Polytrends Free to your chart from the indicators menu
Configure Basic Settings: Start with the main toggle switches to enable the features you want
Customize Appearance: Adjust colors, line styles, and sizes to match your chart preferences
Essential Settings
Trend Display
Display Trend: Master toggle to show/hide all trend analysis elements
Target Time Frame: Select which timeframe to use for trend analysis (leave blank for chart timeframe)
Containment: Enable to highlight when price is contained within previous ranges
Level Settings
Enable Levels: Master toggle for support/resistance level display
Above/Below: Set how many resistance levels (above price) and support levels (below price) to show
Filter Levels: When enabled, shows only the most significant levels without intermediary ones
Max Levels: Maximum number of levels the indicator will track (reduce if experiencing performance issues)
Understanding the Visual Elements
Trend Lines
Yellow Lines: Current active trend connections
Red Lines: Contained price action (when containment is enabled)
Dotted Lines: Most recent trend segment
Support & Resistance Levels
Horizontal Lines: Key price levels where price has previously reacted
Price Labels: Exact price values displayed on the right side of levels (when enabled)
Timeframe Labels: Shows which timeframe generated each level (when enabled)
Advanced Configuration
Visual Customization
Line Styles: Choose between solid, dashed, or dotted lines for trends and levels
Line Width: Adjust thickness from 1-50 pixels
Colors: Customize colors for different trend states and level types
Label Sizes: Set font size for price and timeframe labels
Performance Optimization
Relevance Factor: Controls how far back the indicator looks for levels (higher values = more historical data)
Max Levels: Limit the total number of levels tracked to improve performance
Price Offset: Adjust horizontal position of price labels
Practical Applications
For Day Traders
Use lower timeframes (15m, 1H) for intraday support/resistance levels
Enable containment detection to identify breakout opportunities
Set alerts for trend direction changes
For Swing Traders
Analyze daily or 4-hour timeframes for major trend direction
Focus on key support/resistance levels for entry and exit points
Use level filtering to see only the most significant price levels
For Position Traders
Use weekly or monthly timeframes for long-term trend analysis
Identify major support/resistance zones for portfolio allocation decisions
Monitor containment patterns for market structure changes
Alert System
The indicator provides three types of alerts:
Direction Changed: Triggers when trend direction changes (either bullish to bearish or vice versa)
Bullish Direction: Specifically triggers when trend changes from bearish to bullish
Bearish Direction: Specifically triggers when trend changes from bullish to bearish
To set up alerts, use TradingView's alert system and select the appropriate Polytrends alert condition.
Best Practices
Setup Recommendations
Start with default settings and gradually customize based on your trading style
Use higher timeframes for trend direction and lower timeframes for precise entries
Enable containment analysis during ranging markets
Reduce max levels if chart becomes cluttered
Interpretation Tips
Treat support/resistance levels as zones rather than exact prices
Look for confluence between multiple timeframe levels
Use containment patterns to identify potential breakout setups
Confirm trend changes with other technical indicators
Troubleshooting
Performance Issues
Reduce the "Max Levels" setting
Lower the "Relevance Factor"
Disable features you're not actively using
Too Many/Few Levels
Adjust "Above" and "Below" settings to control level quantity
Use "Filter Levels" to show only the most significant levels
Modify "Relevance Factor" to change how far back the indicator looks
Visual Clarity
Adjust line width and colors for better visibility
Use different line styles to distinguish between trend types
Modify label sizes based on your screen resolution
Limitations
The indicator works best on liquid markets with clear trend patterns
Very choppy or low-volume markets may produce less reliable signals
Performance may be affected on lower-end devices with very high "Max Levels" settings
Historical levels are based on past price action and don't predict future movements
Komut dosyalarını "track" için ara

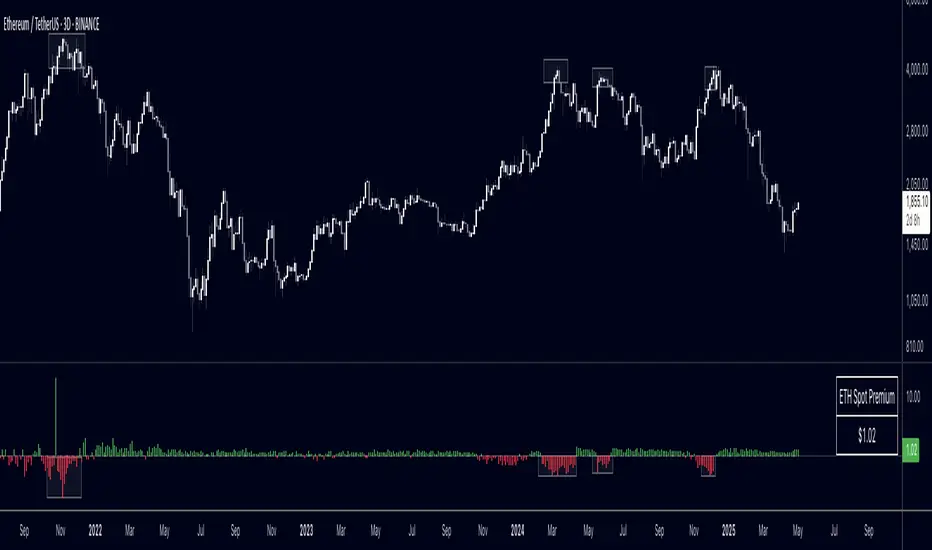
Spot Vs Perp PremiumThis indicator visualizes the price premium or discount between spot and perpetual futures markets for any crypto asset, using data from Binance, OKX, and Bybit. It helps traders track sentiment shifts, uncover arbitrage signals, and identify potential short-term reversals or continuation moves based on how aggressively traders are positioned in derivatives relative to the spot market.
What It Does
- Calculates the premium:
The difference between spot price and perp price is shown as a histogram. A positive premium (spot > perp) suggests cautious or bearish perp traders, while a negative premium (perp > spot) may indicate aggressive long positioning or speculative activity.
Supports multiple venues:
You can toggle between Binance, OKX, Bybit, or view a 3-exchange average for a more smoothed view.
Automatic pair detection:
The script auto-detects the base and quote currency from your active chart, dynamically tracking the correct spot and perp contracts for the asset you're analyzing.
Invert option:
Flip the calculation to view the perp premium instead of the spot premium, useful for comparing directional funding bias or for personal preference in visual analysis.
Optional moving average:
Smooth the premium signal over time to track sustained shifts in sentiment and filter out noise.
Table display:
Displays the real-time premium value in the corner of the chart for clarity.
Why It's Useful
This tool gives insight into derivatives trader behavior vs real market pricing. Spot prices reflect actual buying/selling of assets, while perpetual futures are often driven by speculation, leverage, and short-term positioning. When these diverge significantly, it often precedes market inflection points:
- Perp trading above spot (negative premium): excessive long exposure, potential for mean reversion or liquidations.
- Perp trading below spot (positive premium): risk-off behavior or hedging, potential for squeeze or unwind.
You can use this indicator to:
- Anticipate liquidation-driven moves
- Spot early signs of trend exhaustion
- Confirm breakout strength with perp alignment
- Monitor crowd positioning in real-time
Inputs
- Exchange – Select from Binance, OKX, Bybit, or average all three
- Inverse Premium – Flip the calculation to see perp - spot instead
- Show MA – Overlay a moving average for premium smoothing
- Show Table – Toggle live premium table display
- MA Period – Customize the smoothing window
Enjoy! Please comment and like!
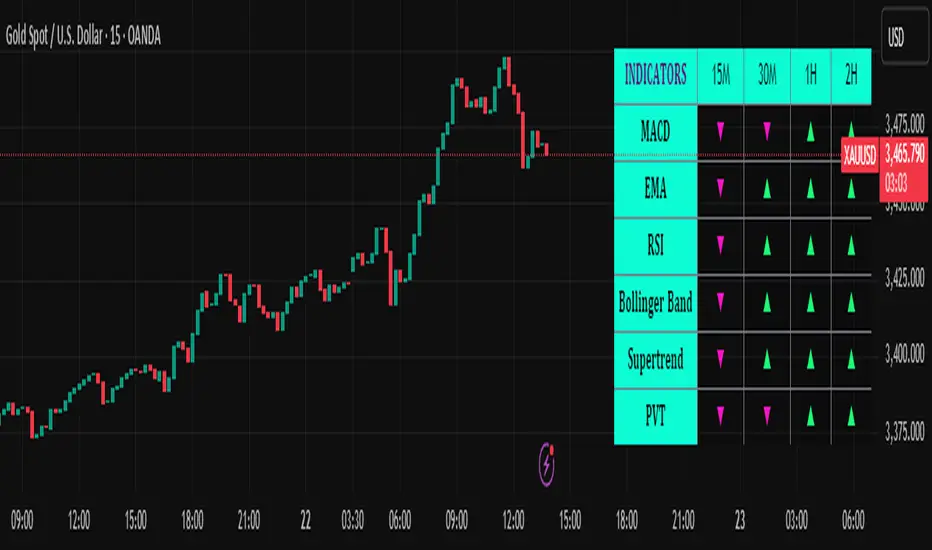
Trend Matrix Multi-Timeframe Dashboard(TechnoBlooms)Trend Matrix Multi-Timeframe Dashboard is a Minimalist Multi-Timeframe Trend Analyzer with Smart Indicator Integration. Trend Matrix MTF Dashboard is a clean, efficient, and visually intuitive trend analyzer built for traders who value simplicity without compromising on technical depth.
This dashboard empowers you to track trend direction across multiple timeframes using a curated set of powerful technical indicators—all from one compact visual panel. The design philosophy is simple: eliminate clutter, highlight trend clarity, and accelerate your decision-making process.
Key Features
✅ Minimalist Design with Maximum Insight
A compact dashboard view designed for clean charts and focused trading
Optimized layout shows everything you need—nothing you don’t
✅ Multi-Timeframe Access at a Glance
Instantly read the trend direction of selected indicators on multiple timeframes (e.g., 15m, 1h, 4h, 1D)
Customize the timeframe stack to fit scalping, intraday, swing, or positional strategies
✅ Robust Technical Indicators Built In
Each one is hand-picked for trend reliability:
MACD – Momentum and crossover confirmation
RSI – Overbought/oversold and directional shift
EMA – Dynamic support/resistance and trend bias
Bollinger Bands – Volatility structure and trend containment
PVT – Volume-Weighted Trend Confirmation
Supertrend – Price-following trend tracker
✅ Live Updates & Lightweight Performance
Built to update efficiently on every bar close
Minimal performance impact even with multiple timeframes active
By offering multi-timeframe (MTF) access to proven trend-following indicators, Trend Matrix helps you confidently align with the market’s dominant direction—without jumping between charts or analyzing indicators one by one.
This indicator offers customizable settings. The trader can choose the input parameters timeframes as per the choice.
Trend Matrix Multi-Timeframe Dashboard helps traders to identify trend based on technical indications. Trader can refer this while taking trading decisions.
🧠 Ideal For
Scalpers who need higher timeframe confirmation
Swing traders identifying clean entries aligned with the macro trend
Trend followers seeking clarity before committing capital
Price action & SMC traders validating market structure setups
Beginners who want a high-level trend guide without messy indicators
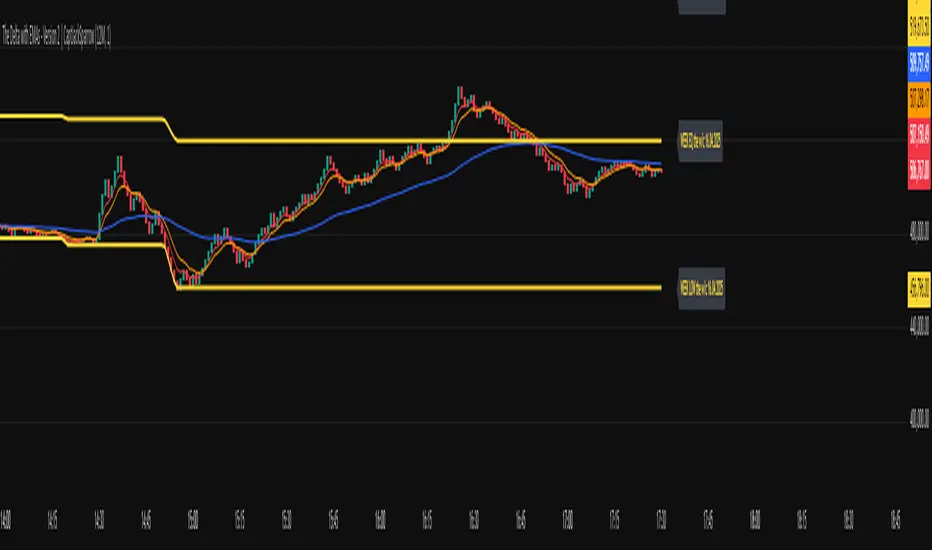
The Delta with EMAs - Version 2 | CaptJackSparrow📊 The Delta with EMAs - Version 2 16th April 25 working copy it is not finished yet!!!!!!!| CaptJackSparrow
This updated script takes your trading to the next level by merging dynamic volume delta with customizable EMAs and Fibonacci levels, all enhanced with session-based background highlights.
🧩 Cumulative Volume Delta (CVD):
Visualize market sentiment and volume flow with step-line candles, showing the tug-of-war between buyers and sellers.
Real-time tracking of volume dynamics with customizable timeframes and session-specific calculations.
📈 Exponential Moving Averages (EMAs):
EMAs (3, 5, 8, 9, 15, 24, 30, 60, 90) plotted on CVD to reveal trend direction and momentum shifts.
Customizable visibility settings for each EMA, with background coloring when the EMAs align to highlight momentum zones.
📊 Fibonacci Levels:
Overnight and New York sessions: Track the high, low, and midpoint (equilibrium) for each session to gauge market sentiment.
Weekly Fibonacci: See the high, low, and midpoint for the week, with dynamic labels updating as the week progresses.
🌍 Session Highlights:
Display colored backgrounds for New York, Overnight, Europe, Asia, and After Hours sessions, helping you identify active market periods.
Customizable start/end times for each session with visual color options.
🔔 Alerts & Visuals:
EMA crossovers and background colors help spot key momentum shifts.
Tailored alerts based on the crossover of the EMAs, helping you track potential entries or exits.
🧠 Ideal for traders who love:
Understanding market structure through volume analysis.
Using multiple session contexts for more precise trading decisions.
Anticipating breakouts or divergences with dynamic Fibonacci and EMA support.
🏴☠️ Disclaimer: This script is for educational purposes only and is not financial advice. Always trade responsibly and consider market risks.
Gabriel's Crypto Cycle Master [Multi-Asset]🧠 Gabriel's Crypto Cycle Master
Gabriel’s Crypto Cycle Master is a comprehensive macro valuation tool designed to identify long-term accumulation and distribution zones for any crypto asset using custom on-chain and price-based models.
🔹 Fully Multi-Asset Support
Manually input full tickers from COINMETRICS, GLASSNODE, or INDEX to track:
Realized Market Cap
On-chain Supply
Total Transaction Volume
USD-denominated Price
🔹 Core Metrics Modeled
This script computes major macroeconomic valuation layers based on widely researched concepts:
Realized Price – Network's cost basis
Top Cap – 35× average historical cap
Delta Top – Gap between Realized Price and Average Cap
CVDD – Cumulative Value Days Destroyed
Terminal Price – Network floor based on age and velocity
Balanced Price – Realized minus Terminal (via regression)
🔹 Advanced Bands for Over/Undervaluation
Around Realized Price, this tool dynamically plots:
Golden Ratio Band (×φ) — "Warm Zone" undervaluation
Euler's e Band (×e) — "Caution Zone" deeper value
Pi Band (×π) — "Overheated" zone when crossed upward
🔹 Built-in Alerts
Alerts fire when:
Price crosses below or above any band
Price drops under Terminal Price
Price recovers above the network floor
🔹 Ideal For
Long-term crypto cycle investors
On-chain analysts
DCA accumulation and distribution timing
Macro-level Bitcoin or ETH valuation zones
⚙️ Setup
Manually enter tickers for Market Cap, Supply, Volume, and Price for your preferred crypto asset.
Adjust CVDD cap (21M for BTC, ~120M for ETH) if analyzing a different coin.
Enable/disable specific valuation layers and alert bands via checkboxes.
Built by OneWallStreetQuant | Dynamic adaptation by Gabriel
Published for educational and cycle analysis use — not financial advice.
Ideal for Daily Charts, since the estimate formula was created on that timeframe.

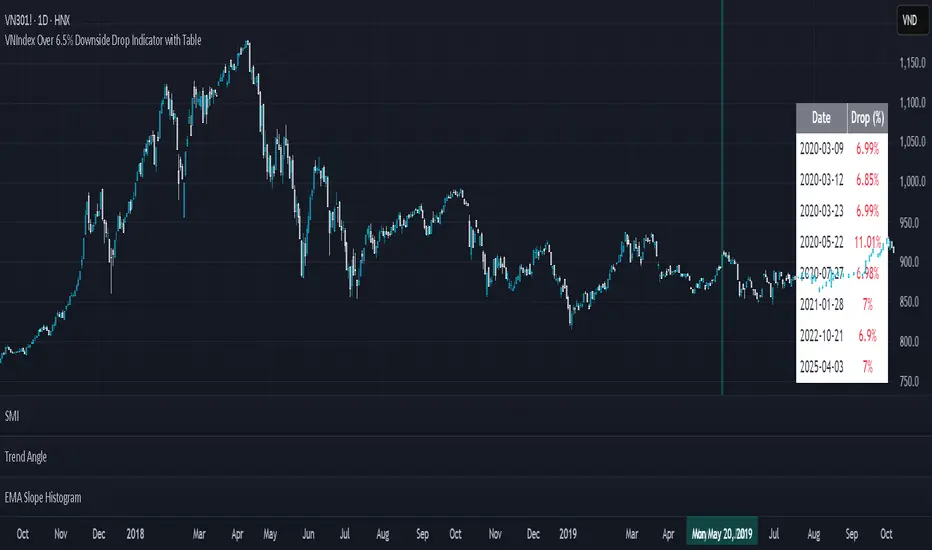
VNIndex Over 6.5% Downside Drop Indicator with TableOverview: The VNIndex 6.5% Downside Drop Indicator is a powerful tool designed to help traders and investors identify significant market drops on the VNIndex (or any other asset) based on a 6.5% downside threshold. This Pine Script® indicator automatically detects when the price of an asset drops by more than 6.5% within a single day, and visually marks those events on the chart.
Key Features:
6.5% Downside Drop Detection: Automatically calculates the daily percentage drop and identifies when the price falls by more than 6.5%.
Table Display: Displays the dates and corresponding percentage drops of all identified instances in a convenient table at the bottom right of the chart.
Markers: Red down-pointing markers are plotted above bars where the price drop exceeds the 6.5% threshold, making it easy to spot critical drop events at a glance.
Easy-to-Read Table: The table lists the date and drop percentage, updating dynamically as new drops are detected. This allows for easy tracking of significant downside moves over time.
How to Use:
Install the Script: Add this indicator to your TradingView chart.
Monitor Price Drops: The indicator will automatically detect when the price drops by over 6.5% from the previous close and display a marker on the chart and the table in the bottom right corner.
View the Table: The table displays the date and the percentage drop of each detected event, making it easy to track past significant moves.
Alerts: You can set an alert for 6.5% drops to receive notifications in real-time.
Customization Options:
The drop percentage threshold (6.5%) can be adjusted in the script to fit other market conditions or assets.
The table can be resized or styled based on user preference for better visibility.
Why Use This Indicator? This indicator is perfect for traders looking to spot large, significant price movements quickly. Large downside drops can signal potential market reversals or trading opportunities, and this tool helps you track such events effortlessly. Whether you're monitoring the VNIndex or any other asset, this indicator provides crucial insights into volatile price action, helping you make more informed decisions.
Open Source License: This indicator is open source and free to use under the Mozilla Public License 2.0. You are welcome to modify, distribute, and contribute to the project.
Contributions: Feel free to contribute improvements, fixes, or new features by creating a pull request. Let’s collaborate to make this indicator even better for the community!
real_time_candlesIntroduction
The Real-Time Candles Library provides comprehensive tools for creating, manipulating, and visualizing custom timeframe candles in Pine Script. Unlike standard indicators that only update at bar close, this library enables real-time visualization of price action and indicators within the current bar, offering traders unprecedented insight into market dynamics as they unfold.
This library addresses a fundamental limitation in traditional technical analysis: the inability to see how indicators evolve between bar closes. By implementing sophisticated real-time data processing techniques, traders can now observe indicator movements, divergences, and trend changes as they develop, potentially identifying trading opportunities much earlier than with conventional approaches.
Key Features
The library supports two primary candle generation approaches:
Chart-Time Candles: Generate real-time OHLC data for any variable (like RSI, MACD, etc.) while maintaining synchronization with chart bars.
Custom Timeframe (CTF) Candles: Create candles with custom time intervals or tick counts completely independent of the chart's native timeframe.
Both approaches support traditional candlestick and Heikin-Ashi visualization styles, with options for moving average overlays to smooth the data.
Configuration Requirements
For optimal performance with this library:
Set max_bars_back = 5000 in your script settings
When using CTF drawing functions, set max_lines_count = 500, max_boxes_count = 500, and max_labels_count = 500
These settings ensure that you will be able to draw correctly and will avoid any runtime errors.
Usage Examples
Basic Chart-Time Candle Visualization
// Create real-time candles for RSI
float rsi = ta.rsi(close, 14)
Candle rsi_candle = candle_series(rsi, CandleType.candlestick)
// Plot the candles using Pine's built-in function
plotcandle(rsi_candle.Open, rsi_candle.High, rsi_candle.Low, rsi_candle.Close,
"RSI Candles", rsi_candle.candle_color, rsi_candle.candle_color)
Multiple Access Patterns
The library provides three ways to access candle data, accommodating different programming styles:
// 1. Array-based access for collection operations
Candle candles = candle_array(source)
// 2. Object-oriented access for single entity manipulation
Candle candle = candle_series(source)
float value = candle.source(Source.HLC3)
// 3. Tuple-based access for functional programming styles
= candle_tuple(source)
Custom Timeframe Examples
// Create 20-second candles with EMA overlay
plot_ctf_candles(
source = close,
candle_type = CandleType.candlestick,
sample_type = SampleType.Time,
number_of_seconds = 20,
timezone = -5,
tied_open = true,
ema_period = 9,
enable_ema = true
)
// Create tick-based candles (new candle every 15 ticks)
plot_ctf_tick_candles(
source = close,
candle_type = CandleType.heikin_ashi,
number_of_ticks = 15,
timezone = -5,
tied_open = true
)
Advanced Usage with Custom Visualization
// Get custom timeframe candles without automatic plotting
CandleCTF my_candles = ctf_candles_array(
source = close,
candle_type = CandleType.candlestick,
sample_type = SampleType.Time,
number_of_seconds = 30
)
// Apply custom logic to the candles
float ema_values = my_candles.ctf_ema(14)
// Draw candles and EMA using time-based coordinates
my_candles.draw_ctf_candles_time()
ema_values.draw_ctf_line_time(line_color = #FF6D00)
Library Components
Data Types
Candle: Structure representing chart-time candles with OHLC, polarity, and visualization properties
CandleCTF: Extended candle structure with additional time metadata for custom timeframes
TickData: Structure for individual price updates with time deltas
Enumerations
CandleType: Specifies visualization style (candlestick or Heikin-Ashi)
Source: Defines price components for calculations (Open, High, Low, Close, HL2, etc.)
SampleType: Sets sampling method (Time-based or Tick-based)
Core Functions
get_tick(): Captures current price as a tick data point
candle_array(): Creates an array of candles from price updates
candle_series(): Provides a single candle based on latest data
candle_tuple(): Returns OHLC values as a tuple
ctf_candles_array(): Creates custom timeframe candles without rendering
Visualization Functions
source(): Extracts specific price components from candles
candle_ctf_to_float(): Converts candle data to float arrays
ctf_ema(): Calculates exponential moving averages for candle arrays
draw_ctf_candles_time(): Renders candles using time coordinates
draw_ctf_candles_index(): Renders candles using bar index coordinates
draw_ctf_line_time(): Renders lines using time coordinates
draw_ctf_line_index(): Renders lines using bar index coordinates
Technical Implementation Notes
This library leverages Pine Script's varip variables for state management, creating a sophisticated real-time data processing system. The implementation includes:
Efficient tick capturing: Samples price at every execution, maintaining temporal tracking with time deltas
Smart state management: Uses a hybrid approach with mutable updates at index 0 and historical preservation at index 1+
Temporal synchronization: Manages two time domains (chart time and custom timeframe)
The tooltip implementation provides crucial temporal context for custom timeframe visualizations, allowing users to understand exactly when each candle formed regardless of chart timeframe.
Limitations
Custom timeframe candles cannot be backtested due to Pine Script's limitations with historical tick data
Real-time visualization is only available during live chart updates
Maximum history is constrained by Pine Script's array size limits
Applications
Indicator visualization: See how RSI, MACD, or other indicators evolve in real-time
Volume analysis: Create custom volume profiles independent of chart timeframe
Scalping strategies: Identify short-term patterns with precisely defined time windows
Volatility measurement: Track price movement characteristics within bars
Custom signal generation: Create entry/exit signals based on custom timeframe patterns
Conclusion
The Real-Time Candles Library bridges the gap between traditional technical analysis (based on discrete OHLC bars) and the continuous nature of market movement. By making indicators more responsive to real-time price action, it gives traders a significant edge in timing and decision-making, particularly in fast-moving markets where waiting for bar close could mean missing important opportunities.
Whether you're building custom indicators, researching price patterns, or developing trading strategies, this library provides the foundation for sophisticated real-time analysis in Pine Script.
Implementation Details & Advanced Guide
Core Implementation Concepts
The Real-Time Candles Library implements a sophisticated event-driven architecture within Pine Script's constraints. At its heart, the library creates what's essentially a reactive programming framework handling continuous data streams.
Tick Processing System
The foundation of the library is the get_tick() function, which captures price updates as they occur:
export get_tick(series float source = close, series float na_replace = na)=>
varip float price = na
varip int series_index = -1
varip int old_time = 0
varip int new_time = na
varip float time_delta = 0
// ...
This function:
Samples the current price
Calculates time elapsed since last update
Maintains a sequential index to track updates
The resulting TickData structure serves as the fundamental building block for all candle generation.
State Management Architecture
The library employs a sophisticated state management system using varip variables, which persist across executions within the same bar. This creates a hybrid programming paradigm that's different from standard Pine Script's bar-by-bar model.
For chart-time candles, the core state transition logic is:
// Real-time update of current candle
candle_data := Candle.new(Open, High, Low, Close, polarity, series_index, candle_color)
candles.set(0, candle_data)
// When a new bar starts, preserve the previous candle
if clear_state
candles.insert(1, candle_data)
price.clear()
// Reset state for new candle
Open := Close
price.push(Open)
series_index += 1
This pattern of updating index 0 in real-time while inserting completed candles at index 1 creates an elegant solution for maintaining both current state and historical data.
Custom Timeframe Implementation
The custom timeframe system manages its own time boundaries independent of chart bars:
bool clear_state = switch settings.sample_type
SampleType.Ticks => cumulative_series_idx >= settings.number_of_ticks
SampleType.Time => cumulative_time_delta >= settings.number_of_seconds
This dual-clock system synchronizes two time domains:
Pine's execution clock (bar-by-bar processing)
The custom timeframe clock (tick or time-based)
The library carefully handles temporal discontinuities, ensuring candle formation remains accurate despite irregular tick arrival or market gaps.
Advanced Usage Techniques
1. Creating Custom Indicators with Real-Time Candles
To develop indicators that process real-time data within the current bar:
// Get real-time candles for your data
Candle rsi_candles = candle_array(ta.rsi(close, 14))
// Calculate indicator values based on candle properties
float signal = ta.ema(rsi_candles.first().source(Source.Close), 9)
// Detect patterns that occur within the bar
bool divergence = close > close and rsi_candles.first().Close < rsi_candles.get(1).Close
2. Working with Custom Timeframes and Plotting
For maximum flexibility when visualizing custom timeframe data:
// Create custom timeframe candles
CandleCTF volume_candles = ctf_candles_array(
source = volume,
candle_type = CandleType.candlestick,
sample_type = SampleType.Time,
number_of_seconds = 60
)
// Convert specific candle properties to float arrays
float volume_closes = volume_candles.candle_ctf_to_float(Source.Close)
// Calculate derived values
float volume_ema = volume_candles.ctf_ema(14)
// Create custom visualization
volume_candles.draw_ctf_candles_time()
volume_ema.draw_ctf_line_time(line_color = color.orange)
3. Creating Hybrid Timeframe Analysis
One powerful application is comparing indicators across multiple timeframes:
// Standard chart timeframe RSI
float chart_rsi = ta.rsi(close, 14)
// Custom 5-second timeframe RSI
CandleCTF ctf_candles = ctf_candles_array(
source = close,
candle_type = CandleType.candlestick,
sample_type = SampleType.Time,
number_of_seconds = 5
)
float fast_rsi_array = ctf_candles.candle_ctf_to_float(Source.Close)
float fast_rsi = fast_rsi_array.first()
// Generate signals based on divergence between timeframes
bool entry_signal = chart_rsi < 30 and fast_rsi > fast_rsi_array.get(1)
Final Notes
This library represents an advanced implementation of real-time data processing within Pine Script's constraints. By creating a reactive programming framework for handling continuous data streams, it enables sophisticated analysis typically only available in dedicated trading platforms.
The design principles employed—including state management, temporal processing, and object-oriented architecture—can serve as patterns for other advanced Pine Script development beyond this specific application.
------------------------
Library "real_time_candles"
A comprehensive library for creating real-time candles with customizable timeframes and sampling methods.
Supports both chart-time and custom-time candles with options for candlestick and Heikin-Ashi visualization.
Allows for tick-based or time-based sampling with moving average overlay capabilities.
get_tick(source, na_replace)
Captures the current price as a tick data point
Parameters:
source (float) : Optional - Price source to sample (defaults to close)
na_replace (float) : Optional - Value to use when source is na
Returns: TickData structure containing price, time since last update, and sequential index
candle_array(source, candle_type, sync_start, bullish_color, bearish_color)
Creates an array of candles based on price updates
Parameters:
source (float) : Optional - Price source to sample (defaults to close)
candle_type (simple CandleType) : Optional - Type of candle chart to create (candlestick or Heikin-Ashi)
sync_start (simple bool) : Optional - Whether to synchronize with the start of a new bar
bullish_color (color) : Optional - Color for bullish candles
bearish_color (color) : Optional - Color for bearish candles
Returns: Array of Candle objects ordered with most recent at index 0
candle_series(source, candle_type, wait_for_sync, bullish_color, bearish_color)
Provides a single candle based on the latest price data
Parameters:
source (float) : Optional - Price source to sample (defaults to close)
candle_type (simple CandleType) : Optional - Type of candle chart to create (candlestick or Heikin-Ashi)
wait_for_sync (simple bool) : Optional - Whether to wait for a new bar before starting
bullish_color (color) : Optional - Color for bullish candles
bearish_color (color) : Optional - Color for bearish candles
Returns: A single Candle object representing the current state
candle_tuple(source, candle_type, wait_for_sync, bullish_color, bearish_color)
Provides candle data as a tuple of OHLC values
Parameters:
source (float) : Optional - Price source to sample (defaults to close)
candle_type (simple CandleType) : Optional - Type of candle chart to create (candlestick or Heikin-Ashi)
wait_for_sync (simple bool) : Optional - Whether to wait for a new bar before starting
bullish_color (color) : Optional - Color for bullish candles
bearish_color (color) : Optional - Color for bearish candles
Returns: Tuple representing current candle values
method source(self, source, na_replace)
Extracts a specific price component from a Candle
Namespace types: Candle
Parameters:
self (Candle)
source (series Source) : Type of price data to extract (Open, High, Low, Close, or composite values)
na_replace (float) : Optional - Value to use when source value is na
Returns: The requested price value from the candle
method source(self, source)
Extracts a specific price component from a CandleCTF
Namespace types: CandleCTF
Parameters:
self (CandleCTF)
source (simple Source) : Type of price data to extract (Open, High, Low, Close, or composite values)
Returns: The requested price value from the candle as a varip
method candle_ctf_to_float(self, source)
Converts a specific price component from each CandleCTF to a float array
Namespace types: array
Parameters:
self (array)
source (simple Source) : Optional - Type of price data to extract (defaults to Close)
Returns: Array of float values extracted from the candles, ordered with most recent at index 0
method ctf_ema(self, ema_period)
Calculates an Exponential Moving Average for a CandleCTF array
Namespace types: array
Parameters:
self (array)
ema_period (simple float) : Period for the EMA calculation
Returns: Array of float values representing the EMA of the candle data, ordered with most recent at index 0
method draw_ctf_candles_time(self, sample_type, number_of_ticks, number_of_seconds, timezone)
Renders custom timeframe candles using bar time coordinates
Namespace types: array
Parameters:
self (array)
sample_type (simple SampleType) : Optional - Method for sampling data (Time or Ticks), used for tooltips
number_of_ticks (simple int) : Optional - Number of ticks per candle (used when sample_type is Ticks), used for tooltips
number_of_seconds (simple float) : Optional - Time duration per candle in seconds (used when sample_type is Time), used for tooltips
timezone (simple int) : Optional - Timezone offset from UTC (-12 to +12), used for tooltips
Returns: void - Renders candles on the chart using time-based x-coordinates
method draw_ctf_candles_index(self, sample_type, number_of_ticks, number_of_seconds, timezone)
Renders custom timeframe candles using bar index coordinates
Namespace types: array
Parameters:
self (array)
sample_type (simple SampleType) : Optional - Method for sampling data (Time or Ticks), used for tooltips
number_of_ticks (simple int) : Optional - Number of ticks per candle (used when sample_type is Ticks), used for tooltips
number_of_seconds (simple float) : Optional - Time duration per candle in seconds (used when sample_type is Time), used for tooltips
timezone (simple int) : Optional - Timezone offset from UTC (-12 to +12), used for tooltips
Returns: void - Renders candles on the chart using index-based x-coordinates
method draw_ctf_line_time(self, source, line_size, line_color)
Renders a line representing a price component from the candles using time coordinates
Namespace types: array
Parameters:
self (array)
source (simple Source) : Optional - Type of price data to extract (defaults to Close)
line_size (simple int) : Optional - Width of the line
line_color (simple color) : Optional - Color of the line
Returns: void - Renders a connected line on the chart using time-based x-coordinates
method draw_ctf_line_time(self, line_size, line_color)
Renders a line from a varip float array using time coordinates
Namespace types: array
Parameters:
self (array)
line_size (simple int) : Optional - Width of the line, defaults to 2
line_color (simple color) : Optional - Color of the line
Returns: void - Renders a connected line on the chart using time-based x-coordinates
method draw_ctf_line_index(self, source, line_size, line_color)
Renders a line representing a price component from the candles using index coordinates
Namespace types: array
Parameters:
self (array)
source (simple Source) : Optional - Type of price data to extract (defaults to Close)
line_size (simple int) : Optional - Width of the line
line_color (simple color) : Optional - Color of the line
Returns: void - Renders a connected line on the chart using index-based x-coordinates
method draw_ctf_line_index(self, line_size, line_color)
Renders a line from a varip float array using index coordinates
Namespace types: array
Parameters:
self (array)
line_size (simple int) : Optional - Width of the line, defaults to 2
line_color (simple color) : Optional - Color of the line
Returns: void - Renders a connected line on the chart using index-based x-coordinates
plot_ctf_tick_candles(source, candle_type, number_of_ticks, timezone, tied_open, ema_period, bullish_color, bearish_color, line_width, ema_color, use_time_indexing)
Plots tick-based candles with moving average
Parameters:
source (float) : Input price source to sample
candle_type (simple CandleType) : Type of candle chart to display
number_of_ticks (simple int) : Number of ticks per candle
timezone (simple int) : Timezone offset from UTC (-12 to +12)
tied_open (simple bool) : Whether to tie open price to close of previous candle
ema_period (simple float) : Period for the exponential moving average
bullish_color (color) : Optional - Color for bullish candles
bearish_color (color) : Optional - Color for bearish candles
line_width (simple int) : Optional - Width of the moving average line, defaults to 2
ema_color (color) : Optional - Color of the moving average line
use_time_indexing (simple bool) : Optional - When true the function will plot with xloc.time, when false it will plot using xloc.bar_index
Returns: void - Creates visual candle chart with EMA overlay
plot_ctf_tick_candles(source, candle_type, number_of_ticks, timezone, tied_open, bullish_color, bearish_color, use_time_indexing)
Plots tick-based candles without moving average
Parameters:
source (float) : Input price source to sample
candle_type (simple CandleType) : Type of candle chart to display
number_of_ticks (simple int) : Number of ticks per candle
timezone (simple int) : Timezone offset from UTC (-12 to +12)
tied_open (simple bool) : Whether to tie open price to close of previous candle
bullish_color (color) : Optional - Color for bullish candles
bearish_color (color) : Optional - Color for bearish candles
use_time_indexing (simple bool) : Optional - When true the function will plot with xloc.time, when false it will plot using xloc.bar_index
Returns: void - Creates visual candle chart without moving average
plot_ctf_time_candles(source, candle_type, number_of_seconds, timezone, tied_open, ema_period, bullish_color, bearish_color, line_width, ema_color, use_time_indexing)
Plots time-based candles with moving average
Parameters:
source (float) : Input price source to sample
candle_type (simple CandleType) : Type of candle chart to display
number_of_seconds (simple float) : Time duration per candle in seconds
timezone (simple int) : Timezone offset from UTC (-12 to +12)
tied_open (simple bool) : Whether to tie open price to close of previous candle
ema_period (simple float) : Period for the exponential moving average
bullish_color (color) : Optional - Color for bullish candles
bearish_color (color) : Optional - Color for bearish candles
line_width (simple int) : Optional - Width of the moving average line, defaults to 2
ema_color (color) : Optional - Color of the moving average line
use_time_indexing (simple bool) : Optional - When true the function will plot with xloc.time, when false it will plot using xloc.bar_index
Returns: void - Creates visual candle chart with EMA overlay
plot_ctf_time_candles(source, candle_type, number_of_seconds, timezone, tied_open, bullish_color, bearish_color, use_time_indexing)
Plots time-based candles without moving average
Parameters:
source (float) : Input price source to sample
candle_type (simple CandleType) : Type of candle chart to display
number_of_seconds (simple float) : Time duration per candle in seconds
timezone (simple int) : Timezone offset from UTC (-12 to +12)
tied_open (simple bool) : Whether to tie open price to close of previous candle
bullish_color (color) : Optional - Color for bullish candles
bearish_color (color) : Optional - Color for bearish candles
use_time_indexing (simple bool) : Optional - When true the function will plot with xloc.time, when false it will plot using xloc.bar_index
Returns: void - Creates visual candle chart without moving average
plot_ctf_candles(source, candle_type, sample_type, number_of_ticks, number_of_seconds, timezone, tied_open, ema_period, bullish_color, bearish_color, enable_ema, line_width, ema_color, use_time_indexing)
Unified function for plotting candles with comprehensive options
Parameters:
source (float) : Input price source to sample
candle_type (simple CandleType) : Optional - Type of candle chart to display
sample_type (simple SampleType) : Optional - Method for sampling data (Time or Ticks)
number_of_ticks (simple int) : Optional - Number of ticks per candle (used when sample_type is Ticks)
number_of_seconds (simple float) : Optional - Time duration per candle in seconds (used when sample_type is Time)
timezone (simple int) : Optional - Timezone offset from UTC (-12 to +12)
tied_open (simple bool) : Optional - Whether to tie open price to close of previous candle
ema_period (simple float) : Optional - Period for the exponential moving average
bullish_color (color) : Optional - Color for bullish candles
bearish_color (color) : Optional - Color for bearish candles
enable_ema (bool) : Optional - Whether to display the EMA overlay
line_width (simple int) : Optional - Width of the moving average line, defaults to 2
ema_color (color) : Optional - Color of the moving average line
use_time_indexing (simple bool) : Optional - When true the function will plot with xloc.time, when false it will plot using xloc.bar_index
Returns: void - Creates visual candle chart with optional EMA overlay
ctf_candles_array(source, candle_type, sample_type, number_of_ticks, number_of_seconds, tied_open, bullish_color, bearish_color)
Creates an array of custom timeframe candles without rendering them
Parameters:
source (float) : Input price source to sample
candle_type (simple CandleType) : Type of candle chart to create (candlestick or Heikin-Ashi)
sample_type (simple SampleType) : Method for sampling data (Time or Ticks)
number_of_ticks (simple int) : Optional - Number of ticks per candle (used when sample_type is Ticks)
number_of_seconds (simple float) : Optional - Time duration per candle in seconds (used when sample_type is Time)
tied_open (simple bool) : Optional - Whether to tie open price to close of previous candle
bullish_color (color) : Optional - Color for bullish candles
bearish_color (color) : Optional - Color for bearish candles
Returns: Array of CandleCTF objects ordered with most recent at index 0
Candle
Structure representing a complete candle with price data and display properties
Fields:
Open (series float) : Opening price of the candle
High (series float) : Highest price of the candle
Low (series float) : Lowest price of the candle
Close (series float) : Closing price of the candle
polarity (series bool) : Boolean indicating if candle is bullish (true) or bearish (false)
series_index (series int) : Sequential index identifying the candle in the series
candle_color (series color) : Color to use when rendering the candle
ready (series bool) : Boolean indicating if candle data is valid and ready for use
TickData
Structure for storing individual price updates
Fields:
price (series float) : The price value at this tick
time_delta (series float) : Time elapsed since the previous tick in milliseconds
series_index (series int) : Sequential index identifying this tick
CandleCTF
Structure representing a custom timeframe candle with additional time metadata
Fields:
Open (series float) : Opening price of the candle
High (series float) : Highest price of the candle
Low (series float) : Lowest price of the candle
Close (series float) : Closing price of the candle
polarity (series bool) : Boolean indicating if candle is bullish (true) or bearish (false)
series_index (series int) : Sequential index identifying the candle in the series
open_time (series int) : Timestamp marking when the candle was opened (in Unix time)
time_delta (series float) : Duration of the candle in milliseconds
candle_color (series color) : Color to use when rendering the candle

Multi-Timeframe VWAP Master ProThe Multi-Timeframe VWAP Suite is a comprehensive and highly customizable indicator designed for traders who rely on Volume-Weighted Average Price (VWAP) across multiple timeframes and periods. This tool provides a complete suite of VWAP calculations, including daily, weekly, monthly, quarterly, yearly, and custom VWAPs, allowing traders to analyze price action and volume trends with precision. Whether you're a day trader, swing trader, or long-term investor, this indicator offers unparalleled flexibility and depth for your trading strategy.
Multi-Timeframe VWAPs:
Daily, Weekly, Monthly, Quarterly, and Yearly VWAPs: Track VWAP across various timeframes to identify key support and resistance levels.
Customizable Timeframes: Use the SMA timeframe input to adjust the period for moving averages and other calculations.
Previous Period VWAPs:
Previous Daily, Weekly, Monthly, and Quarterly VWAPs: Analyze historical VWAP levels to understand past price behavior and identify potential reversal zones.
Previous Year Quarterly VWAPs: Compare current price action to VWAP levels from specific quarters of the previous year.
Custom VWAPs:
Custom Start Date and Timeframe: Define your own VWAP periods by specifying a start date and timeframe, allowing for tailored analysis.
Dynamic Custom VWAP Calculation: Automatically calculates VWAP based on your custom inputs, ensuring flexibility for unique trading strategies.
Seasonal and Yearly VWAPs:
April, July, and October VWAPs: Analyze seasonal trends by tracking VWAP levels for specific months.
Yearly VWAP: Get a broader perspective on long-term price trends with the yearly VWAP.
SMA Integration:
SMA Overlay: Combine VWAP analysis with a Simple Moving Average (SMA) for additional confirmation of trends and reversals.
Customizable SMA Length and Timeframe: Adjust the SMA settings to match your trading style and preferences.
User-Friendly Customization:
Toggle Visibility and Labels: Easily enable or disable the display of specific VWAPs and their labels to keep your chart clean and focused.
Color Customization: Each VWAP line and label is color-coded for easy identification and can be customized to suit your preferences.
Dynamic Labeling:
Automatic Labels: Labels are dynamically placed on the last bar, providing clear and concise information about each VWAP level.
Customizable Label Text: Labels include detailed information, such as the timeframe or custom period, for quick reference.
Flexible Timeframe Detection:
Automatic Timeframe Detection: The indicator automatically detects new days, weeks, months, and quarters, ensuring accurate VWAP calculations.
Support for Intraday and Higher Timeframes: Works seamlessly on all chart timeframes, from 1-minute to monthly charts.
Previous Year Quarterly VWAPs:
Q1, Q2, Q3, Q4 VWAPs: Compare current price action to VWAP levels from specific quarters of the previous year.
User-Selectable Year: Choose the year for which you want to calculate previous quarterly VWAPs.
Persistent Monthly VWAPs:
Option to Persist Monthly VWAPs Year-Round: Keep monthly VWAP levels visible even after the month ends for ongoing analysis.
Comprehensive Analysis: Combines multiple VWAP timeframes and periods into a single tool, eliminating the need for multiple indicators.
Customizable and Flexible: Tailor the indicator to your specific trading strategy with customizable timeframes, periods, and settings.
Enhanced Decision-Making: Gain deeper insights into price action and volume trends across different timeframes, helping you make more informed trading decisions.
Clean and Organized Charts: Toggle visibility and labels to keep your chart clutter-free while still accessing all the information you need.
Ideal For:
Day Traders: Use daily and intraday VWAPs to identify intraday support and resistance levels.
Swing Traders: Analyze weekly and monthly VWAPs to spot medium-term trends and reversals.
Long-Term Investors: Leverage quarterly and yearly VWAPs to understand long-term price behavior and key levels.
Seasonal Traders: Track April, July, and October VWAPs to capitalize on seasonal trends.
The Multi-Timeframe VWAP Suite is a powerful and versatile tool for traders of all styles and timeframes. With its comprehensive suite of VWAP calculations, customizable settings, and user-friendly design, it provides everything you need to analyze price action and volume trends with precision and confidence. Whether you're looking to fine-tune your intraday strategy or gain a broader perspective on long-term trends, this indicator has you covered.

Kalman Filter Trend BreakersThe Kalman filter is a recursive algorithm developed in 1960 by Rudolf E. Kálmán, a Hungarian-American engineer and mathematician, that provides optimal estimates of a system's state by combining noisy measurements with a predictive model. It is widely used in control systems, signal processing, and finance for tracking and forecasting.
In trading, KF might be a good replacement for a moving average, as it reacts to price changes in a different way. Not only it follows price direction, but can also track the velocity of price change. This specific behaviour of KF is used in this indicator to track changes in trends.
Trend is characterized by price moving directionally, however, any trend comes to pause or complete stop and reversal, as the price changes more slowly (a trend fades into a sideways movement for a while) or the price movement changes direction, thus making a reversal.
This indicator detects the points where such changes occur (trend breaker points), and produces signals, which serve as points of current trend pausing or reversing. By applying different settings for KF calculation, you can produce less or more signals that indicate change in trend character, and either detect only significant trends changes, or less and shorter trends changes as well.
The signals do not differentiate the exact type of a trend change (it can be a brief trend pause followed by a continuation, as well as a complete reversal). However, once you are in a trend, the significant velocity change indicates a change in trend structure. In this sense, trend breaker signals should not be followed blindly, and can be used only as trend (and subsequently, position) exit confirmations, but not the entry contrarian confirmations.
For better visual representation, you can use chart signals attached to bars, and additionally paint a vertical gradient at each signal which shows significant trend deceleration.
Kalman filter calculations used in this indicator are partially based on an open-source code from @loxx which was published in 2022 as Kalman filter overlay .

Altcoins Screener [SwissAlgo]Introduction: The Altcoins Screener at a Glance
The Altcoins Screener is a cryptocurrency analysis tool designed to provide an overview of potential trading opportunities across multiple crypto coins/tokens and categories. By combining technical analysis, price action assessment, and social metrics (via LunarCrush data), it presents market information and trading signals for a broad range of altcoins (approx. 300 USDT.P pairs of 9 crypto categories).
The screener is designed to consolidate market information onto a single chart , aiming to streamline the analysis of market conditions. It provides a consolidated market overview, which can simplify the assessment of market conditions, compared to monitoring individual charts with several layered indicators.
Key Features:
🔹 Multi-category analysis covering 300 crypto pairs of 9 categories on a single chart (Layer 1 & Top Coins, Layer2 & Scaling, Defi & Landing, Gaming & Metaverse, AI & Data, Exchanges & Trading, NFT & Social, Memes & Community, Other, User's Custom Portfolio).
🔹 Technical analysis with trade signals (Long/Short) based on an aggregated view of technical and social data points
🔹 Social sentiment integration through LunarCrush metrics (GalaxyScore, AltRank, Social Sentiment)
🔹 Real-time market scanning provides automated alerts when market conditions for specified coins/tokens potentially change.
🔹 Custom watchlist support for personalized monitoring (users can define a custom category containing a set of specific cryptocurrencies, i.e. own portfolio).
The screener presents data in a table format, using color-coded indicators to aid visual analysis. Detailed technical information is also provided. The assessments/trade signals provided by this indicator should be considered as one input among many when forming your trading strategy.
--------------------------------------
What It Does
The Altcoins Screener is a cryptocurrency analysis tool that offers:
Data Display and Analysis (Technical/Social):
🔹 Technical Metrics
* Technical Raw Data : Displays raw values for a range of technical indicators, including RSI, Stochastic RSI, DMI/ADX, RVI, ATR, OBV, and Hull Moving Averages (including their recent trends and potential significance).
Detailed view of key technical indicators, for further analysis and evaluation:
* Technical Analysis (Summary) : Provides a summarized interpretation of technical conditions based on aggregated parameters:
* Price Action
* Trend
* Momentum
* Volatility
* Volume
Summarized view of confluences for potential long/short bias:
🔹 Social Metrics (LunarCrush) : Presents data from LunarCrush®, including Galaxy Score®, AltRank®, and Social Sentiment® (including their recent trends and potential significance).
Lunarcrush data for the top 10 coins for each crypto category:
🔹 PVSRA (Price Volume & Market Makers Activity) Candles : Shows special candles highlighting potential market maker activity and volume anomalies, helping identify possible manipulation zones (including imbalance zones, i.e. price areas that market makers may revisit)
--------------------------------------
Key Features:
Automated trade signals (Long/Short) are generated based on algorithmic calculations and signal confidence levels across technical and social data points. These signals are intended to be used as one component of a broader trading strategy.
Custom sensitivity settings allow users to adjust the analysis timeframe (options: 1D, 2D, or 1W). Higher timeframes may provide a broader perspective, while the 2D setting is the default configuration.
Multi-category analysis covering a selection of approximately 300 crypto pairs across 9 predefined crypto categories.
Custom symbol selection: Users can define a custom list of up to 10 symbols for focused monitoring.
Automated Alerts to track potential trend changes across crypto categories (Long to Short to Neutral, or vice versa)
Visual Interface:
Organized table display with color-coded indicators to aid interpretation.
Clear and efficient format for scanning market information.
--------------------------------------
Target Audience
🔹 The screener is designed for cryptocurrency traders who:
Need to efficiently monitor multiple USDT perpetual futures markets
Use technical analysis in their trading decisions
Want to track sector-wide movements across crypto categories
🔹 Suitable for different trading styles:
Scalpers requiring quick market assessment
Swing traders analyzing multi-day trends
Position traders monitoring longer-term setups
The color-coded interface makes it accessible for intermediate traders while providing detailed metrics for advanced users. A basic understanding of technical analysis and crypto trading is recommended.
--------------------------------------
How It Works
The Altcoins Screener evaluates cryptocurrencies through a multi-layered analysis:
🔹 Core Analysis Components
Each parameter combines multiple indicators for comprehensive evaluation:
Price Action
EMA crossovers and momentum
Support/resistance zones
Candlestick patterns
Trend
Hull Moving Average system
DMI/ADX trend strength
Multi-timeframe confirmation
Momentum
RSI/Stochastic RSI readings
MACD convergence/divergence
Oscillator confirmations
Volatility
RVI/ATR measurements
Bollinger Bands behavior
Historical volatility trends
Volume
OBV trend analysis
Volume/price correlations
Volume profile assessment
🔹 Signal Generation Process
1. Real-time data collection across timeframes
2. Weighted indicator calculations
3. Parameter aggregation and analysis
4. Signal strength determination
5. Color-coding and alert generation
--------------------------------------
How to Use
🔹 Initial Setup:
Add the indicator to a chart (use the 1D timeframe)
Select your preferred crypto category or create a custom list
Choose between Technical Analysis or Technical Metrics view
Set data sensitivity based on your trading style
🔹 Using the Technical Analysis View:
Monitor color-coded dots for quick market assessment
Green: bullish conditions
Red: bearish conditions
Gray: neutral conditions
Check the "Trade Signal" column for potential Long/Short entries signaled by confluences among technical and/or social data points
🔹 Using the Technical Metrics View:
Review detailed numerical values
Monitor slopes (↑↓ arrows) for the most recent trend direction of each data point
Watch for pivotal points (highlighted cells): these are data points that suggest potential trend reversals
Focus on the confluence of multiple indicators
The technical metrics view corroborates the conclusions shown in the Technical Analysis View, providing more details about some critical data points.
🔹 Alert Configuration:
Enable Technical Alerts for signal notifications (which coin/token seems most suited for Long or Short trades, and which coin/token is in a neutral/uncertain state for trading = "No Trade")
Configure alert conditions based on trading style
Set timeframe-appropriate sensitivity
Monitor alert messages for trade signals
Instructions on how to set alerts are provided in the script (enable "Signals Setup Instructions" in User Interface to get a step-by-step guide about setting up alerts)
Best Practices:
Confirm signals across multiple timeframes
Use appropriate sensitivity for your trading style
Monitor multiple categories for sector rotation
Combine signals with your trading strategy
Verify signals with price action confirmation and deep dive into the charts of your potential targets
--------------------------------------
About the Settings
🔹 Crypto Category Selection
Layer 1 & Major: Top market cap coins (BTC, ETH, XRP,...), established protocols
Layer 2 & Scaling: ETH L2s, scaling solutions
DeFi & Lending: Decentralized finance protocols
Gaming & Metaverse: Gaming and virtual world tokens
AI & Data: Artificial intelligence and data projects
Exchange & Trading: Exchange tokens, trading protocols
NFT & Social: NFT platforms, social tokens
Memes & Community: Community-driven tokens
Others & Misc: Other categories
Custom Category: User-defined list (up to 10 symbols)
Data Type Options
Technical Analysis: Color-coded summary view
Technical Metrics: Detailed numerical values of some key technical data points
Sensitivity Settings
Higher: Shorter timeframe, more frequent signals
Default: Balanced timeframe, standard signals
Lower: Longer timeframe, stronger signals
Alert Settings
Technical Alerts: Trade signal notifications
Data Timeframe: Minimum 1D required
Theme: Dark/Light mode options
Note: All analysis is performed on USDT Perpetual Futures pairs from Binance
--------------------------------------
FAQ
Q: Does the screener work on other exchanges besides Binance?
A: No, it's designed specifically for Binance USDT Perpetual Futures pairs. Binance offers the highest liquidity and trading volume in the crypto derivatives market, making it ideal for technical analysis. The extensive range of trading pairs and reliable data streams help ensure more accurate signals and analysis. Using a single high-liquidity exchange also helps avoid inconsistencies that could arise from aggregating data across multiple platforms with varying liquidity levels.
Q: What's the minimum timeframe required?
A: The screener requires a minimum 1D (daily) timeframe. This requirement ensures that the technical analysis has sufficient data points for reliable signal generation. Lower timeframes can produce more noise and false signals, while daily timeframes help filter out market noise and identify stronger trends.
Q: Why are some social metrics showing "NaN"?
A: "NaN" (Not a Number) appears when cryptocurrencies don't have associated LunarCrush data. This typically occurs with newer tokens or those with lower market caps. The technical analysis remains fully functional regardless of social metric availability, as these are complementary data points.
Q: How often are signals updated?
A: Signals update with each new candle on the selected timeframe (1D, 2D, or 1W). For example, on the default 2D setting, signals are recalculated every two days as new candles form. This helps reduce noise while maintaining timely analysis of market conditions.
Q: Can I add spot trading pairs?
A: No, the screener is optimized for Binance USDT perpetual futures pairs for data consistency and analysis purposes. While spot and perpetual prices typically align closely due to arbitrage, using a single data source (Binance) and contract type (USDT perpetual) ensures uniform data quality and analysis across all pairs. This standardization helps maintain reliable technical analysis and signal generation.
Q: How many coins can I add to my custom list?
A: Users can add up to 10 custom symbols to their watchlist. This limit is designed to maintain optimal performance while allowing focused monitoring of specific assets. The custom list complements the predefined categories that cover over 300 pairs.
Q: What determines signal confidence levels?
A: Signal confidence is calculated through a weighted algorithm that considers multiple factors: trend strength (Hull MA, DMI/ADX), momentum indicators (RSI, SRSI), volatility measurements (RVI, ATR, BB), volume analysis (OBV, volume trends), and price action patterns. Higher confidence levels indicate stronger alignment across these factors.
Q: Are signals guaranteed to work?
A: No. Signals are analytical tools based on historical and current market data, not guaranteed predictions. They should be used as one component of a comprehensive trading strategy that includes proper risk management, position sizing, and additional confirmation factors. Past performance does not guarantee future results.
Q: Why does the screener need higher timeframes?
A: Higher timeframes (1D minimum) provide several benefits: reduced market noise, more reliable technical signals, better trend identification, and lower likelihood of false signals. They also align better with institutional trading patterns and allow for a more thorough analysis of market conditions across multiple indicators.
--------------------------------------
Conclusion
The Altcoins Screener is a comprehensive crypto market analysis tool that:
Scans 300+ cryptocurrencies across 9 sectors on a single chart
Combines technical indicators and social metrics for signal generation
Identifies potential trading opportunities through color-coded visuals
Saves time by eliminating the need to monitor multiple charts
The tool is suited for:
Market overview and sector rotation analysis
Quick assessment of market conditions
Technical and social sentiment tracking
Systematic trading approach with alerts
Use this screener with caution and as a complement to any other tool you use to define your trading strategy.
--------------------------------------
Disclaimer
This indicator is for informational and educational purposes only:
Not financial advice: This indicator should not be considered investment advice.
No guarantee of accuracy: The indicator's calculations and signals are based on specific algorithms and data sources, but accuracy cannot be guaranteed. Market conditions can change rapidly.
Past performance is not predictive: Past performance of the indicator's signals or any specific asset is not indicative of future results.
Substantial risk of loss: Trading cryptocurrencies involves a substantial risk of loss. You can lose money trading these assets.
User responsibility: Users are solely responsible for their own trading decisions and should exercise caution.
Independent research required: Always conduct thorough independent research (DYOR) before making any trading decisions.
Technical analysis is one of many tools: Technical analysis, including the output of this indicator, is just one tool among many and should not be relied upon exclusively.
Risk management is essential: Use proper risk management techniques, including position sizing and stop-loss orders.
Comprehensive strategy: Use this tool as part of a comprehensive trading strategy, not as a standalone solution.
No liability for trading results: The Author assumes no responsibility or liability for any trading results or losses incurred as a result of using this indicator.
No TradingView affiliation: SwissAlgo is an independent entity and is not affiliated with or endorsed by TradingView.
LunarCrush data: The indicator utilizes publicly available data from LunarCrush. LunarCrush data and trademarks are the property of LunarCrush.
Consult a financial advisor: Consult with a qualified financial advisor before making any investment decisions.
By using this indicator, you acknowledge and agree to these terms. If you do not agree with these terms, please refrain from using this indicator.

WD Gann: Close Price X Bars Ago with Line or Candle PlotThis indicator is inspired by the principles of WD Gann, a legendary trader known for his groundbreaking methods in time and price analysis. It helps traders track the close price of a security from X bars ago, a technique that is often used to identify key price levels in relation to past price movements. This concept is essential for Gann’s market theories, which emphasize the relationship between time and price.
WD Gann’s analysis often revolved around specific numbers that he considered significant, many of which correspond to squared numbers (e.g., 1, 4, 9, 16, 25, 36, 49, 64, 81, 100, 121, 144, 169, 196, 225, 256, 289, 324, 361, 400, 441, 484, 529, 576, 625, 676, 729, 784, 841, 900, 961, 1024, 1089, 1156, 1225, 1296, 1369, 1444, 1521, 1600, 1681, 1764, 1849, 1936). These numbers are believed to represent natural rhythms and cycles in the market. This indicator can help you explore how past price levels align with these significant numbers, potentially revealing key price zones that could act as support, resistance, or reversal points.
Key Features:
- Historical Close Price Calculation: The indicator calculates and displays the close price of a security from X bars ago (where X is customizable). This method aligns with Gann's focus on price relationships over specific time intervals, providing traders with valuable reference points to assess market conditions.
- Customizable Plot Type: You can choose between two plot types for visualizing the historical close price:
- Line Plot: A simple line that represents the close price from X bars ago, ideal for those who prefer a clean and continuous representation.
- Candle Plot: Displays the close price as a candlestick chart, providing a more detailed view with open, high, low, and close prices from X bars ago.
- Candle Color Coding: For the candle plot type, the script color-codes the candles. Green candles appear when the close price from X bars ago is higher than the open price, indicating bullish sentiment; red candles appear when the close is lower, indicating bearish sentiment. This color coding gives a quick visual cue to market sentiment.
- Customizable Number of Bars: You can adjust the number of bars (X) to look back, providing flexibility for analyzing different timeframes. Whether you're conducting short-term or long-term analysis, this input can be fine-tuned to suit your trading strategy.
- Gann Method Application: WD Gann's methods involved analyzing price action over specific time periods to predict future movements. This indicator offers traders a way to assess how the price of a security has behaved in the past in relation to a chosen time interval, a critical concept in Gann's theories.
How to Use:
1. Input Settings:
- Number of Bars (X): Choose the number of bars to look back (e.g., 100, 200, or any custom period).
- Plot Type: Select whether to display the data as a Line or Candles.
2. Interpretation:
- Using the Line plot, observe how the close price from X bars ago compares to the current market price.
- Using the Candles plot, analyze the full price action of the chosen bar from X bars ago, noting how the close price relates to the open, high, and low of that bar.
3. Gann Analysis: Integrate this indicator into your broader Gann-based analysis. By looking at past price levels and their relationship to significant squared numbers, traders can uncover potential key levels of support and resistance or even potential reversal points. The historical close price can act as a benchmark for predicting future market movements.
Suggestions on WD Gann's Emphasis in Trading:
WD Gann’s trading methods were rooted in several key principles that emphasized the relationship between time and price. These principles are vital to understanding how the "Close Price X Bars Ago" indicator fits into his overall analysis:
1. Time Cycles: Gann believed that markets move in cyclical patterns. By studying price levels from specific time intervals, traders can spot these cycles and predict future market behavior. This indicator allows you to see how the close price from X bars ago relates to current market conditions, helping to spot cyclical highs and lows.
2. Price and Time Squaring: A core concept in Gann’s theory is that certain price levels and time periods align, often marking significant reversal points. The squared numbers (e.g., 1, 4, 9, 16, 25, etc.) serve as potential key levels where price and time might "square" to create support or resistance. This indicator helps traders spot these historical price levels and their potential relevance to future price action.
3. Geometric Angles: Gann used angles (like the 45-degree angle) to predict market movements, with the belief that prices move at specific geometric angles over time. This indicator gives traders a reference for past price levels, which could align with key angles, helping traders predict future price movement based on Gann's geometry.
4. Numerology and Key Intervals: Gann paid particular attention to numbers that held significance, including squared numbers and numbers related to the Fibonacci sequence. This indicator allows traders to analyze price levels based on these key numbers, which can help in identifying potential turning points in the market.
5. Support and Resistance Levels: Gann’s methods often involved identifying levels of support and resistance based on past price action. By tracking the close price from X bars ago, traders can identify past support and resistance levels that may become significant again in future market conditions.
Perfect for:
Traders using WD Gann’s methods, such as Gann angles, time cycles, and price theory.
Analysts who focus on historical price levels to predict future price action.
Those who rely on numerology and geometric principles in their trading strategies.
By integrating this indicator into your trading strategy, you gain a powerful tool for analyzing market cycles and price movements in relation to key time intervals. The ability to track and compare the historical close price to significant numbers—like Gann’s squared numbers—can provide valuable insights into potential support, resistance, and reversal points.
Disclaimer:
This indicator is based on the methods and principles of WD Gann and is for educational purposes only. It is not intended as financial advice. Trading involves significant risk, and you should not trade with money that you cannot afford to lose. Past performance is not indicative of future results. The use of this indicator is at your own discretion and risk. Always do your own research and consider consulting a licensed financial advisor before making any investment decisions.

TOP 20 ALTCOIN INDEXIndicator Description
The "ALT20 INDEX" is a financial analysis tool designed to track the aggregate value of the top 20 cryptocurrencies by market capitalization and closing prices over specific periods. This indicator reflects changes in the combined value of these 20 ALTCOINs, providing an overview of trends in the cryptocurrency market.
=================================
Purpose and Practical Applications
1. Tracking Top Cryptocurrencies:
- The indicator allows monitoring the value of the top 20 ALTCOINs, reflecting the general volatility of the cryptocurrency market.
- Helps investors focus on high-capitalization assets.
2. Performance Comparison:
- Serves as a tool to compare the performance of the ALT20 group against other assets like Bitcoin, Ethereum, or traditional financial indices.
3. Assessing Market Health:
- Enables evaluation of market trends, identifying growth or decline periods.
4. Practical Applications:
- Suitable for fund managers, long-term investors, or trend traders to make decisions based on the overall ALTCOIN market performance.
-------------------------------------------
How the Indicator Works
1. Selection of Top 20 ALTCOINs:
- Cryptocurrencies are selected based on their market capitalization at each rebalancing period.
2. Weight Allocation and Calculation:
- Weight: Determined by the market capitalization of each ALTCOIN relative to the total market capitalization of the top 20.
- Token Quantity: Calculated based on weight, total allocation points (e.g., 100 points for T1, 722.63 points for T2, etc.), and each ALTCOIN's closing price.
Formula: Token Quantity = Weight × Total Allocation Points/Closing Price
3. Periodic Rebalancing:
- Rebalancing frequency: Once a year.
- At each rebalancing period, the weights and token quantities are adjusted based on new market capitalization and prices.
4. Portfolio Value Calculation:
- The value of each ALTCOIN is calculated as:
Token Value = Closing Price × Token Quantity
- Index Total: ALT20 Index = 20∑'i=1'Token Value'i'
------------------------------------------
Rebalancing Periods
T1 (2020-2021): Initial period, token quantities calculated based on weights and a total of 100 points.
T2 (2021-2022): Rebalanced with a total allocation of 722.63 points.
T3 (2022-2023): Total allocation of 252.26 points, reflecting portfolio adjustments based on new prices and market caps.
T4 (2023-2024): Total allocation of 261.43 points.
T5 (2024-Present): Total allocation of 437.42 points, updated to reflect the current market.
-----------------------------------------
Indicator Features
- Displays Index Value Over Time:
+ index_value_T1 to index_value_T5 represent the portfolio value during specific timeframes.
+ Values are calculated based on the daily closing prices of ALTCOINs.
- Visualization:
+ The index for each period is plotted on the chart, enabling easy observation of market trends over time.
---------------------------------------
Practical Applications
- Portfolio Management:
+ The indicator helps track the performance of asset groups within the ALTCOIN portfolio.
- Integration into Trading Systems:
+ Used as a reference for automated or manual trading strategies.
- Market Analysis:
+ Assists analysts in evaluating cryptocurrency market movements based on the top 20 ALTCOINs.
Let me know if further optimization or additional information is needed! Thank!
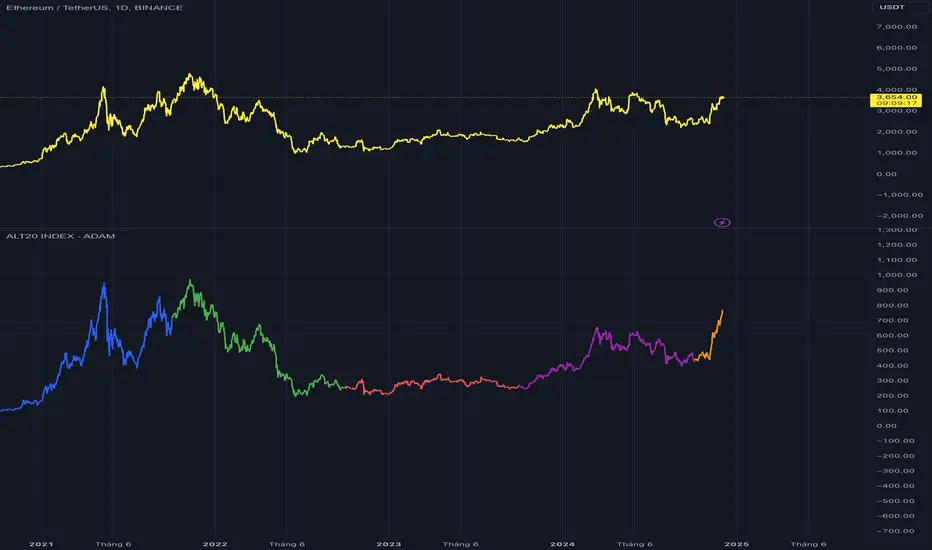
Mini PortfolioThis code is a simple portfolio tracker calculates the Net Asset Value (NAV) of a portfolio consisting of up to 6 tickers based on Binance prices. Users can input how much of each cryptocurrency they "own," and the script then fetches the opening price of each coin.
After calculating the values of BTC, ETH, and SOL, the code sums these individual values to determine the portfolio's total value, or NAV. This NAV is then plotted on a graph, allowing users to see the overall value of their selected cryptocurrency portfolio over time.
In essence, this code allows users to track the hypothetical value of a small crypto portfolio and see how price fluctuations affect the total portfolio value. It’s a useful tool for visualizing potential portfolio performance without actual investments.

Higher Time Frame Support/Resistance [BigBeluga]The Higher Time Frame Support/Resistance indicator is a tool designed to display pivot points derived from higher timeframes on your current chart. These pivot points are calculated based on the highs and lows of price action in different timeframes, and the indicator draws horizontal lines to represent these levels. These lines act as potential support and resistance zones, giving traders key market levels that may influence future price movement.
Each pivot line is color-coded and labeled with its price value and the timeframe it originates from. This allows traders to clearly differentiate between the significance of the levels based on their timeframe. For example, weekly pivot levels may represent stronger, more long-term support and resistance, while hourly pivots offer more immediate, short-term levels to watch.
🔵 IDEA
The Higher Time Frame Support/Resistance indicator is designed to simplify the process of tracking key support and resistance levels across multiple timeframes. Pivot points, which represent turning points in the market, are essential for identifying areas where price might reverse or break out. By displaying these levels from higher timeframes directly on the current chart, traders can quickly identify and react to critical areas in the market without needing to switch between different timeframe charts.
The indicator labels each pivot point with the specific timeframe it comes from (e.g., 4H, 1D, 1W), making it easy for traders to assess the relative strength of each level. Stronger levels from higher timeframes are likely to act as more significant barriers or support zones, while lower timeframe levels can be used for more precise entries and exits.
🔵 KEY FEATURES
Pivot Levels from Multiple Timeframes:
The indicator calculates pivot highs and lows from various higher timeframes (e.g., 4H, 1D, 1W) and plots these levels on the current chart. These pivot points are represented by horizontal lines that extend across the chart, serving as potential support and resistance zones.
Color-Coded Support and Resistance Lines:
Each pivot level is color-coded based on its timeframe, helping traders quickly differentiate between short-term and long-term support and resistance. This visual aid simplifies the analysis and allows for a clearer understanding of key market levels.
Price Labels and Timeframe Information:
In addition to the pivot lines, the indicator displays labels at each level with the corresponding price and timeframe. For example, a label may show "D Pivot High" followed by the exact price. This helps traders understand the origin and significance of each line, allowing for more informed trading decisions.
Labels up and down mark highs and lows from higher timeframes:
Pivot Shadows for Enhanced Clarity:
The indicator can also draw shadow lines that represent the pivot points but with increased transparency. These shadows allow traders to keep track of previous pivots without cluttering the chart with too many solid lines. The width and transparency of these shadows can be customized in the settings.
🔵 HOW TO USE
🔵 CUSTOMIZATION
Timeframes and Pivot Length: Customize which higher timeframes (e.g., 4H, 1D, 1W) you want to display pivot levels from. Adjust the pivot length to control how sensitive the indicator is in detecting market highs and lows.
Line Style and Colors: Adjust the line style (solid, dashed, dotted) and colors for each timeframe to match your personal preference or chart theme. This customization helps in maintaining a clear and visually appealing chart.
Shadow Line Width and Transparency: Control the width and transparency of the shadow pivot lines to reduce chart clutter while still keeping track of key historical levels.

Dynamic Market Correlation Analyzer (DMCA) v1.0Description
The Dynamic Market Correlation Analyzer (DMCA) is an advanced TradingView indicator designed to provide real-time correlation analysis between multiple assets. It offers a comprehensive view of market relationships through correlation coefficients, technical indicators, and visual representations.
Key Features
- Multi-asset correlation tracking (up to 5 symbols)
- Dynamic correlation strength categorization
- Integrated technical indicators (RSI, MACD, DX)
- Customizable visualization options
- Real-time price change monitoring
- Flexible timeframe selection
## Use Cases
1. **Portfolio Diversification**
- Identify highly correlated assets to avoid concentration risk
- Find negatively correlated assets for hedging strategies
- Monitor correlation changes during market events
2. Pairs Trading
- Detect correlation breakdowns for potential trading opportunities
- Track correlation strength for pair selection
- Monitor technical indicators for trade timing
3. Risk Management
- Assess portfolio correlation risk in real-time
- Monitor correlation shifts during market stress
- Identify potential portfolio vulnerabilities
4. **Market Analysis**
- Study sector relationships and rotations
- Analyze cross-asset correlations (e.g., stocks vs. commodities)
- Track market regime changes through correlation patterns
Components
Input Parameters
- **Timeframe**: Custom timeframe selection for analysis
- **Length**: Correlation calculation period (default: 20)
- **Source**: Price data source selection
- **Symbol Selection**: Up to 5 customizable symbols
- **Display Options**: Table position, text color, and size settings
Technical Indicators
1. **Correlation Coefficient**
- Range: -1 to +1
- Strength categories: Strong/Moderate/Weak (Positive/Negative)
2. **RSI (Relative Strength Index)**
- 14-period default setting
- Momentum comparison across assets
3. **MACD (Moving Average Convergence Divergence)**
- Standard settings (12, 26, 9)
- Trend direction indicator
4. **DX (Directional Index)**
- Trend strength measurement
- Based on DMI calculations
Visual Components
1. **Correlation Table**
- Symbol identifiers
- Correlation coefficients
- Correlation strength descriptions
- Price change percentages
- Technical indicator values
2. **Correlation Plot**
- Real-time correlation visualization
- Multiple correlation lines
- Reference levels at -1, 0, and +1
- Color-coded for easy identification
Installation and Setup
1. Load the indicator on TradingView
2. Configure desired symbols (up to 5)
3. Adjust timeframe and calculation length
4. Customize display settings
5. Enable/disable desired components (table, plot, RSI)
Best Practices
1. **Symbol Selection**
- Choose related but distinct assets
- Include a mix of asset classes
- Consider market cap and liquidity
2. **Timeframe Selection**
- Match timeframe to trading strategy
- Consider longer timeframes for strategic analysis
- Use shorter timeframes for tactical decisions
3. **Interpretation**
- Monitor correlation changes over time
- Consider multiple timeframes
- Combine with other technical analysis tools
- Account for market conditions and volatility
Performance Notes
- Calculations update in real-time
- Resource usage scales with number of active symbols
- Historical data availability may affect initial calculations
Version History
- v1.0: Initial release with core functionality
- Multi-symbol correlation analysis
- Technical indicator integration
- Customizable display options
Future Enhancements (Planned)
- Additional technical indicators
- Advanced correlation algorithms
- Enhanced visualization options
- Custom alert conditions
- Statistical significance testing

Adaptive EMA with ATR and Standard Deviation [QuantAlgo]Adaptive EMA with ATR and Standard Deviation by QuantAlgo 📈✨
Introducing the Adaptive EMA with ATR and Standard Deviation , a comprehensive trend-following indicator designed to combine the smoothness of an Exponential Moving Average (EMA) with the volatility adjustments of Average True Range (ATR) and Standard Deviation. This synergy allows traders and investors to better identify market trends while accounting for volatility, delivering clearer signals in both trending and volatile market conditions. This indicator is suitable for traders and investors seeking to balance trend detection and volatility management, offering a robust and adaptable approach across various asset classes and timeframes.
💫 Core Concept and Innovation
The Adaptive EMA with ATR and Standard Deviation brings together the trend-smoothing properties of the EMA and the volatility sensitivity of ATR and Standard Deviation. By using the EMA to track price movements over time, the indicator smooths out minor fluctuations while still providing valuable insights into overall market direction. However, market volatility can sometimes distort simple moving averages, so the ATR and Standard Deviation components dynamically adjust the trend signals, offering more nuanced insights into trend strength and reversals. This combination equips traders with a powerful tool to navigate unpredictable markets while minimizing false signals.
📊 Technical Breakdown and Calculations
The Adaptive EMA with ATR and Standard Deviation relies on three key technical components:
1. Exponential Moving Average (EMA): The EMA forms the base of the trend detection. Unlike a Simple Moving Average (SMA), the EMA gives more weight to recent price changes, allowing it to react more quickly to new data. Users can adjust the length of the EMA to make it more or less responsive to price movements.
2. Standard Deviation Bands: These bands are calculated from the standard deviation of the EMA and represent dynamic volatility thresholds. The upper and lower bands expand or contract based on recent price volatility, providing more accurate signals in both calm and volatile markets.
3. ATR-Based Volatility Filter: The Average True Range (ATR) is used to measure market volatility over a user-defined period. It helps refine the trend signals by filtering out false positives caused by minor price swings. The ATR filter ensures that the indicator only signals significant market movements.
⚙️ Step-by-Step Calculation:
1. EMA Calculation: First, the indicator calculates the EMA over a specified period based on the chosen price source (e.g., close, high, low).
2. Standard Deviation Bands: Then, it computes the standard deviation of the EMA and applies a multiplier to create upper and lower bands around the EMA. These bands adjust dynamically with the level of market volatility.
3. ATR Filtering: In addition to the standard deviation bands, the ATR is applied as a secondary filter to help refine the trend signals. This step helps eliminate signals generated by short-term price spikes or corrections, ensuring that the signals are more reliable.
4. Trend Detection: When the price crosses above the upper band, a bullish trend is identified, while a move below the lower band signals a bearish trend. The system accounts for both the standard deviation and ATR bands to generate these signals.
✅ Customizable Inputs and Features
The Adaptive EMA with ATR and Standard Deviation provides a range of customizable options to fit various trading/investing styles:
📈 Trend Settings:
1. Price Source: Choose the price type (e.g., close, high, low) to base the EMA calculation on, influencing how the trend is tracked.
2. EMA Length: Adjust the length to control how quickly the EMA reacts to price changes. A shorter length provides a more responsive EMA, while a longer period smooths out short-term fluctuations.
🌊 Volatility Controls:
1. Standard Deviation Multiplier: This parameter controls the sensitivity of the trend detection by adjusting the distance between the upper and lower bands from the EMA.
2. TR Length and Multiplier: Fine-tune the ATR settings to control how volatility is filtered, adjusting the indicator’s responsiveness during high or low volatility phases.
🎨 Visualization and Alerts:
1. Bar Coloring: Select different colors for uptrends and downtrends, providing a clear visual cue when trends change.
2. Alerts: Set up alerts to notify you when the price crosses the upper or lower bands, signaling a potential long or short trend shift. Alerts can help you stay informed without constant chart monitoring.
📈 Practical Applications
The Adaptive EMA with ATR and Standard Deviation is ideal for traders and investors looking to balance trend-following strategies with volatility management. Key uses include:
Detecting Trend Reversals: The dynamic bands help identify when the market shifts direction, providing clear signals when a trend reversal is likely.
Filtering Market Noise: By applying both Standard Deviation and ATR filtering, the indicator helps reduce false signals during periods of heightened volatility.
Volatility-Based Risk Management: The adaptability of the bands ensures that traders can manage risk more effectively by responding to shifts in volatility while keeping focus on long-term trends.
⭐️ Comprehensive Summary
The Adaptive EMA with ATR and Standard Deviation is a highly customizable indicator that provides traders with clearer signals for trend detection and volatility management. By dynamically adjusting its calculations based on market conditions, it offers a powerful tool for navigating both trending and volatile markets. Whether you're looking to detect early trend reversals or avoid false signals during periods of high volatility, this indicator gives you the flexibility and accuracy to improve your trading and investing strategies.
Note: The Adaptive EMA with ATR and Standard Deviation is designed to enhance your market analysis but should not be relied upon as the sole basis for trading or investing decisions. Always combine it with other analytical tools and practices. No statements or signals from this indicator constitute financial advice. Past performance is not indicative of future results.
