Weight Gain 4000 - (Adjustable Volume Weighted MA) - [mutantdog]Short Version:
This is a fairly self-contained system based upon a moving average crossover with several unique features. The most significant of these is the adjustable volume weighting system, allowing for transformations between standard and weighted versions of each included MA. With this feature it is possible to apply partial weighting which can help to improve responsiveness without dramatically altering shape. Included types are SMA, EMA, WMA, RMA, hSMA, DEMA and TEMA. Potentially more will be added in future (check updates below).
In addition there are a selection of alternative 'weighted' inputs, a pair of Bollinger-style deviation bands, a separate price tracker and a bunch of alert presets.
This can be used out-of-the-box or tweaked in multiple ways for unusual results. Default settings are a basic 8/21 EMA cross with partial volume weighting. Dev bands apply to MA2 and are based upon the type and the volume weighting. For standard Bollinger bands use SMA with length 20 and try adding a small amount of volume weighting.
A more detailed breakdown of the functionality follows.
Long Version:
ADJUSTABLE VOLUME WEIGHTING
In principle any moving average should have a volume weighted analogue, the standard VWMA is just an SMA with volume weighting for example. Actually, we can consider the SMA to be a special case where volume is a constant 1 per bar (the value is somewhat arbitrary, the important part is that it's constant). Similar principles apply to the 'elastic' EVWMA which is the volume weighted analogue of an RMA. In any case though, where we have standard and weighted variants it is possible to transform one into the other by gradually increasing or decreasing the weighting, which forms the basis of this system. This is not just a simple multiplier however, that would not work due to the relative proportions being the same when set at any non zero value. In order to create a meaningful transformation we need to use an exponent instead, eg: volume^x , where x is a variable determined in this case by the 'volume' parameter. When x=1, the full volume weighting applies and when x=0, the volume will be reduced to a constant 1. Values in between will result in the respective partial weighting, for example 0.5 will give the square root of the volume.
The obvious question here though is why would you want to do this? To answer that really it is best to actually try it. The advantages that volume weighting can bring to a moving average can sometimes come at the cost of unwanted or erratic behaviour. While it can tend towards much closer price tracking which may be desirable, sometimes it needs moderating especially in markets with lower liquidity. Here the adjustability can be useful, in many cases i have found that adding a small amount of volume weighting to a chosen MA can help to improve its responsiveness without overpowering it. Another possible use case would be to have two instances of the same MA with the same length but different weightings, the extent to which these diverge from each other can be a useful indicator of trend strength. Other uses will become apparent with experimentation and can vary from one market to another.
THE INCLUDED MODES
At the time of publication, there are 7 included moving average types with plans to add more in future. For now here is a brief explainer of what's on offer (continuing to use x as shorthand for the volume parameter), starting with the two most common types.
SMA: As mentioned above this is essentially a standard VWMA, calculated here as sma(source*volume^x,length)/sma(volume^x,length). In this case when x=0 then volume=1 and it reduces to a standard SMA.
RMA: Again mentioned above, this is an EVWMA (where E stands for elastic) with constant weighting. Without going into detail, this method takes the 1/length factor of an RMA and replaces it with volume^x/sum(volume^x,length). In this case again we can see that when x=0 then volume=1 and the original 1/length factor is restored.
EMA: This follows the same principle as the RMA where the standard 2/(length+1) factor is replaced with (2*volume^x)/(sum(volume^x,length)+volume^x). As with an RMA, when x=0 then volume=1 and this reduces back to the standard 2/(length+1).
DEMA: Just a standard Double EMA using the above.
TEMA: Likewise, a standard Triple EMA using the above.
hSMA: This is the same as the SMA except it uses harmonic mean calculations instead of arithmetic. In most cases the differences are negligible however they can become more pronounced when volume weighting is introduced. Furthermore, an argument can be made that harmonic mean calculations are better suited to downtrends or bear markets, in principle at least.
WMA: Probably the most contentious one included. Follows the same basic calculations as for the SMA except uses a WMA instead. Honestly, it makes little sense to combine both linear and volume weighting in this manner, included only for completeness and because it can easily be done. It may be the case that a superior composite could be created with some more complex calculations, in which case i may add that later. For now though this will do.
An additional 'volume filter' option is included, which applies a basic filter to the volume prior to calculation. For types based around the SMA/VWMA system, the volume filter is a WMA-4, for types based around the RMA/EVWMA system the filter is a RMA-2.
As and when i add more they will be listed in the updates at the bottom.
WEIGHTED INPUTS
The ohlc method of source calculations is really a leftover from a time when data was far more limited. Nevertheless it is still the method used in charting and for the most part is sufficient. Often the only important value is 'close' although sometimes 'high' and 'low' can be relevant also. Since we are volume weighting however, it can be useful to incorporate as much information as possible. To that end either 'hlc3' or 'hlcc4' tend to be the best of the defaults (in the case of 24/7 charting like crypto or intraday trading, 'ohlc4' should be avoided as it is effectively the same as a lagging version of 'hlcc4'). There are many other (infinitely many, in fact) possible combinations that can be created, i have included a few here.
The premise is fairly straightforward, by subtracting one value from another, the remaining difference can act as a kind of weight. In a simple case consider 'hl2' as simply the midrange ((high+low)/2), instead of this using 'high+low-open' would give more weight to the value furthest from the open, providing a good estimate of the median. An even better estimate can be achieved by combining that with 'high+low-close' to give the included result 'hl-oc2'. Similarly, 'hlc3' can be considered the basic mean of the three significant values, an included weighted version 'hlc2-o2' combines a sum with subtraction of open to give an estimated mean that may be more accurate. Finally we can apply a similar principle to the close, by subtracting the other values, this one potentially gets more complex so the included 'cc-ohlc4' is really the simplest. The result here is an overbias of the close in relation to the open and the midrange, while in most cases not as useful it can provide an estimate for the next bar assuming that the trend continues.
Of the three i've included, hlc2-o2 is in my opinion the most useful especially in this context, although it is perhaps best considered to be experimental in nature. For that reason, i've kept 'hlcc4' as the default for both MAs.
Additionally included is an 'aux input' which is the standard TV source menu and, where possible, can be set as outputs of other indicators.
THE SYSTEM
This one is fairly obvious and straightforward. It's just a moving average crossover with additional deviation (bollinger) bands. Not a lot to explain here as it should be apparent how it works.
Of the two, MA1 is considered to be the fast and MA2 is considered to be the slow. Both can be set with independent inputs, types and weighting. When MA1 is above, the colour of both is green and when it's below the colour of both is red. An additional gradient based fill is there and can be adjusted along with everything else in the visuals section at the bottom. Default alerts are available for crossover/crossunder conditions along with optional marker plots.
MA2 has the option for deviation bands, these are calculated based upon the MA type used and volume weighted according to the main parameter. In the case of a unweighted SMA being used they will be standard Bollinger bands.
An additional 'source direct' price tracker is included which can be used as the basis for an alert system for price crossings of bands or MAs, while taking advantage of the available weighted inputs. This is displayed as a stepped line on the chart so is also a good way to visualise the differences between input types.
That just about covers it then. The likelihood is that you've used some sort of moving average cross system before and are probably still using one or more. If so, then perhaps the additional functionality here will be of benefit.
Thanks for looking, I welcome any feedack
Komut dosyalarını "track" için ara

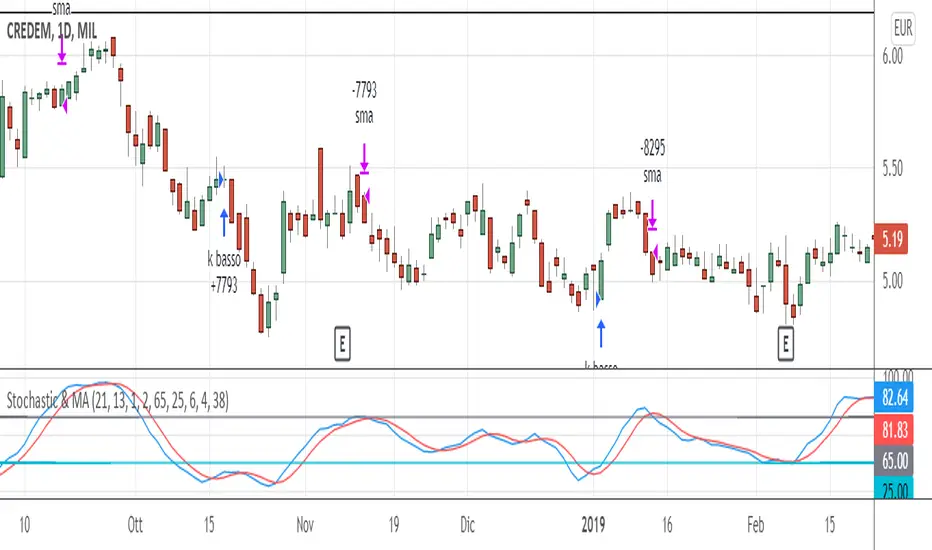
Stochastic & MAThis trading system comes from the experience of having a "fast" signal for entry at low prices (such as the stoscastic) and then "following" the stock with a "slower" indicator such as the exponential moving average. Both the input and output signals are filtered.
The use of the trading system only carries out long operations and has been tested on shares and ETFs, including indices, on daily bases (End Of Day).
ENTRY CONDITION: when stochastic's k is higher than d (on the default value of 21 periods) we enter the lower part of the oversold, to which we apply a filter or the confirmation that the closing of the day of the crossing is higher than that of the n -th previous bar (the 2nd previous bar recommended).
Other default settings are k = 6 and d = 4; the oversold level is also customizable (recommended = 25).
EXIT CONDITIONS: once the entry has "gone well", we follow the upward trend of the stock not with a stochastic oscillator - which tends to exit too soon, especially in case of strong trends - but with a simple moving average exponential (by default at 38 periods). Also in this case a filter is added, that is, k must be> to a filter threshold (recommended = 65) which is used to distinguish the decline between a "physiological" tracking. "(k drops" slowly "together with the approach of prices to the moving average) from a more" violent "tracking (prices are below the moving average and k consequently fall" suddenly ", in a few bars).
MONEY MANAGEMENT: 13% stop loss inserted (the physiological level of tracking of the shares is generally max 8-12% so we also consider a 1% margin due to trading). For more volatile stocks, the level can be extended to 20%.
LEVERAGE: the default value is equal to 1, but it is advisable, for simulations on shares, to use higher levers (x2, x3, ...) if you trade the relative CFD or on the index in case of buying and selling of Leveraged ETFs (e.g. LEVMIB which is 2x leveraged ETFs on Italian index).
[blackcat] L5 Whale Jump Screener 25 NoAlertsLinkage Authorization:
When you obtain any one of the following technical indicators authorization, the other one will automatically obtain a free authorization for the same length of time:
1. L5 Whale Jump Screener 25 NoAlerts
2. L5 Whale Jump Screener 12 Alerts
Discount Authorization:
While you are authorized for any of the following technical indicators, this indicator will only need to pay 200TVC (not per month) but you obtain the authorization length as long as your longest one among all invited-only indicators .
1. L5 Whales Jump Out of Ocean X
2. L5 Zen Master
Level: 5
Background:
L5 Whale Jump Screener 25 NoAlerts is a screeener which is based on principle of L5 Whales Jump Out of Ocean X, but it has its own scheme to work as a screener, which can track 25 trading pairs at the same time. With this indicator, you will see an overall market state if your inputs are major instruments in a specific market via a colorful heat map.
Function:
By tracking multiple targets in the same section can help you increase confidence level of trading because most targets move to the same direction witin the same section. It provides a macro picture to support you know the background of your trading. Also, you can choose your trading target by comparing with others in the same section to make a better decision.
Inputs:
25 tickerids for your customization
Key Signal:
Long Whales / Banker Pump--> fuchsia color area with 0% transparency
Close Long Whales / Close Banker Pump--> red color area with 0% transparency
Short Whales / Banker Dump --> yellow color area with 0% transparency
Close Short Whales / Close Banker Dump --> green color area with 0% transparency
Long Waves Start--> fuchsia color area with 50% transparency
Short Waves Start --> yellow color area with 50% transparency
No Whale or Wave Signal --> gray color rea with 50% transparency
Pros and Cons:
ONLY suitable for discretionary trading, and does NOT support automatic trading system/bots with alerts.
Intuitive and effective, the output signal is more reliable after multi-indicator resonance
For who need alert function, you can choose anther indicator: L5 Whale Jump Screener 12 Alerts.
Why 25 Targets are Supported?
From the principle of TV principle, it should be possible to track up to 40 targets at the same time. However, TV has another condition that restricts server computing resources. When the two condition work at the same time, for the whale jump algorithm, the number of targets it can track at the same time will drop from 40 to about 26~27! In addition, this indicator needs to support the display function from the daily time frame to the 1min time frame. Therefore, the requirements for computing resources have further deteriorated. In the end, the maximum tracking number I obtained by compromise is 25 to ensure that this indicator can support 1min or second level normal display without report an error.
Remarks:
My third L5 indicator published
Closed-source
Invite-only
Redeem Fee Life Lock Guarantee
Although I take the efforts to inform the script requesters that the best way to promote trading skills is to learn from the open source scripts I released by themself and to improve their PNIE script programming skills, there are still many people asking how to obtain or pay to use BLACKCAT L4/L5 private scripts. In fact, I do not encourage people to use Tradingview Coins ( TVC ) / Cryptocurrency to redeem the right to use BLACKCAT L4/L5 scripts. However, redeeming private script usage rights through TV Coins/ Cryptocurrency may be an effective way to force more people to learn PINE script programming seriously. And then I can concentrate on answering more valuable community questions instead of being overwhelmed by L4/L5 scripting permission reqeusts.
I would like to announce a ‘Redeem Fee Lock Guarantee’ program to further simplify the L4/L5 indicator/strategy utility offering and distinguish itself from the competition. ‘Redeem Fee lock guarantee’ is one of the major initiatives by BLACKCAT as a part of overall value packaging designed to guard BLACKCAT’s followers’ against cost-overruns and operational risks usually borne by them when it comes to PINE script innovation ecosystem. The TVCs redeemed for L4/L5 a follower signs up for with BLACKCAT is their guaranteed lifetime locked in TVC Quantity/ cryptocurrency, with no special conditions, exclusions and fine print whatsoever. Based on this scheme, I can constantly refine, expand, upgrade and improve PINE script publishing to ensure the very best experiences for my followers. The 'Redeem Fee Lock Guarantee' is a step in the direction of rewarding the valuable followers. NOTE: Every L4/L5 script redeeming service is ONLY limited to TVC or Cryptocurrency ("Win$ & Donate w/ This" Addresses displayed on script page) redeeming which the 1st signed up TVC Qty/ equivalent cryptocurrency is the lifetime offered TVC Qty/ equivalent crypto.
How to subscrible this indicator?
The script subscription period only has two options of one month or one year, and its price is floating. The latest price of the script subscription is proportional to the number of likes/agrees this script has already received. Therefore, the price of subscribing to this script shows an increasing trend, and the earliest subscribers can enjoy the price of lifetime lock to this script. As the number of likes / agrees of this script increases, the subscription fee for one month and one year will also increase linearly. Whatever, the first subscription price of the use will be locked for life.
Monthly subscription and annual subscription can be done either by tradingview coins ( TVC ) or by converting into equivalent cryptocurrency at the exchange rate (1TVC=0.01USD) for redeem.
TVC payment needs to pay TVC directly in the comments under this script. Every time I authorize a new user, I will update the latest number of subscribed users and latest price for next subscription under the script comment. If there are any conflicting scenario happened to the rules and my update. My updated price based on the rule will be the final price for next subscription. The following subscribers need to pay the corresponding amount of TVC or cryptocurrency in accordance with the latest number of users and price announced by me in accordance with the rules published.
TVC redemption is the method I strongly recommend, and I hope you can complete the redemption in the comment area of this script. This is like a blockchain structure, each comment is a block, each subscription is a chain, which is conducive to open and transparent publicity and traceability to avoid unnecessary disputes.
Monthly Subscription Charges
500TVC <50 Agrees (A)
50A<850TVC<100A
100A<1000TVC<150A
150A<1350TVC<200A
200A<1500TVC<250A
250A<1850TVC<300A
300A<2000TVC<350A
350A<2350TVC<400A
400A<2500TVC<450A
450A<2850TVC<500A
500A<3000TVC<550A
550A<3350TVC<600A
600A<3500TVC<650A
650A<3850TVC<700A
700A<4000TVC<750A
750A<4350TVC<800A
800A<4500TVC<850A
850A<4850TVC<900A
900A<5000TVC<950A
950A<5350TVC<1000A
1000A<5500TVC<1050A
And so on...
Annual Subscription Charges
5000TVC <50 Agrees (A)
50A<8500TVC<100A
100A<10000TVC<150A
150A<13500TVC<200A
200A<15000TVC<250A
250A<18500TVC<300A
300A<20000TVC<300A
350A<23500TVC<400A
400A<25000TVC<450A
500A<28500TVC<550A
500A<30000TVC<550A
550A<33500TVC<600A
600A<35000TVC<650A
650A<38500TVC<700A
700A<40000TVC<750A
750A<43500TVC<800A
800A<45000TVC<850A
850A<48500TVC<900A
900A<50000TVC<950A
950A<53500TVC<1000A
1000A<55000TVC<1050A
And so on...

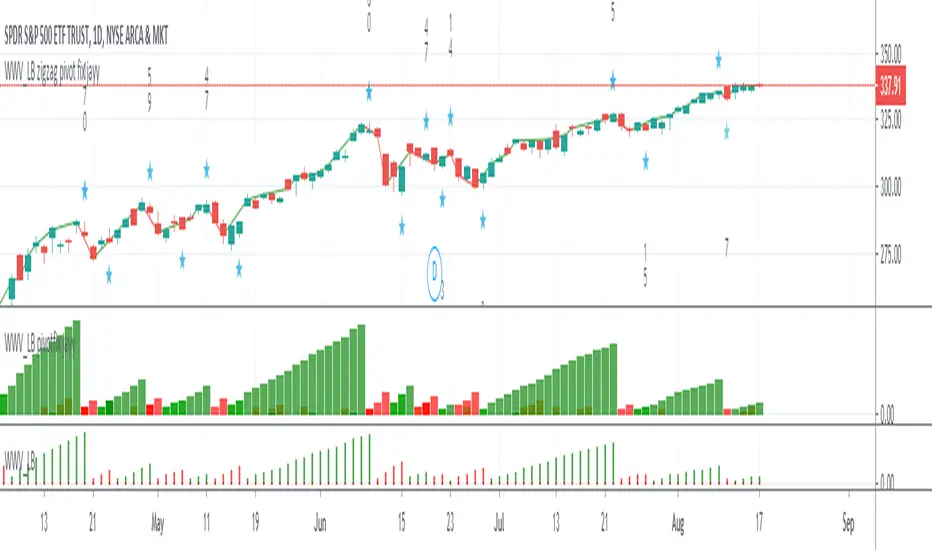
WWV_LB zigzag pivot fix jayyThis is a zigzag version of LazyBear's WWV_LB. In order to plot the WWV_LB as a zigzag, it made sense to me to set the zigzag pivot at the true WWV_LB low or high pivot bars as opposed to the "pivot" bars plotted by the original WWV_LB script. The pivot point identified in the WWV_LB script is actually the point at which a wave reversal is confirmed as opposed to the true script pivot point. Confirmation of a wave reversal can, at times, lag the true pivot by a few bars especially as trendDetectionLength values increase above "1". The WWV_LB script calculates cumulative volume from wave reversal confirmation bar to wave reversal confirmation bar as opposed to the actual/true WWV_LB reversal pivot bar to reversal pivot bar. As such the waves plotted by the original and this pivot fixed scripts not only look slightly different but can also have different cumulative volumes. Confirmation of a wave reversal can lag a few bars behind the true pivot point.
The following critical lines of the original WWV_LB script determine when a wave reverses, both the true pivot and the confirmation point:mov = close>close ? 1 : close
Multi SMA EMA WMA HMA BB (4x3 MAs Bollinger Bands) Pro MTF - RRBMulti SMA EMA WMA HMA 4x3 Moving Averages with Bollinger Bands Pro MTF by RagingRocketBull 2018
Version 1.0
This indicator shows multiple MAs of any type SMA EMA WMA HMA etc with BB and MTF support, can show MAs as dynamically moving levels.
There are 4 MA groups + 1 BB group. You can assign any type/timeframe combo to a group, for example:
- EMAs 50,100,200 x H1, H4, D1, W1 (4 TFs x 3 MAs x 1 type)
- EMAs 8,13,21,55,100,200 x M15, H1 (2 TFs x 6 MAs x 1 type)
- D1 EMAs and SMAs 12,26,50,100,200,400 (1 TF x 6 MAs x 2 types)
- H1 WMAs 7,77,231; H4 HMAs 50,100,200; D1 EMAs 144,169,233; W1 SMAs 50,100,200 (4 TFs x 3 MAs x 4 types)
- +1 extra MA type/timeframe for BB
compile time: 25-30 sec
full redraw time after parameter change in UI: 3 sec
There are several versions: Simple, MTF, Pro MTF, Advanced MTF and Ultimate MTF. This is the Pro MTF version. The Differences are listed below. All versions have BB
- Simple: you have 2 groups of MAs that can be assigned any type (5+5)
- MTF: +2 custom Timeframes for each group (2x5 MTF)
- Pro MTF: +4 custom Timeframes for each group (4x3 MTF), MA levels and show max bars back options
- Advanced MTF: +2 extra MAs/group (4x5 MTF), custom Ticker/Symbol, backreferences for type, TF and MA lengths in UI
- Ultimate MTF: +individual settings for each MA, custom Ticker/Symbols
Features:
- 4x3 = 12 MAs of any type including Hull Moving Average (HMA)
- 4x MTF groups with step line smoothing
- BB +1 extra TF/type for BB MAs
- 12 MA levels with adjustable group offsets, indents and shift
- show max bars back
- you can show/hide both groups of MAs/levels and individual MAs
Notes:
1. based on 3EmaBB, uses plot*, barssince and security functions
2. you can't set certain constants from input due to Pinescript limitations - change the code as needed, recompile and use as a private version
3. Levels = trackprice implementation
4. Show Max Bars Back = show_last implementation
5. uses timeframe textbox instead of input resolution to allow for 120 240 and other custom TFs. Also supports TFs in hours: 2H or H2
6. swma has a fixed length = 4, alma and linreg have additional offset and smoothing params
7. Smoothing is applied by default for visual aesthetics on MTF. To use exact ma mtf values (lines with stair stepping) - disable it
MTF Notes:
- uses simple timeframe textbox instead of input resolution dropdown to allow for 120, 240 and other custom TFs, also supports timeframes in H: 2H, H2
- Groups that are not assigned a Custom TF will use Current Timeframe (0).
- MTF will work for any MA type assigned to the group
- MTF works both ways: you can display a higher TF MA/BB on a lower TF or a lower TF MA/BB on a higher TF.
- MTF MA values are normally aligned at the boundary of their native timeframe. This produces stair stepping when a higher TF MA is viewed on a lower TF.
Therefore X Y Point Density/Smoothing is applied by default on MA MTF for visual aesthetics. Set both to 0 to disable and see exact ma mtf values (lines with stair stepping and original mtf alignment).
- Smoothing is disabled for BB MTF bands because fill doesn't work with smoothed MAs after duplicate values are replaced with na.
- MTF MA Value fluctuation is possible on the current bar due to default security lookahead
Smoothing:
- X,Y == 0 - X,Y smoothing disabled (stair stepping on high TFs)
- X == 0, Y > 0 - X,Y smoothing applied to all TFs
- Y == 0, X > 0 - X smoothing applied to all TFs < deltaX_max_tf, Y smoothing disabled
- X > 0, Y > 0 - Y smoothing applied to all TFs, then X smoothing applied to all TFs < deltaX_max_tf
X Smoothing with Y == 0 - shows only every deltaX-th point starting from the first bar.
X Smoothing with Y > 0 - shows only every deltaX-th point starting from the last shown Y point, essentially filling huge gaps remaining after Y Smoothing with points and preserving the curve's general shape
X Smoothing on high TFs with already scarce points produces weird curve shapes, it works best only on high density lower TFs
Y Smoothing reduces points on all TFs, removes adjacent points with prices within deltaY, while preserving the smaller curve details.
A combination of X,Y produces the most accurate smoothing. Higher delta value - larger range, more points removed.
Show Max Bars Back:
- can't set plot show_last from input -> implemented using a timenow based range check
- you can't delete/modify history once plotted, so essentially it just sets a start point for plotting (from num_bars bars back) that works only in realtime mode (not in replay)
Levels:
You can plot current MA value using plot trackprice=true or by checking Show Price Line in Style. Problem is:
- you can only change color (not the dashed line style, width), have both ma + price line (not just the line), and it's full screen wide
- you can't set plot trackprice from input => implemented using plotshape/plotchar with fixed text labels serving as levels
- there's no other way of creating a dynamic level: hline, plot, offset - nothing else works.
- you can't plot a text var - all text strings must be constants, so you can't change the style, width and text labels without recompiling.
- from input you can only adjust offset, indent and shift for each level group, and change color
- the dot below each level line is the exact MA value. If you want just the line swap plotshape with plotchar, recompile and save as your private version, adjust Y shift.
To speed up redraw times: reduce last_bars to ~2000, recompile and use as your own private version
Pinescript is a rudimentary language (should be called Painscript instead) that can basically only plot data. You can't do much else. Please see the code for tips and hints.
Certain things just can't be done or require shady workarounds and weeks of testing trying to resolve weird node.js compiler errors.
Feel free to learn from/reuse/change the code as needed and use as your own private version. See comments in code. Good Luck!

ICT Advanced Entry Models & Market Analysis# ICT Advanced Entry Models & Market Analysis
**🏆 The Most Comprehensive ICT (Inner Circle Trader) Indicator Available**
Transform your trading with this institutional-grade Pine Script that combines **12 advanced ICT entry models** with professional risk management and multi-timeframe analysis. Developed for serious traders who want confluence-based signals with complete market context.
## 🎯 **Core Features**
### **12 Enhanced ICT Entry Models**
- ✅ **Optimal Trade Entry (OTE)** - Enhanced Fibonacci retracements with volume confirmation
- ✅ **Silver Bullet** - London/NY session directional moves with regime filtering
- ✅ **Unicorn Model** - Liquidation + FVG + Order Block triple confluence
- ✅ **Fair Value Gap (FVG) Entry** - Gap mitigation tracking with confluence zones
- ✅ **Order Block Entry** - Enhanced with mitigation levels and volume validation
- ✅ **Breaker Block Entry** - Failed order blocks with trend confirmation
- ✅ **Stop Hunt Entry** - Institutional liquidity grabs with volume spikes
- ✅ **Liquidity Grab Entry** - Equal highs/lows with multiple touch confirmation
- ✅ **Market Maker Model** - AMD cycle with session-based phases
- ✅ **Power of 3** - Distribution phase entries with volume validation
- ✅ **Judas Swing** - False breakout reversals in first hour
- ✅ **Asian Range Breakout** - London session range expansion
### **Advanced Confluence System**
- 🎯 **Weighted Model Scoring** - Customize importance of each model
- 📊 **Multi-Factor Analysis** - Structure + trend + volatility alignment
- ⭐ **Signal Quality Ratings** - HIGH/MEDIUM/LOW probability assessments
- 🎪 **Threshold Filtering** - Only shows signals above your confidence level
### **Professional Risk Management**
- 💰 **Dynamic Position Sizing** - Automatic calculation based on account risk
- 🛑 **Structure-Based Stops** - Intelligent stop placement beyond swing points
- 🎯 **Multiple Take Profits** - 1.5R, 2.5R, and 4R targets
- 📈 **Risk-Reward Filtering** - Only signals with acceptable R:R ratios
- 💹 **Visual Trade Planning** - Entry, stop, and target levels on chart
### **Multi-Timeframe Analysis**
- 📅 **Higher Timeframe Structure** - 4H bias confirmation
- ⏱️ **Lower Timeframe Entries** - 15min precision timing
- 🎯 **Structure Alignment** - Only trade when timeframes agree
- 📊 **Cross-Timeframe Confluence** - Enhanced signal validation
## 🧠 **Market Intelligence**
### **Market Regime Detection**
- 📈 **Trending vs Ranging** - ADX-based market state analysis
- 🌊 **Volatility Regimes** - High/low/normal volatility identification
- 🎛️ **Adaptive Strategies** - Different model weights for different conditions
- 🎯 **Session Momentum** - Volume-based session strength analysis
### **Enhanced Market Structure**
- 🔍 **BOS vs CHoCH** - Precise break of structure vs change of character
- ⚡ **Swing Failures** - Failed high/low attempts (reversal signals)
- 📐 **Internal Structure** - Lower timeframe confirmation
- 🎪 **Premium/Discount Zones** - Enhanced with extreme levels
### **Fair Value Gap Innovation**
- 📦 **Mitigation Tracking** - Gaps become invalid when filled
- 🎯 **Confluence Zones** - Multiple overlapping gaps identified
- 📏 **Size Filtering** - Only significant gaps (customizable pip size)
- 🔄 **Real-Time Updates** - Dynamic gap management with arrays
## 📊 **Visual Excellence**
### **Professional Chart Display**
- 🎨 **Color-Coded Confluence** - Visual strength indicators
- 📋 **Comprehensive Info Table** - All key market data at a glance
- 🎯 **Signal Quality Labels** - Clear HIGH/MEDIUM/LOW ratings
- 📊 **Risk Management Display** - Entry, stop, targets on chart
### **Session & Time Analysis**
- 🌏 **Kill Zone Backgrounds** - Asian/London/NY sessions
- ⏰ **Macro Time Highlighting** - Key institutional activity periods
- 🥈 **Silver Bullet Times** - High-probability directional moves
- 🌐 **DST Auto-Adjustment** - Accurate timing year-round
### **Enhanced Visual Elements**
- 📦 **Order Block Tracking** - Active vs mitigated blocks
- 📊 **FVG Visualization** - Confluence zones with thickness indication
- 📈 **Structure Labels** - BOS/CHoCH/SF clearly marked
- 🎯 **Probability Heatmap** - High-frequency price zones
## 🎛️ **Customization & Control**
### **Model Weighting System**
- ⚖️ **Individual Weights** - Customize each model's importance
- 🎯 **Confluence Threshold** - Set minimum score for signals
- 📊 **Quality Control** - Filter signals by your criteria
- 🎪 **Strategy Adaptation** - Adjust weights based on backtesting
### **Risk Management Settings**
- 💰 **Account Size Input** - Set your trading capital
- 📊 **Risk Per Trade** - Percentage risk (0.1% to 5%)
- 🎯 **Minimum R:R** - Only show trades above your threshold
- 📈 **Position Size Display** - Automatic lot size calculation
## 📈 **Performance Tracking**
### **Built-in Analytics**
- 📊 **Win Rate Monitoring** - Track success over time
- 💹 **Average Return** - R:R performance tracking
- 📉 **Maximum Drawdown** - Risk assessment metrics
- 🎯 **Model Performance** - See which models work best
### **Advanced Alerts**
- 🚨 **Tiered Alert System** - High/Medium/Low probability
- 🎯 **Model-Specific Alerts** - Individual setup notifications
- 📊 **Structure Change Alerts** - BOS/CHoCH notifications
- ⚠️ **Risk Management Warnings** - Poor R:R alerts
## 🚀 **Why This Indicator is Different**
### **Institutional Approach**
- 🏦 Built using **actual ICT concepts** from institutional trading
- 📊 **Multi-model confluence** instead of single-indicator reliance
- 🎯 **Risk-first mentality** with position sizing integration
- 📈 **Professional-grade** market structure analysis
### **Complete Trading System**
- 🎪 Not just signals - complete **market analysis framework**
- 💰 **Integrated risk management** for proper position sizing
- 📊 **Performance tracking** to refine your approach
- 🎯 **Multi-timeframe** analysis for institutional-level precision
### **Proven ICT Methodology**
- ✅ **Optimal Trade Entry** zones for high-probability entries
- 🥈 **Silver Bullet** setups during institutional activity times
- 🦄 **Unicorn Model** for maximum confluence trades
- 📦 **Order Block** and **Fair Value Gap** precision timing
## 📚 **Perfect For**
- 💼 **Serious Forex Traders** using ICT methodology
- 📈 **Indices Traders** (ES, NQ, etc.) seeking institutional setups
- 🎯 **Swing Traders** wanting multi-timeframe confluence
- 📊 **Day Traders** needing precise entry timing
- 🏦 **Anyone learning** institutional trading concepts
## ⚙️ **Easy Setup**
1. **Add to Chart** - Works on any timeframe (15min recommended)
2. **Set Risk Parameters** - Account size and risk percentage
3. **Customize Weights** - Adjust model importance to your style
4. **Enable Alerts** - Get notified of high-probability setups
5. **Start Trading** - Use confluence scoring for better decisions
## 🎓 **Educational Value**
- 📚 **Learn ICT Concepts** - Visual representation of all key models
- 🎯 **Understand Confluence** - See how multiple factors align
- 💰 **Risk Management Training** - Learn proper position sizing
- 📊 **Market Structure Education** - Identify BOS, CHoCH, and more
---
**⚡ Transform your trading today with the most advanced ICT indicator available. Stop guessing and start trading with institutional-level market analysis and risk management.**
*Compatible with all markets: Forex, Indices, Commodities, Crypto*
*Recommended timeframes: 15min to 4H for optimal performance*
---
**🔥 Don't just trade - trade with institutional intelligence and proper risk management. Your account will thank you.**

Valid H/L Strategy Tester with MFE/MAE Analytics
## Overview
A data-driven trading indicator that identifies valid high/low price levels and provides statistical insights through Maximum Favorable Excursion (MFE) and Maximum Adverse Excursion (MAE) analytics. Make informed trading decisions based on historical price behavior rather than guesswork.
## Key Features
### 🎯 Smart Pattern Recognition
- Automatically detects valid highs and lows with confirmation system
- Color-coded candles and lines for clear visual identification
- Inside/Outside print filtering for higher probability setups
### 📊 Statistical Analytics
- Analyzes up to 500 historical setups for MFE/MAE calculations
- 1-hour and 3-hour timeframe data with percentile-based targets (20th, 50th, 80th)
- Real-time performance tracking with comprehensive statistics table
### ⚙️ Flexible Strategy Options
**Entry Methods:** Confirmation-based or MAE percentile entries
**Take Profit:** MFE-based, fixed points, percentage, or R:R ratio targets
**Risk Management:** Multiple stop loss types with position sizing controls
### 🕐 Advanced Time Filtering
- Session filters (Asia, London, New York)
- Individual hourly controls (24-hour precision in ET)
- Pre-configured for optimal NY trading hours (9 AM - 2 PM)
### 📈 Visual Dashboard
- MFE target lines (blue) and MAE risk lines (orange)
- Customizable colors, styles, and line weights
- Statistics table showing daily/hourly/weekly performance breakdowns
## How It Works
1. **Pattern Detection** - Scans for valid high/low formations using price structure and gap behavior
2. **Statistical Analysis** - Calculates historical MFE/MAE percentiles from past setups
3. **Trade Framework** - Executes entries/exits based on your configuration with real-time performance tracking
## Ideal For
- **Day/Swing Traders** seeking data-driven entry/exit levels
- **Risk Managers** wanting historical drawdown data for stop placement
- **Performance Trackers** needing detailed analytics across timeframes and sessions
- **Flexible Strategies** - adapts to scalping, day trading, or swing trading styles
## Quick Setup
1. Select analysis timeframe (default: 5-minute)
2. Choose entry method and exit strategy
3. Enable MFE/MAE analytics display
4. Apply session/hourly filters
5. Customize visual elements and table settings
Transform your trading from guesswork to statistical precision with historical price behavior insights.

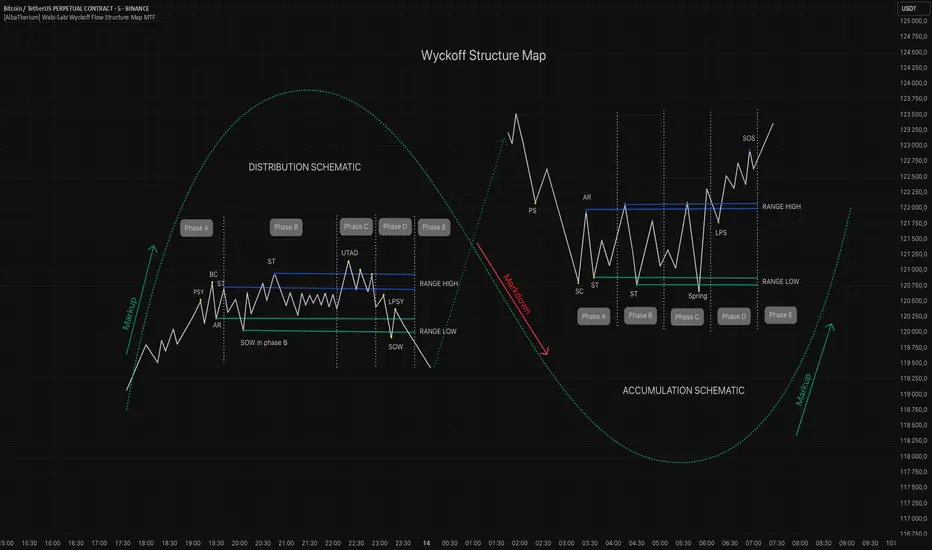
[AlbaTherium] Wabi-Sabi Wyckoff Flow Structure Map MTF[1.0.42] Wabi-Sabi Wyckoff Flow Structure Map
Master the Hidden Geometry of Market Campaigns – Accumulation, Distribution, and the Laws That Govern Them
Introduction
The Wabi-Sabi Wyckoff Flow Structure Map is a software-engineered analytical framework that visualizes the flow of institutional market behavior through the lens of the Wyckoff Method. This tool automates the detection of trading ranges, maps the phases of accumulation/distribution, and extrapolates price objectives .
The Wabi-Sabi Wyckoff Flow Structure Map is a meticulous implementation of the principles of Richard D. Wyckoff , interpreted through the lens of market structure and volume dynamics. This tool aims to identify, contextualize, and map out accumulation and distribution zones by interpreting the composite operator's intended path in financial markets.
It is not merely an indicator-it is a structural compass, guiding you through the architecture of smart money campaigns.
Chapter 1: The Architecture of Market Campaigns
1.1 From Noise to Narrative
Markets do not move randomly. They are orchestrated campaigns-methodically executed by informed operators. The identifies these campaigns as they unfold across:
Accumulation
Markup
Distribution
Markdown
Each is grounded in Wyckoff’s structural logic and revealed in real time.
1.2 Who Is the Composite Operator, Composite Man?
The Composite Operator (CO), Composite Man (CM) represents dominant market participants-institutions with the capacity to engineer price movement. By dissecting trading ranges, the script deciphers their behavior through:
Event-based mapping (SC, ST, Spring, AR, UTAD, etc.)
Phase progression (Phase A to E)
PnF-based directional forecasting
The CO leaves footprints. This script reads them.
Chapter 2: Wyckoff’s Core Laws, Brought to Life
2.1 The Law of Supply and Demand
Every price bar reflects this law. The tool highlights where supply is absorbed and demand emerges, revealing the true balance of power behind the chart.
2.2 The Law of Cause and Effect
Accumulation and distribution ranges are not noise-they are preparation. By measuring their width, the script calculates PnF-based targets for the post-breakout phase, offering traders quantified projections rooted in structure.
2.3 The Law of Effort vs. Result
Effort = volume.
Result = price movement.
Discrepancies between the two-expose market turning points.
This script captures those moments within Wyckoff's structural context, not isolated volume spikes.
Chapter 3: Real-Time Interpretation of Trading Ranges
3.1 Automatic Schematic Mapping
The tool auto-generates Wyckoff structures:
Detects and maps Trading Ranges dynamically
Labels Wyckoff events (SC, ST, AR, Spring, UT, LPS, etc.)
Identifies current phase (Phase B, C, D, E) via real-time bias detection
3.1.1.Core Components
a. Structural Framing
The script autonomously detects the boundaries of a trading range (TR), guided by pivot highs and lows derived from Volume Spread Analysis (VSA) dynamics and price behavior.
b. Automatic Rally (AR) & Selling Climax (SC)
These foundational events are systematically computed and highlighted using volume-weighted price interaction. The Selling Climax defines the lower bound of the TR, while the Automatic Rally sets the resistance zone.
c. Secondary Tests (ST)
The algorithm traces the STs to validate demand/supply balance and the structural integrity of the TR. These are tagged with precision to avoid false positives.
d. Spring / Upthrust Actions
Wyckoffian springs and upthrusts are flagged using deviations below support (spring) or above resistance (upthrust) coupled with volume exhaustion or climax events.
e. Creek & Ice Visualization
Inspired by Wyckoff’s narrative metaphor, the script maps the 'Creek' (High of the Range flow) and 'Ice' (Low of the Range flow), guiding the observer through breakout or breakdown conditions.
f. Sign of Strength (SOS) / Sign of Weakness (SOW)
These turning points are confirmed via expansion in spread and volume. SOS is a bullish confirmation of accumulation resolution, while SOW indicates bearish continuation.
g. LPS & LPSY
The Last Point of Support (LPS) and Last Point of Supply (LPSY) are precisely mapped post-confirmation of breakout or breakdown. Their presence strengthens the bias of the ongoing structural phase.
h. Phase Annotation
Each zone within the TR is annotated based on Wyckoff’s five-phase logic (A to E). This includes climactic action in Phase A, testing in Phase B, spring/UTAD in Phase C, confirmation in Phase D, and exit in Phase E.
3.2 Multi-Timeframe Tracking
Observe the interplay of nested structures across several timeframes. Whether you’re tracking a micro accumulation on 1-min or macro distribution on the 1H, the script integrates both for a full-spectrum view.
3.3 Point-and-Figure Price Targeting
Using Wyckoff’s Law of Cause and Effect, the tool projects price targets based on the range width. Outputs are displayed directly on the chart, aiding in:
Profit-taking zones
Invalidations
R/R planning with structure-based confidence
Chapter 4: Applying Like a Wyckoffian
4.1 Configuration Best Practices
Timeframes: 1–5min for tactical intraday, 15min–4H for swing campaigns
Detection Radius: Control how deep the script searches for structural pivots
Modes: Choose between Delta (volume shifts) and Normal (price formations)
4.2 Dashboard & Event Tracker
The Bias Dashboard displays:
The current dominant phase (e.g. “Phase C Test” or “Late Phase D”)
Key events (AR, ST, Spring, LPS)
Whether current price action supports a continuation or Climax
4.3 Alerts and Customization
Configure alerts to monitor:
New TR detection across up to 6 timeframes
Key structural events like Spring, UTAD, or SOS
Completion of cause zones with target projection triggered
Chapter 5: Use Cases and Strategic Implementation
5.1 Spotting Reversals Before the Breakout
Use the script to:
Enter near Springs (accumulation) or UTADs (distribution)
Identify retests as Last Points of Support/Resistance
Confirm or invalidate breakout attempts using the schematic context
5.2 Confirming Institutional Engagement
Recognize institutional footprints through:
Multiple STs (Testing for supply)
Strong SOS, SOW / LPS combinations
Absence of follow-through = Absorption
The Flow Map helps distinguish retail chase from professional intent.
Conclusion
The Wabi-Sabi Wyckoff Flow Structure Map is an elite market structure decoder for traders who operate on logic, not emotion. Grounded in Wyckoff’s time-tested methodology and enhanced with modern automation, it transforms the invisible structure of price action into a readable, tradeable roadmap.
“Structure precedes movement. Those who read structure, anticipate motion. Those who chase motion, miss the meaning .
”
- A Wyckoffian Principle
This tool is for traders who understand that preparation is where profits are born-not during the move, but before it."
SMC - OB/Breaker Block/Bos/ChoCh (DeadCat) Based on analyzing your Pine Script code, here are comprehensive descriptions that should comply with TradingView's house rules:
Script 1: "PO3 Liquidity w/ CISD (DeadCat)"
Description:
This indicator implements the Power of Three (PO3) liquidity concept combined with Change in State of Delivery (CISD) pattern recognition for Smart Money Concepts (SMC) trading. The script operates on multi-timeframe analysis using automated timeframe selection.
Core Methodology: The indicator identifies C2 liquidity sweeps by detecting when price breaks previous period highs/lows and then reverses back above/below those levels. It specifically looks for:
C2 Buy Setup: When current low breaks previous period low but closes back above it
C2 Sell Setup: When current high breaks previous period high but closes back below it
CISD Pattern Detection: The script implements sophisticated CISD (Change in State of Delivery) pattern recognition by:
Tracking the first break of previous HTF high/low levels
Identifying imbalance candles (gaps between consecutive candles)
Confirming CISD when price reclaims the imbalance level within 2 HTF periods
Validating setups only when both liquidity sweep AND CISD confirmation occur
Visual Components:
HTF Candles: Displays higher timeframe candle structure on current chart
Trading Zones: Shows zones between HTF open and equilibrium levels
CISD Lines: Marks confirmed change in state of delivery levels
C2/C4 Labels: Identifies liquidity sweep entry points and potential continuation setups
Market Structure: Optional HH/HL/LH/LL pivot markers
Unique Features:
Automatic timeframe calculation (15m→4H, 1H→1D, etc.)
Real-time HTF period countdown
Setup invalidation tracking when stops are hit
Progressive setup confirmation (C2→C4 evolution)
Bias filter for directional trading preferences
Usage: C2 setups provide initial entry opportunities after confirmed liquidity sweeps with CISD confirmation. C4 setups offer additional entries when HTF equilibrium conditions align favorably. The indicator helps traders identify institutional liquidity grabs followed by genuine directional moves.
Script 2: "SMC Toolkit (DeadCat)"
Description:
This comprehensive Smart Money Concepts toolkit provides institutional-level market structure analysis with automated Order Block (OB) and Breaker Block (BB) zone identification, plus Break of Structure (BOS) and Change of Character (ChoCh) detection.
Market Structure Algorithm: The indicator uses a sophisticated pivot-based algorithm to identify and track market structure progression:
Uptrend: HH→HL→HH sequence tracking
Downtrend: LL→LH→LL sequence tracking
Trend Changes: Automatic ChoCh detection when structure breaks occur
Order Block Logic:
Bullish OB Zones: Created at Higher Lows (HL) and Lower Lows (LL) during uptrends
Bearish OB Zones: Created at Lower Highs (LH) and Higher Highs (HH) during downtrends
Uses last bearish candle before bullish moves (and vice versa) to define precise zone boundaries
Breaker Block Logic:
Bullish BB Zones: Former resistance that becomes support after HH/LH breaks
Bearish BB Zones: Former support that becomes resistance after LL/HL breaks
Automatically transitions when structure points are breached
Zone Management: The script employs intelligent zone lifecycle management:
Creates new zones only at confirmed structure points
Makes previous zones transparent when new structure is confirmed
Maintains zone relevance through dynamic extension
Limits total zones to prevent chart clutter
BOS vs ChoCh Detection:
BOS (Break of Structure): Continuation patterns when trend highs/lows are exceeded
ChoCh (Change of Character): Reversal patterns when pullback levels are broken against trend
Requires 2-candle confirmation before finalizing structure changes
Visual Enhancements:
Color-coded zones with transparency controls
Directional arrows (▲/▼) in zone labels
Customizable line styles and text sizing
Clean market structure progression tracking
Originality: This toolkit combines traditional SMC concepts with enhanced zone boundary calculation using multi-candle analysis and intelligent zone lifecycle management, providing more precise entry/exit levels than standard implementations.

X OR AVWAPX OR AVWAP is a multi-layered market mapping tool designed to combine Opening Range analysis, Anchored VWAP (AVWAP) positioning, and SMA markers into a unified visual framework.
Opening Range (OR) Mapping
The indicator supports two independent Opening Ranges, allowing traders to define both a primary range and a micro range for finer analysis. This is particularly effective when viewing lower timeframes, where a smaller OR inside the larger OR reveals intraday microstructure.
OR #1 and OR #2 each have configurable session times, colors, and optional midpoint lines.
Historical OR boxes can be shown or hidden, with the ability to extend levels forward in time.
Optional Fibonacci-based expansion levels (0.5x, 1x, 1.5x, 2x, 3x OR) are available for projecting breakout targets and retracement zones.
Traders can toggle high/low lines, midpoints, and labels independently for cleaner chart presentation.
Anchored VWAP (AVWAP) Layers
To track institutional capital flow and session bias, the indicator offers three separate AVWAP anchors, each independently controlled:
Can be anchored to custom events, sessions, or manual reference points.
Enables granular capital flow mapping down to 4-hour increments, helping traders align intraday trades with broader directional bias.
Each AVWAP can be toggled on/off to avoid clutter and isolate the most relevant flow line for the current setup.
SMA Markers
For additional context, simple moving average markers can be displayed alongside OR and AVWAP structure, helping gauge trend direction and mean-reversion potential.
Use Case
This tool is built for traders who want to combine structure, flow, and trend in a single view. On lower timeframes, the dual OR feature allows for a “range-within-a-range” perspective, revealing short-term liquidity pockets inside the day’s primary auction boundaries. The multi-anchor AVWAPs track how price interacts with session-based weighted averages, highlighting points where institutional bias may shift. When combined with SMA markers, the trader gains a comprehensive map for scalping, intraday swing trading, and capital flow tracking.

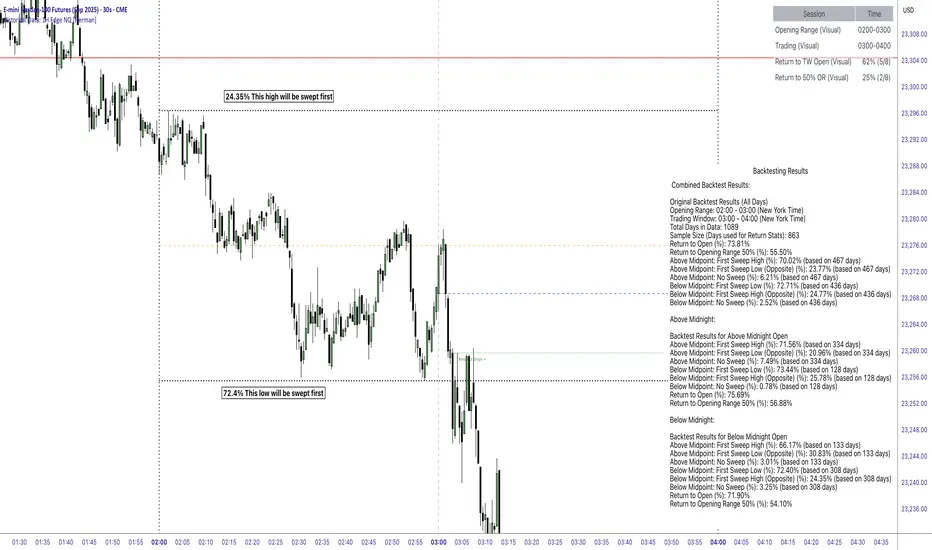
Historical Data: 1H Edge NQ [Herman]Historical Data: 1H Edge NQ
This Pine Script indicator is designed to provide traders with visual tools and historical statistical insights for analyzing hourly price behavior on the Nasdaq-100 futures (NQ) contract.
It focuses on key concepts such as Opening Ranges (OR) and Trading Windows (TW), drawing from established trading principles like session-based ranges and return probabilities.
This unique indicator stands out by incorporating pre-computed statistics derived from over 4 years of 1-minute timeframe data, offering detailed hourly probabilistic insights in an editable sticky note format—making it a distinctive tool for in-depth analysis.
The goal is to help users visualize potential price dynamics and assess historical tendencies, enabling more informed decision-making based on past data patterns.
All calculations are based on historical price action, and the indicator does not make predictions or generate trading signals—it simply displays pre-computed statistics and visual aids for educational and analytical purposes.
Key Features and Visual ElementsVertical Lines for Time Sessions:
Orange Line - Opening Range Midline (50%)
Horizontal Dotted Lines - Opening Range High and Low
Solid Red Line - Midnight Open
Dashed Vertical lines - Opening range and trading window start/close times
Blue Dashed Line - Trading Window Candle Open
The indicator marks the start of the user-selected Opening Range (OR) and Trading Window (TW) with customizable vertical lines.
These represent the time periods where the OR is formed (e.g., 02:00-03:00 NY time) and where trading activity is observed (e.g., 03:00-04:00 NY time).
Users can adjust these sessions via inputs for flexibility across different hours.
-Horizontal Lines for Price Levels:Opening Range High and Low:
-Solid or dashed lines (customizable) show the high and low of the selected OR, extended horizontally to highlight potential support/resistance levels during the TW.
-50% OR Midpoint: An optional dashed line at the midpoint (50%) of the OR, which serves as a reference for mean reversion analysis.
-Trading Window Open Price: A line marking the open price at the start of the TW, useful for tracking returns to this level.
-Midnight Open (Red Line): A dedicated red horizontal line indicating the open price at midnight (00:00 NY time), which acts as a daily reference point for overnight price action.
Statistical Display via Sticky Note and Table:A customizable "Sticky Note" table displays pre-computed backtest results for the selected OR hour, including sections for combined results, above-midnight scenarios, and below-midnight scenarios. Content is user-editable via inputs.
A main info table shows session details, total historical sessions, and probabilities for returns (if enabled).
Customization Options: Users can toggle visuals, adjust colors, styles, widths, positions, and themes (light/dark). The indicator supports up to 500 lines/labels/boxes for historical drawing.
Logic and PrincipleThe indicator operates on a per-hour basis, treating each hour (0-23 NY time) as an independent "session" for analysis:Session Definition:
For any given hour (e.g., 02:00), the OR is the high/low range formed in that hour.
The TW is the subsequent hour where price action is tracked.
Tracking Price Action: During the TW, the script checks if price "sweeps" (crosses) the OR high or low. It then monitors for "returns"—instances where price crosses back to the TW open price or the 50% midpoint of the OR after a sweep.
Statistical Calculation: Probabilities are derived from historical counts:Total sessions: Number of historical days where data was available for that hour.
Return to TW Open: Percentage of sessions where, after sweeping OR high/low, price returned to the TW open (calculated as returns / total sessions with sweeps).
Return to 50% OR: Similar percentage for returning to the OR midpoint.
These are computed cumulatively across all historical bars loaded on the chart, resetting flags daily to ensure independence per session. No real-time predictions are made; stats accumulate from past data.
Midnight Open Integration: The red line resets daily at 00:00 NY, providing context for overnight gaps or continuations.
Breakout Origin: Scans recent bars for conditions where a breakout from OR occurs without opposite direction breach, drawing lines to the origin bar's open for visual reference.
The core principle is rooted in range-based analysis, a common technical approach where traders observe how price interacts with session highs/lows and midpoints.
By quantifying historical return rates after sweeps, the indicator highlights tendencies like mean reversion or continuation, but all insights are retrospective and depend on the loaded data.
Data Source and BacktestingThe statistical data embedded in the sticky notes (e.g., return percentages, sweep rates) was generated using Python in a Jupyter Notebook environment.
It analyzes approximately 1089 days (about 4 years) of 1-minute historical data for NQ futures, sourced BacktestMarket.
The backtests focused on NY time sessions, calculating metrics like:Sweep rates (e.g., first sweep high after above-midpoint open).
Return probabilities post-sweep.
Conditional splits (above/below midnight open).
These pre-computed values are hardcoded into the script via text areas for display, ensuring transparency.
Note: Historical performance is not indicative of future results; this is for analytical reference only.
Purpose and UsageThis indicator aims to assist traders in evaluating price direction potential by combining visual session markers with historical probabilities.
For example:If historical data shows a high probability of returning to the 50% OR after a sweep, it might suggest monitoring for mean reversion.
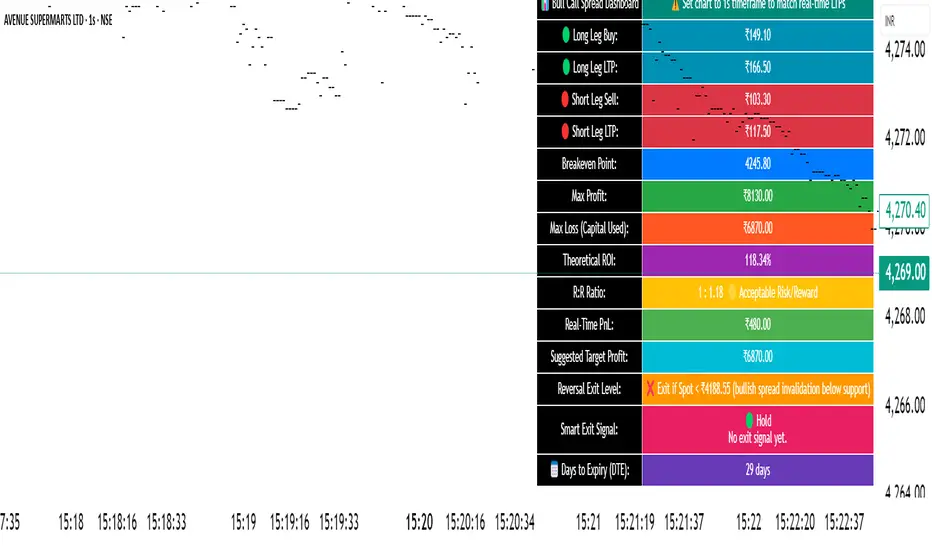
🧠 STWP Dashboard (Bull Call Spread / Bear Put Spread)________________________________________
🧠 STWP Options Strategy Dashboard (Bull Call Spread/ Bear Put Spread)
Author: @simpletradewithpatience
Markets: NSE (India)
Best timeframe: 1-second chart
Built with: Pine Script v5
________________________________________
📌 Overview
A real-time options strategy dashboard tailored for NSE traders, designed for two-leg spreads:
✅ Bull Call Spread → Buy Lower Strike CE, Sell Higher Strike CE
✅ Bear Put Spread → Buy Higher Strike PE, Sell Lower Strike PE
This tool gives you a real-time, color-coded visual interface with:
Entry premiums & breakeven levels
Live LTPs & PnL
ROI & Risk: Reward
Smart Exit logic
Alerts for expiry, Greeks, and PnL events
It’s fully manual, for educational and tracking use only — not for automated trading.
________________________________________
📌 Key Features
✅ Track Bull Call & Bear Put Spreads
✅ Live LTP tracking via symbol input
✅ Real-time PnL, breakeven, max profit/loss
✅ ROI & Risk:Reward calculation
✅ Smart Exit logic with trade verdicts
✅ Invalidation logic with Reversal Exit
✅ Manual input of Greeks (Delta, Gamma, Theta, IV%)
✅ Greek-based alerts for Gamma Risk, IV Crush, Theta Decay
✅ Days to Expiry (DTE) tracking
✅ Fully customizable alert system
✅ Clean, emoji-labelled dashboard UI
✅ Built for Indian NSE options only
✅ Requires 1-second chart for correct data
________________________________________
📌 Option Symbol Inputs (LTP Tracking)
✅ Long Leg Symbol (Buy): Lower strike CE (Bull Call) or higher strike PE (Bear Put)
✅ Short Leg Symbol (Sell): Higher strike CE (Bull Call) or lower strike PE (Bear Put)
✅ Symbol Tips: Use TradingView's dropdown to select NSE option symbols like NSE:RELIANCE25JUL3000CE
⚠️ Providing valid option symbols is crucial — it powers all live tracking and calculations.
________________________________________
📌 Trade Setup Parameters
Spot Price at Entry
Long & Short Strike Prices
Buy Price (Long Leg)
Sell Price (Short Leg)
Lot Size & Number of Lots
Loss Bearable Amount (₹) → Used by Smart Exit logic to issue early warnings
________________________________________
📌 Expiry Date Input
Expiry Year, Month, and Day
🎯 Used to calculate Days to Expiry (DTE) and enable:
⏱️ Expiry alerts like “Less than 2 Days”, “Theta Risk”, and more
📉 Smart Exit logic adjusts based on time decay
________________________________________
📌 Greeks (Optional)
🔹 Default Mode: Don’t Enter Greeks
🔹 Optional Mode: Enter Greeks for both legs (Delta, Gamma, Theta, IV%)
🔍 Enabling Greeks unlocks:
Net Delta, Gamma, Theta, IV
Greek-based warnings (e.g. Gamma Risk, Theta Risk)
A dashboard Greek Verdict:
🟢 Conservative 🟡 Moderate Risk 🔴 Aggressive Risk
________________________________________
📌 Dashboard Display
🎯 Strategy Type (Bull or Bear Spread)
📈 Entry Premiums & Live LTPs
💹 Breakeven, Max Profit/Loss, Net Premium
📊 ROI % & Risk:Reward (with verdict)
📉 Real-time PnL using tick-by-tick data
🚦 Smart Exit verdict: Hold, Exit Soon, or Book Profit
🔁 Reversal Exit Price (spread invalidation logic)
📆 Days to Expiry (DTE)
📐 Greek Data (if enabled) with Net & Average values
⚠️ Greek Risk Verdict for managing directional risk
________________________________________
📌 Alert System (Built-in Alerts)
🎯 Target Profit Hit
❌ Max Loss Reached
🛑 Loss Bearable Limit Breached
📍 Hold Signal
📉 Book Loss / Exit Soon
⏳ Expiry Nearing
⚠️ Spread Invalidation Alert (via Reversal Price breach)
💥 High Gamma Risk (if Gamma > ±0.05)
📉 High IV Alert (if IV > 35%)
🚨 Combined Master Alert – fires if any key condition is triggered
________________________________________
📌 Smart Exit System
⚙️ Context-aware, dynamic trade assistant
✅ Analyses real-time market, PnL, expiry risk, reversal risk
✅ Gives exit suggestions based on:
Time decay
Price invalidation
Breach of defined loss/profit thresholds
✅ Keeps you objective — no emotional exits
________________________________________
📌 Reversal Exit Logic
🔁 Detects directional failure in spread structure
Bull Call Spread: Invalidation = Spot falls 25% of net premium below long strike
Bear Put Spread: Invalidation = Spot rises 25% of net premium above short strike
📉 Alerts you to exit even before loss appears
🎯 Designed for directional traders using spread logic
💡 Acts as a breakdown or breakout filter
________________________________________
⚠️ Important Notes
✅ Built for NSE Options – not for global exchanges
✅ Only for Bull Call & Bear Put spreads
✅ Use on 1-second chart only
❌ Will not work properly on higher timeframes
✅ Manual tool only – doesn’t place trades
✅ For educational and research use only
________________________________________
💬 How to Use This Dashboard
Choose Your Strategy
Bull Call or Bear Put
Input Symbols & Strikes
Use Tradingview dropdown to select accurate NSE option symbols
Enter Buy/Sell Prices
Add premiums, lot size, no. of lots
(Optional) Enable Greeks
Add Delta, Gamma, Theta, IV for both legs
Set Expiry Date
Year, Month, Day — activates DTE & expiry alerts
Monitor Dashboard
Live PnL, Max P/L, ROI, R:R, Smart Exit, Reversal Levels
(Optional) Enable Alerts
Get notified for PnL events, expiry risk, Greek risk, spread failure
________________________________________
🤝 Final Note
This tool was built with patience and care by @simpletradewithpatience to help fellow options traders trade more objectively, systematically, and confidently.
Feel free to share feedback on Tradingview.
Happy Trading! 📈
Stay disciplined. Stay smart.
________________________________________
🔠 Glossary
PnL – Profit & Loss
LTP – Last Traded Price
IV – Implied Volatility
DTE – Days to Expiry
ROI – Return on Investment
R:R – Risk to Reward Ratio
CE / PE – Call / Put Option
SEBI – Securities and Exchange Board of India
________________________________________
⚠️ Disclaimer
This script is for educational and research purposes only.
I am not a SEBI-registered advisor.
No buy or sell recommendations are made.
Trading options involves significant risk.
Use proper risk management and always consult a licensed advisor if in doubt.
The author is not responsible for any financial losses incurred.
By using this tool, you agree to these terms.
________________________________________
Time-Based Fair Value Gaps (FVG) with Inversions (iFVG)Overview
The Time-Based Fair Value Gaps (FVG) with Inversions (iFVG) (ICT/SMT) indicator is a specialized tool designed for traders using Inner Circle Trader (ICT) methodologies. Inspired by LuxAlgo's Fair Value Gap indicator, this script introduces significant enhancements by integrating ICT principles, focusing on precise time-based FVG detection, inversion tracking, and retest signals tailored for institutional trading strategies. Unlike LuxAlgo’s general FVG approach, this indicator filters FVGs within customizable 10-minute windows aligned with ICT’s macro timeframes and incorporates ICT-specific concepts like mitigation, liquidity grabs, and session-based gap prioritization.
This tool is optimized for 1–5 minute charts, though probably best for 1 minute charts, identifying bullish and bearish FVGs, tracking their mitigation into inverted FVGs (iFVGs) as key support/resistance zones, and generating retest signals with customizable “Close” or “Wick” confirmation. Features like ATR-based filtering, optional FVG labels, mitigation removal, and session-specific FVG detection (e.g., first FVG in AM/PM sessions) make it a powerful tool for ICT traders.
Originality and Improvements
While inspired by LuxAlgo’s FVG indicator (credit to LuxAlgo for their foundational work), this script significantly extends the original concept by:
1. Time-Based FVG Detection: Unlike LuxAlgo’s continuous FVG identification, this script filters FVGs within user-defined 10-minute windows each hour (:00–:10, :10–:20, etc.), aligning with ICT’s emphasis on specific periods of institutional activity, such as hourly opens/closes or kill zones (e.g., New York 7:00–11:00 AM EST). This ensures FVGs are relevant to high-probability ICT setups.
2. Session-Specific First FVG Option: A unique feature allows traders to display only the first FVG in ICT-defined AM (9:30–10:00 AM EST) or PM (1:30–2:00 PM EST) sessions, reflecting ICT’s focus on initial market imbalances during key liquidity events.
3. ICT-Driven Mitigation and Inversion Logic: The script tracks FVG mitigation (when price closes through a gap) and converts mitigated FVGs into iFVGs, which serve as ICT-style support/resistance zones. This aligns with ICT’s view that mitigated gaps become critical reversal points, unlike LuxAlgo’s simpler gap display.
4. Customizable Retest Signals: Retest signals for iFVGs are configurable for “Close” (conservative, requiring candle body confirmation) or “Wick” (faster, using highs/lows), catering to ICT traders’ need for precise entry timing during liquidity grabs or Judas swings.
5. ATR Filtering and Mitigation Removal: An optional ATR filter ensures only significant FVGs are displayed, reducing noise, while mitigation removal declutters the chart by removing filled gaps, aligning with ICT’s principle that mitigated gaps lose relevance unless inverted.
6. Timezone and Timeframe Safeguards: A timezone offset setting aligns FVG detection with EST for ICT’s New York-centric strategies, and a timeframe warning alerts users to avoid ≥1-hour charts, ensuring accuracy in time-based filtering.
These enhancements make the script a distinct tool that builds on LuxAlgo’s foundation while offering ICT traders a tailored, high-precision solution.
How It Works
FVG Detection
FVGs are identified when a candle’s low is higher than the high of two candles prior (bullish FVG) or a candle’s high is lower than the low of two candles prior (bearish FVG). Detection is restricted to:
• User-selected 10-minute windows (e.g., :00–:10, :50–:60) to capture ICT-relevant periods like hourly transitions.
• AM/PM session first FVGs (if enabled), focusing on 9:30–10:00 AM or 1:30–2:00 PM EST for key market opens.
An optional ATR filter (default: 0.25× ATR) ensures only gaps larger than the threshold are displayed, prioritizing significant imbalances.
Mitigation and Inversion
When price closes through an FVG (e.g., below a bullish FVG’s bottom), the FVG is mitigated and becomes an iFVG, plotted as a support/resistance zone. iFVGs are critical in ICT for identifying reversal points where institutional orders accumulate.
Retest Signals
The script generates signals when price retests an iFVG:
• Close: Triggers when the candle body confirms the retest (conservative, lower noise).
• Wick: Triggers when the candle’s high/low touches the iFVG (faster, higher sensitivity). Signals are visualized with triangular markers (▲ for bullish, ▼ for bearish) and can trigger alerts.
Visualization
• FVGs: Displayed as colored boxes (green for bullish, red for bearish) with optional “Bull FVG”/“Bear FVG” labels.
• iFVGs: Shown as extended boxes with dashed midlines, limited to the user-defined number of recent zones (default: 5).
• Mitigation Removal: Mitigated FVGs/iFVGs are removed (if enabled) to keep the chart clean.
How to Use
Recommended Settings
• Timeframe: Use 1–5 minute charts for precision, avoiding ≥1-hour timeframes (a warning label appears if misconfigured).
• Time Windows: Enable :00–:10 and :50–:60 for hourly open/close FVGs, or use the “Show only 1st presented FVG” option for AM/PM session focus.
• ATR Filter: Keep enabled (multiplier 0.25–0.5) for significant gaps; disable on 1-minute charts for more FVGs during volatility.
• Signal Preference: Use “Close” for conservative entries, “Wick” for aggressive setups.
• Timezone Offset: Set to -5 for EST (or -4 for EDT) to align with ICT’s New York session.
Trading Strategy
1. Macro Timeframes: Focus on New York (7:00–11:00 AM EST) or London (2:00–5:00 AM EST) kill zones for high institutional activity.
2. FVG Entries: Trade bullish FVGs as support in uptrends or bearish FVGs as resistance in downtrends, especially in :00–:10 or :50–:60 windows.
3. iFVG Retests: Enter on retest signals (▲/▼) during liquidity grabs or Judas swings, using “Close” for confirmation or “Wick” for speed.
4. Session FVGs: Use the “Show only 1st presented FVG” option to target the first gap in AM/PM sessions, often tied to ICT’s market maker algorithms.
5. Risk Management: Combine with ICT concepts like order blocks or breaker blocks for confluence, and set stops beyond FVG/iFVG boundaries.
Alerts
Set alerts for:
• “Bullish FVG Detected”/“Bearish FVG Detected”: New FVGs in selected windows.
• “Bullish Signal”/“Bearish Signal”: iFVG retest confirmations.
Settings Description
• Show Last (1–100, default: 5): Number of recent iFVGs to display. Lower values reduce clutter.
• Show only 1st presented FVG : Limits FVGs to the first in 9:30–10:00 AM or 1:30–2:00 PM EST sessions (overrides time window checkboxes).
• Time Window Checkboxes: Enable/disable FVG detection in 10-minute windows (:00–:10, :10–:20, etc.). All enabled by default.
• Signal Preference: “Close” (default) or “Wick” for iFVG retest signals.
• Use ATR Filter: Enables ATR-based size filtering (default: true).
• ATR Multiplier (0–∞, default: 0.25): Sets FVG size threshold (higher values = larger gaps).
• Remove Mitigated FVGs: Removes filled FVGs/iFVGs (default: true).
• Show FVG Labels: Displays “Bull FVG”/“Bear FVG” labels (default: true).
• Timezone Offset (-12 to 12, default: -5): Aligns time windows with EST.
• Colors: Customize bullish (green), bearish (red), and midline (gray) colors.
Why Use This Indicator?
This indicator empowers ICT traders with a tool that goes beyond generic FVG detection, offering precise, time-filtered gaps and inversion tracking aligned with institutional trading principles. By focusing on ICT’s macro timeframes, session-specific imbalances, and customizable signal logic, it provides a clear edge for scalping, swing trading, or reversal setups in high-liquidity markets.

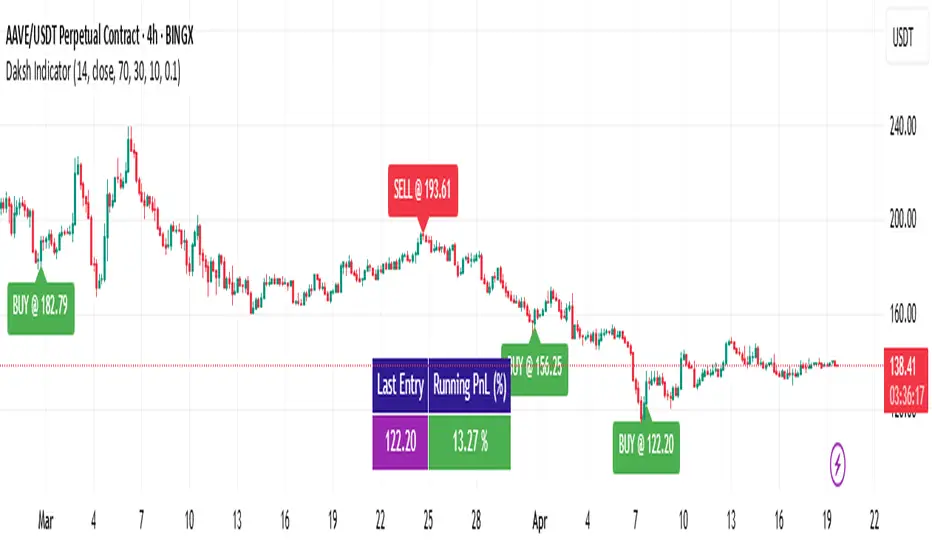
Daksh IndicatorThe Daksh Indicator is designed for swing and position traders looking for clean and reliable entries/exits on HIGHER TIME FRAMES.
It combines RSI crossover signals, RSI slope filtering, and a custom cooldown period to avoid signal clutter and improve quality.
📊 Core Logic:
RSI Crossovers: Triggers a BUY when RSI crosses up from below the oversold zone, and SELL when RSI crosses down from overbought.
Slope Filter: Signals are only valid if the RSI slope exceeds a configurable threshold, helping filter out weak reversals.
Cooldown Timer: Once a trade is taken, a user-defined number of bars must pass before a new signal can appear.
Entry Flexibility: Option to plot entry labels using Open or Close price.
PnL Tracker: A live table shows entry price and running PnL (%) based on the last signal.
📣 Alerts:
The indicator supports alerts for BUY, SELL, and combined signals.
🔒 Note:
This is a closed-source indicator due to proprietary signal filtering and trade timing logic developed through extensive personal research and testing.
⚙️ How to Use:
Use it on higher timeframes (e.g., 4H, Daily) to avoid false signals.
Look for signals aligned with major trend context.
Adjust the slope threshold and cooldown to fine-tune signal frequency.
DB - CME Gap [Multi Asset Auto Detection: BTC,SOL, etc]DB - CME Gap is a pro-grade, zero-maintenance CME gap tracker designed for serious traders.
This script automatically detects unfilled CME futures gaps across a wide range of assets—crypto, equities, bonds, commodities, FX, and agriculture—by pulling the official Friday close from CME’s daily futures data. It visually highlights unfilled weekend gaps and keeps them active on the chart until the price fully crosses through the gap level, offering a reliable view of market inefficiencies that often attract future liquidity.
Whether you're trading BTC, ES, CL, ZN, 6E, or ZC... this tool auto-detects and adjusts to the asset you're charting, so you don’t need to change any settings.
🧠 Key Benefits
Fully Automated – No symbol selection required; works instantly across asset classes
Professional Grade – Clean, minimal visuals with dynamic gap tracking
Always Accurate – Uses CME official daily closes to identify true weekend gaps
Cross-Market Versatility – Supports a broad range of assets without editing code
✅ Features
🔍 Auto Symbol Detection
Automatically identifies whether you're viewing BTC, ETH, SOL, ES, NQ, CL, ZN, 6E, GC, ZC, and more—no input required.
📅 CME Friday Close Logic
Pulls the actual Friday close from CME's daily data to detect accurate gap reference points.
🚨 Weekend Gap Detection
Monitors Friday after-hours, Saturday, and Sunday to detect gaps between CME close and weekend price action.
🧠 Persistent Gap Tracking
Gaps remain active until price fully crosses the gap level—no false closures.
📈 Dynamic Line Drawing
Draws a horizontal line at the gap price and extends it to the point of fill.
🌈 Custom Gradient Shading
Fills the area between the current price and the CME gap with directional color gradients based on price movement.
🎨 User-Configurable Colors
Adjust bull and bear fill color themes to suit your personal style.
🧩 Compatible with All Major Asset Classes
Works with:
Crypto: BTC, ETH, SOL
Equities: ES, NQ, YM, MES, MNQ
Bonds & Rates: ZN, ZB, ZF, ZT, GE
Commodities: CL, GC, NG, BZ, SI
FX: 6E, 6J, 6B
Ags: ZC (Corn), ZS (Soybeans)

Major Rotation System | QuantumResearch🚀 MRS | QuantumResearch 🚀
The Major Rotation System is an advanced quantitative system designed to dynamically allocate between Bitcoin (BTC), Ethereum (ETH), and Solana (SOL) based on a proprietary Trend Position Indicator (TPI) framework. The system monitors relative strength across assets and adapts allocations to maximize edge in trending conditions while avoiding significant drawdowns.
This tool is particularly valuable for long-term investors and active traders looking for a data-driven way to enhance their portfolio allocation without relying on subjective decision-making.
🔍 How It Works
The system continuously evaluates the strength of BTC, ETH, and SOL by applying the AVWO. This oscillator calculates how each asset is performing relative to its volume-weighted moving average and applies a dynamic threshold mechanism to identify bullish or bearish trends.
The Key Features:
✅ Asset Rotation Based on Strength – The system allocates to BTC, ETH, or SOL depending on which asset exhibits the strongest positive momentum signals.
✅ Adaptive Trend Position Indicator (TPI) – The TPI system scores each asset based on its recent performance, assigning higher weight to assets leading in momentum while reducing allocation to underperforming assets.
✅ Risk-Aware Positioning – When all assets show weak momentum, the system defaults to a cash position, mitigating unnecessary exposure in high-risk environments.
✅ Live Performance Tracking & Score Metrics – Displays Sharpe Ratio, Sortino Ratio, Omega Ratio, and Max Drawdown, providing users with clear risk/reward insights.
✅ Equity Growth Representation – The system tracks portfolio equity over time, displaying its growth relative to a Buy & Hold BTC strategy since 2023.
📊 Equity Performance Interpretation
The system plots a tracking equity curve that represents growth over time.
🔹 Example interpretation:
An equity of 12 means the system has achieved a 12X return since 2023.
An equity of 5 means the system has achieved a 5X return compared to simply holding BTC over the same period.
📊 Tracking Equity Visualization:
📌 How to Read the Scoring System
The system dynamically assigns scores to BTC, ETH, and SOL based on their score and TPI:
✅ Score of 2 → Strongest asset (highest allocation priority)
✅ Score of 1 → Secondary asset (moderate allocation)
✅ Score of 0 → Weak/no allocation
✅ If all assets score low, the system moves into cash to avoid market downturns
📈 Current Recommended Positioning
💡 The system recommends an adaptive portfolio allocation based on real-time market conditions.
⚠️ Disclaimer
The content provided is for informational and educational purposes only. Nothing contained within should be considered financial, investment, legal, or other professional advice. Past performance does not guarantee future results. Trading cryptocurrencies involves substantial risk of loss and is not suitable for every investor.
🔥 Maximize your market edge with the MRS | QuantumResearch system! 🚀

Crypto Market Session Guide with Local TimeMaster the Markets with the Ultimate Trading Session Indicator
Timing is everything in trading. Knowing when liquidity is at its peak and when market sessions overlap can make all the difference in your strategy. This Market Session Guide Indicator helps you navigate the trading day with real-time session tracking, countdown timers, and local time adjustments—giving you a clear edge in the market.
Key Features
Live Session Tracking – Instantly see which trading session is active: Asian, European, US, or the high-volatility EU-US overlap.
Automatic Local Time Conversion – No need to convert UTC manually—session times adjust automatically based on your TradingView exchange settings.
Daylight Saving Time Adjustments – The US market opening and closing times are automatically adjusted for summer and winter shifts.
Countdown Timer for Session Close – Know exactly when the current session will end so you can time your trades effectively.
Next Market Opening Display – Always be prepared by knowing which market opens next and at what exact time in your local timezone.
Clear Visual Guide – A structured table in the top-right of your chart provides all essential session details without cluttering your screen.
How It Works
This indicator tracks the three main trading sessions:
Asian Session (Tokyo, Sydney): 00:00 - 09:00 UTC
European Session (London, Frankfurt): 07:00 - 16:00 UTC
US Session (New York, Chicago): 13:30 - 22:00 UTC (adjusts automatically for Daylight Saving Time)
EU-US Overlap: 12:00 - 16:00 UTC, the most volatile period of the trading day
It also highlights when a session is about to close and when the next one will begin, ensuring you are always aware of liquidity shifts in the market.
Why You Need This Indicator
Optimized for Forex, Crypto, and Indices – Helps traders align their strategies with the most active market hours.
Ideal for Scalping and Day Trading – Enter trades during peak volatility to maximize opportunities.
Eliminates Guesswork – Stop manually tracking time zones and market schedules—everything updates dynamically for you.
Upgrade Your Trading Strategy Today
This indicator simplifies market timing, ensuring you're always trading when liquidity and volatility are at their highest. Whether you're trading Forex, Crypto, or Stocks, knowing when markets open and close is essential for making informed decisions.
Try it out, and if you find it useful, consider sharing it with other traders. Your feedback is always welcome!
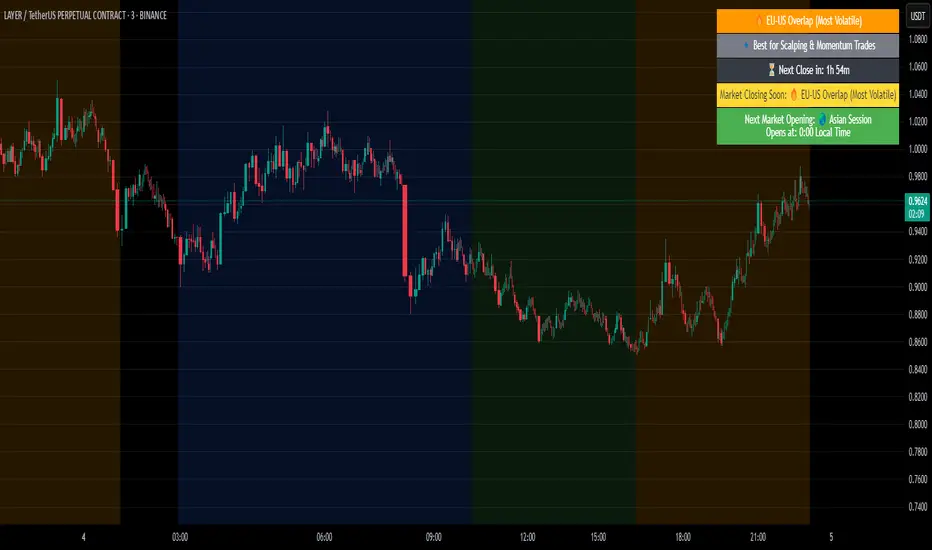
Futuristic Indicator v3 - Enhanced Glow & Strength MetersTo ensure candles are display by script go to trading view settings and uncheck default Candle, Body and Wick to prevent them from plotting over your modified candles.
Futuristic Indicator v3 - Enhanced Glow & Strength Meters: Detailed Breakdown
This Modern styled Pine Script indicator is designed to enhance technical analysis by providing a visually striking OLED-style dashboard with multiple market insights. It integrates trend detection, momentum analysis, volatility tracking, and strength meters into a single, streamlined interface for traders.
1️⃣ Customizable Features for Flexibility
The indicator offers multiple user-configurable settings, allowing traders to adjust the display based on their trading strategy and preferences. Users can toggle elements such as strength meters, volatility indicators, trend arrows, moving averages, and buy/sell alerts. Additionally, background and candle colors can be customized for better readability.
🔹 Why is this useful?
Traders can customize their charts to focus on the data they care about.
Reduces chart clutter by allowing users to toggle features on or off.
2️⃣ Trend Detection Using EMAs
This indicator detects market trends using two Exponential Moving Averages (EMA):
A "Fast" EMA (shorter period) for quick trend shifts.
A "Slow" EMA (longer period) to confirm trends.
Comparison of the two EMAs determines if the trend is bullish (uptrend) or bearish (downtrend).
The indicator colors the trend lines accordingly and adds a trend arrow 📈📉 for quick visual cues.
🔹 Why is this useful?
EMA crossovers are widely used to identify trend reversals.
Provides clear visual cues for traders to confirm entry & exit points.
3️⃣ RSI-Based Momentum Analysis
The indicator integrates the Relative Strength Index (RSI) to gauge market momentum. The momentum value changes color dynamically based on whether it's in bullish (>50) or bearish (<50) territory.
🔹 Why is this useful?
RSI helps identify overbought and oversold conditions.
Detects trend strength by measuring the speed of price movements.
4️⃣ Bullish & Bearish Strength Meters
The indicator quantifies bullish and bearish market strength based on RSI and converts it into a percentage-based meter:
Bullish Strength (Long Strength)
Bearish Strength (Short Strength)
Strength meters are displayed using OLED-styled bars, dynamically changing in real-time.
🔹 Why is this useful?
Allows traders to visually gauge market sentiment at a glance.
Helps confirm if a trend has strong momentum or is losing strength.
5️⃣ Market Volatility Indicator (ATR-Based)
The indicator includes a volatility tracker using the Average True Range (ATR):
ATR is scaled up to provide easier readability.
Higher ATR values indicate higher market volatility.
🔹 Why is this useful?
Helps traders identify potential breakout or consolidation phases.
Allows better risk management by understanding price fluctuations.
6️⃣ Trend Strength Calculation
The indicator calculates trend strength based on the difference between the EMAs:
A higher trend strength value suggests a stronger directional trend.
Displayed as a percentage for better clarity.
🔹 Why is this useful?
Helps traders differentiate between strong and weak trends.
Reduces the likelihood of entering weak or choppy markets.
7️⃣ OLED-Style Dashboard for Market Data
A futuristic OLED-styled table is used to display critical market data in a visually appealing way:
Trend direction (Bullish/Bearish with an arrow 📈📉).
Current price.
Momentum value.
Strength meters (Bullish/Bearish).
Trend strength percentage.
Volatility Meter
The dashboard uses high-contrast colors and neon glow effects, making it easier to read against dark backgrounds.
🔹 Why is this useful?
Provides a centralized view of key trading metrics.
Eliminates the need to manually calculate trend strength.
8️⃣ Modern Style Neon Glow Effects
To enhance visibility, the indicator applies glowing effects to:
Moving Averages (EMAs): Highlighted with layered glow effects.
Candlesticks: Borders and wicks dynamically change color based on trend direction.
🔹 Why is this useful?
Improves readability in low-contrast or dark-mode charts.
Helps traders spot trends faster without reading numerical data.
9️⃣ Automated Buy & Sell Alerts
The script triggers alerts when momentum crosses key levels:
Above 55 → Potential Long Setup
Below 45 → Potential Short Setup.
🔹 Why is this useful?
Alerts help traders react quickly without constantly monitoring the chart.
Reduces the risk of missing critical trade opportunities.
🔹 Final Summary: Why is This Indicator Useful?
This futuristic cyberpunk-styled trading tool enhances traditional market analysis by combining technical indicators with high-visibility visuals.
🔹 Key Benefits:
✅ Customizable Display – Toggle elements based on trading needs.
✅ Trend Detection – EMAs highlight uptrends & downtrends.
✅ Momentum Tracking – RSI-based momentum gauge identifies strong moves.
✅ Strength Meters – Bullish/Bearish power is clearly visualized.
✅ Volatility Insights – ATR-based metric highlights market turbulence.
✅ Trend Strength Analysis – Quantifies trend intensity.
✅ Dashboard – Provides a centralized, easy-to-read data panel.
✅ Cyberpunk Neon Glow – Enhances clarity with stylish aesthetics.
✅ Real-Time Alerts – Helps traders react to key opportunities.
This indicator is designed to be both functional and visually appealing, making market analysis more intuitive and efficient. 🚀

Smart Money Concepts (Advanced)Inspired and initially based on LuxAlgo's Smart Money Concepts Indicator I created a library lib_smc that started to convert every function and return objects. This allowed certain customizations like tracking the current fill level of FVGs or tracking the creation of Order Blocks, by monitoring consecutive bars against the current trend.
This indicator is provided as is, based on, but probably not always be up to date with my lib_smc that I am using for my projects.
WARNING: This indicator shows EXPERIMENTAL Order Blocks that are tracked LIVE. Unlike usual Order Blocks these are not just based on the last confirmed Swing Point (formed 50 bars before) but on consecutive candles opposing an unconfirmed trend. Blocks are confirmed by price movements relative to the unconfirmed block and unconfirmed swing points. This means that some Order Blocks will appear on pullbacks, as well as reversals.
Features
Swing Points (HH / LH / HL / LL), indicating support / resistance zones price might reject off of or want to push through
Market Structure (BOS / ChoCh), indicates confirmation for a continued / changing trend
live Order Blocks (OB), see warning above.
Fair Value Gaps (FVG), optional from higher timeframes
Equal Highs / Lows (EQH/EQL), indicates strong support / resistance zones, especially when the bars forming it have long wicks toward that zone
using my lib_no_delay all moving averages are working from bar 0, so it can be used on charts with limited bars

Granular Candle-by-Candle VWAPGranular Candle-by-Candle VWAP is a customizable Volume Weighted Average Price (VWAP) indicator designed for TradingView. Unlike traditional VWAP indicators that operate on the chart's primary timeframe, this script enhances precision by incorporating lower timeframe (e.g., 1-minute) data into VWAP calculations. This granular approach provides traders with a more detailed and accurate representation of the average price, accounting for intra-bar price and volume movements. The indicator dynamically adjusts to the chart's current timeframe and offers a range of customization options, including price type selection, visual styling, and alert configurations.
Customizable Features
Users have extensive control over various aspects of the Granular Candle-by-Candle VWAP indicator. Below are the key features that can be customized to align with individual trading preferences:
🎛️ Customizable Features
Users have extensive control over various aspects of the Granular Candle-by-Candle VWAP indicator. Below are the key features that can be customized to align with individual trading preferences:
🔢 Lookback Period
Description: Defines the number of lower timeframe bars used in the VWAP calculation.
Customization:
Input: VWAP Lookback Period (Number of Lower Timeframe Bars)
Default Value: 20 bars
Range: Minimum of 1 bar
Purpose: Allows traders to adjust the sensitivity of the VWAP. A smaller lookback period makes the VWAP more responsive to recent price changes, while a larger period smoothens out fluctuations.
📈 Price Type Selection
Description: Determines which price metric is used in the VWAP calculation.
Customization:
Input: Price Type for VWAP Calculation
Options:
Open: Uses the opening price of each lower timeframe bar.
High: Uses the highest price of each lower timeframe bar.
Low: Uses the lowest price of each lower timeframe bar.
Close: Uses the closing price of each lower timeframe bar.
OHLC/4: Averages the Open, High, Low, and Close prices.
HL/2: Averages the High and Low prices.
Typical Price: (High + Low + Close) / 3
Weighted Close: (High + Low + 2 × Close) / 4
Default Value: Close
Purpose: Offers flexibility in how the average price is calculated, allowing traders to choose the price metric that best fits their analysis style.
🕒 Lower Timeframe Selection
Description: Specifies the lower timeframe from which data is fetched for granular VWAP calculations.
Customization:
Input: Lower Timeframe for Granular Data
Default Value: 1 minute ("1")
Options: Any valid TradingView timeframe (e.g., "1", "3", "5", "15", etc.)
Purpose: Enables traders to select the granularity of data used in the VWAP calculation, enhancing the indicator's precision on higher timeframe charts.
🎨 VWAP Line Customization
Description: Adjusts the visual appearance of the VWAP line based on price position relative to the VWAP.
Customizations:
Color When Price is Above VWAP:
Input: VWAP Color (Price Above)
Default Value: Green
Color When Price is Below VWAP:
Input: VWAP Color (Price Below)
Default Value: Red
Line Thickness:
Input: VWAP Line Thickness
Default Value: 2
Range: Minimum of 1
Line Style:
Input: VWAP Line Style
Options: Solid, Dashed, Dotted
Default Value: Solid
Purpose: Enhances visual clarity, allowing traders to quickly assess price positions relative to the VWAP through color coding and line styling.
🔔 Alerts and Notifications
Description: Provides real-time notifications when the price crosses the VWAP.
Customizations:
Enable/Disable Alerts:
Input: Enable Alerts for Price Crossing VWAP
Default Value: Enabled (true)
Alert Conditions:
Price Crossing Above VWAP:
Trigger: When the closing price crosses from below to above the VWAP.
Alert Message: "Price has crossed above the Granular VWAP."
Price Crossing Below VWAP:
Trigger: When the closing price crosses from above to below the VWAP.
Alert Message: "Price has crossed below the Granular VWAP."
Purpose: Keeps traders informed of significant price movements relative to the VWAP, facilitating timely trading decisions.
📊 Plotting and Visualization
Description: Displays the calculated Granular VWAP on the chart with user-defined styling.
Customization Options:
Color, Thickness, and Style: As defined in the VWAP Line Customization section.
Track Price Feature:
Parameter: trackprice=true
Function: Ensures that the VWAP line remains visible even when the price moves far from the VWAP.
Purpose: Provides a clear and persistent visual reference of the VWAP on the chart, aiding in trend analysis and support/resistance identification.
⚙️ Performance Optimizations
Description: Ensures the indicator runs efficiently, especially on higher timeframes with large datasets.
Strategies Implemented:
Minimized Security Calls: Utilizes two separate request.security calls to fetch necessary data, balancing functionality and performance.
Efficient Calculations: Employs built-in functions like ta.sum for rolling calculations to reduce computational load.
Conditional Processing: Alerts are processed only when enabled, preventing unnecessary computations.
Purpose: Maintains smooth chart performance and responsiveness, even when using lower timeframe data for granular calculations.

RS+ Majors Allocation | viResearchRS+ Majors Allocation | viResearch
Conceptual Foundation and Innovation
The "RS+ Majors Allocation" script is a comprehensive strategy for managing a crypto portfolio focused on BTC, ETH, and SOL. By dynamically rotating between these major assets, the strategy aims to identify the strongest performer in real-time and allocate capital accordingly. The script incorporates a relative strength (RS) model that leverages price movements and a custom scoring system to rank each asset's performance. This allows the strategy to maintain positions in favorable market conditions while moving to cash during periods of weakness.
The script also includes a trend regime filter to further refine allocations. This filter ensures that an asset's own trend aligns with the market’s trend before committing to an allocation, adding another layer of protection against downturns. The approach is designed to outperform traditional buy-and-hold strategies by minimizing risk exposure during unfavorable market conditions.
Technical Composition and Calculation
The "RS+ Majors Allocation" script combines several technical elements to execute the strategy:
Relative Strength Model: Each asset (BTC, ETH, SOL) is evaluated through a ratio matrix, comparing their performance relative to one another. A scoring system is applied to these ratios to rank the assets, determining which is outperforming. This dynamic evaluation is central to the strategy's decision-making process.
Trend Regime Filter: This filter uses trend indicators to assess whether the market and individual assets are in a favorable state. If an asset’s trend score does not meet the criteria, it won't be allocated capital, thus avoiding exposure to potential downturns.
Equity Tracking and Allocation: The script tracks the portfolio's equity performance over time, plotting it against a traditional buy-and-hold strategy for comparison. Allocation decisions are based on the scores of BTC, ETH, and SOL, with the system selecting the top-performing asset and moving to cash if no asset meets the criteria.
Performance Metrics: To evaluate the effectiveness of the strategy, the script calculates several key performance indicators:
Sharpe Ratio: Measures risk-adjusted returns.
Sortino Ratio: Focuses on downside risk by considering only negative fluctuations.
Omega Ratio: Analyzes returns relative to risk.
Maximum Drawdown: Shows the largest peak-to-trough decline, indicating potential loss exposure.
Features and User Inputs
The script offers a range of customizable parameters to tailor the strategy to individual preferences and market conditions:
Asset Selection: Users can choose the specific assets to include in the rotation, with the script currently focusing on BTC, ETH, and SOL. The trend regime filter is optional, allowing for a more aggressive or conservative approach.
Equity Visualization: The script provides real-time equity tracking, comparing the portfolio's performance with individual assets. Users can adjust visualization settings to focus on specific assets or the overall strategy.
Starting Date: The backtesting period can be set to begin at a specific date, helping to analyze the strategy’s performance over different timeframes.
Bar Colors and Alerts: Visual cues, including colored bars, indicate the active trend direction of the selected asset. Additionally, alerts notify traders when the system rotates between assets or moves to cash.
Practical Applications
The "RS+ Majors Allocation" script is designed for traders who want to manage a crypto portfolio with a focus on risk-adjusted returns. It is particularly effective in several scenarios:
Asset Rotation: The dynamic scoring system allows the script to rotate between BTC, ETH, and SOL based on relative strength, capitalizing on the strongest performer at any given time.
Downside Protection: The trend regime filter helps avoid exposure during market-wide downturns by staying in cash, minimizing drawdowns during periods of high volatility.
Active Portfolio Management: By using real-time data to make allocation decisions, the script offers a more hands-on approach to portfolio management compared to passive holding strategies.
Advantages and Strategic Value
This script brings a structured and disciplined approach to portfolio management, combining trend analysis, relative strength, and performance metrics to optimize returns. The use of a scoring system for asset rotation, along with the trend filter, makes it versatile and adaptable to different market environments. The script aims to outperform traditional buy-and-hold strategies by focusing on the strongest assets while reducing risk during unfavorable conditions.
The visual and performance feedback provided by the script allows traders to gain deeper insights into their portfolio’s behavior, helping to make data-driven decisions.
Summary and Usage Tips
The "RS+ Majors Allocation" script is a powerful tool for managing a crypto portfolio with a focus on performance optimization and risk management. By incorporating this strategy, traders can dynamically allocate capital to the top-performing assets while protecting their portfolio from significant downturns. Adjust the trend regime filter, threshold settings, and asset choices to fit your market outlook and trading goals. The script's equity tracking and performance metrics will provide clear insights into how well the strategy is performing compared to a traditional buy-and-hold approach.
Remember to use backtesting to assess the script's effectiveness over different timeframes and market conditions. Keep in mind that past performance does not guarantee future results, so consider using this strategy in conjunction with other analysis tools for a comprehensive approach to trading.

Global Market Cap of all measuable assets# Comprehensive Global Market Cap Overview
This indicator provides a dynamic, real-time estimate of the total global market value across multiple asset classes and economic sectors. It aims to give traders and analysts a broad perspective on the state of global markets and wealth.
## Features:
- Real-time data for major market segments including stocks, bonds, real estate, cryptocurrencies, and commodities
- Estimates for hard-to-quantify sectors like derivatives, private equity, and OTC markets
- Includes often-overlooked categories such as cash deposits, insurance markets, and natural resources
- Static estimates for art/collectibles and intellectual property
- Total global value calculation and breakdown by category
- Easy-to-read table display of all categories
## Categories Tracked:
1. Global Stock Market
2. Global Bond Market
3. Real Estate
4. Cryptocurrencies
5. Commodities
6. Derivatives Market
7. Private Equity and Venture Capital
8. Cash and Bank Deposits
9. Insurance Markets
10. Sovereign Wealth Funds
11. OTC Markets
12. Natural Resources
13. Art and Collectibles
14. Intellectual Property
## Data Sources:
- Uses popular ETFs and indices as proxies for global markets where possible
- Incorporates data from specific company stocks to represent certain markets (e.g., CME for derivatives, OTCM for OTC markets)
- Utilizes FRED data for bank deposits
- Includes static estimates for categories without reliable real-time data sources
## Notes:
- All values are approximate and should be used for general perspective rather than precise financial analysis
- Some categories use scaled proxy data, which may not perfectly represent global totals
- Static estimates are used where real-time data is unavailable and should be updated periodically
- The total global value includes human capital but this is not displayed in the table due to its speculative nature
This indicator is designed to provide a comprehensive overview of global market value, going beyond traditional market capitalization metrics. It's ideal for traders, researchers, and anyone interested in gaining a broader understanding of global wealth distribution across various sectors.
Please note that due to the complexity of global markets and limitations in data availability, all figures should be considered estimates and used as part of a broader analysis rather than as definitive values.
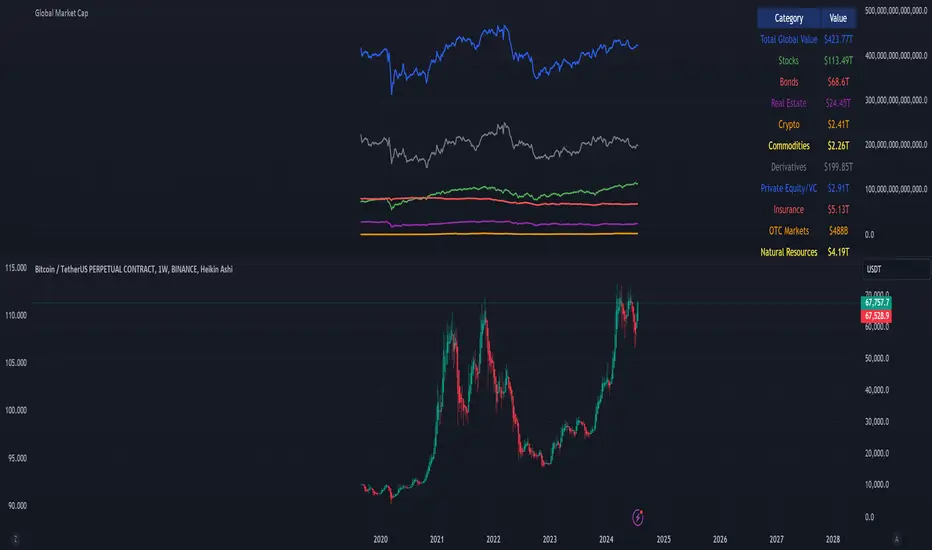
Temporal Value Tracker: Inception-to-Present Inflation Lens!What we're looking at here is a chart that does more than just display the price of gold. It offers us a time-traveling perspective on value. The blue line, that's our nominal price—it's the straightforward market price of gold over time. But it's the red line that takes us on a deeper journey. This line adjusts the nominal price for inflation, showing us the real purchasing power of gold.
Now, when we talk about 'real value,' we're not just philosophizing. We're anchoring our prices to a point in time when the journey began—let's say when gold trading started on the markets, or any inception point we choose. By 'shadowing' certain years—say, from the 1970s when the gold standard was abandoned—we can adjust this chart to reflect what the inflation-adjusted price means since that key moment in history.
By doing so, we're effectively isolating our view to start from that pivotal year, giving us insight into how gold, or indeed any asset, has held up against the backdrop of economic changes, policy shifts, and the inevitable rise in the cost of living. If you're analyzing a stock index like the S&P 500, you might begin your inflation-adjusted view from the index's inception date, which allows you to measure the true growth of the market basket from the moment it started.
This adjustment isn't just academic. It influences how we perceive value and growth. Consider a period where the nominal price skyrockets. We might toast to our brilliance in investment! But if the inflation-adjusted line lags, what we're seeing is nominal growth without real gains. On the other hand, if our red line outpaces the blue even during stagnant market periods, we're witnessing real growth—our asset is outperforming the eroding effects of inflation.
Every asset class can be evaluated this way. Stocks, bonds, real estate—they all have their historical narratives, and inflation adjustment tells us if these stories are tales of genuine growth or illusions masked by inflation.
So, as informed traders and investors, we need to keep our eyes on this inflation-adjusted line. It's our measure against the silent thief that is inflation. It ensures we're not just keeping up with the Joneses of the market, but actually outpacing them, building real wealth over time
