Points of InterestIndicator for displaying a timed, intraday Range of Price as a Point of Interest (POI) that you may want to track when trading as a potential magnet for price. Quite often you will see Price return to prior days price range before continuing to move. This enables you to track specific portions of a Days Trading session to see what has been revisited and what has not yet been re traded to.
The range is tracked for each trading day between the times that you specify in the Inputs ‘POI Time’ parameter You can also set the Time zone of the Range.
It will mark the Range High and Low for the timed range with lines that can be optionally extended and can be customised in terms of colour, style and width.
It will also Plot a line showing the Equilibrium of the range which is 50% from the High to the Low point of price during the time window that you specified in the ‘POI Time’ Parameter. This can also be customised in terms of visibility, colour, style and width.
You can control an optional Label for the POI Equilibrium Line to include a combination of a user defined prefix, the Date that the POI Equilibrium Line’s range is from and the Price Level of the Equilibrium Line. The colour and size of the label is also configurable
This indicator will also track when a POI Equilibrium Line has been traded to or ‘Tapped’. The tracking can be started after a configurable number of minutes have elapsed from the end of the POI Time window. This can also be customised in terms of visibility, colour, style, extended toggle and width.
Optionally Taps of the POI Equilibrium Level can be counted as valid during specific time windows or session of the day - for example only count taps during New York Morning Trading session.
The indicator uses Lower Time Frame data to compute the Range and 50% / Equilibrium Level so will work accurately on Chart Timeframes up to and including Daily with The POI Time specified down to a Minute resolution.
Komut dosyalarını "track" için ara

Arithmetic Candlesticks (Zeiierman)█ Arithmetic Candlestick - Overview
Arithmetic Candlesticks (Zeiierman) introduce a new way to read charts by applying logical arithmetic to real price data. These candlesticks focus on filtering out noise and smoothing price movements using a bell-shaped curve, which helps to refine the data and highlight the true trend. This approach provides a clearer view of market trends, allowing traders to interpret price action more effectively with minimal lag and distraction.
⚪ What is Arithmetic Candlesticks
Arithmetic Candlesticks use a calculation method rooted in the idea that the market moves in patterns that can be identified and predicted by examining past price movements.
Analyzing momentum, price action, and trend patterns is useful for traders who want to quickly scan and identify price patterns, trends, and momentum in the market. The system searches for these patterns and trends to anticipate future price movements. Traders and investors can identify trends hidden in market noise, enabling them to uncover trading opportunities that might not be immediately obvious to the naked eye.
⚪ Eliminates price noise
The Arithmetic Candlestick noise filtering function is used to reduce price noise, which is the randomness in the price movement of an asset caused by market participants trading on a short-term basis. The idea behind the filter is that it eliminates the impact of short-term fluctuations in the price, thus providing a more accurate picture of the overall trend.
█ Capturing Trends with precise chart reading
Trend moves are some of the biggest moneymakers in trading; in fact, trading in the direction of the trend reduces risk and increases profit potential. Arithmetic Candlestick helps traders do just that.
In a fast-moving and volatile market characterized by high-frequency algorithms, retail traders have a hard time distinguishing the real trend from the noise. Arithmetic Candlesticks are designed to filter out the noise created by insignificant price moves and leave traders with the price action that matters, namely a clear and insightful chart reading. Due to its sophisticated mathematical calculations, Arithmetic Candlesticks are able to analyze any market and timeframe.
█ How to use Arithmetic Candlesticks
Arithmetic Candlesticks is an all-in-one trend and momentum tool that can be used stand-alone or in conjunction with other indicators. Its primary use is to provide a clear chart reading, easily identify trends, and help traders stay longer in trends.
The indicator includes excellent momentum features that offer insights into the current momentum and the strength of the price action. This provides traders with a unique chart experience that yields valuable insights. The indicator boasts numerous features, each of which can be used stand-alone or in combination with others. Read more about the features below.
These candles can be used in conjunction with other indicators such as support/resistance, trendlines, ICT trading, and other patterns.
█ Arithmetic Candlesticks features
The indicator comes with tons of great features that make the indicator into its own system that can be used stand-alone. You find everything from trend reading, entry/exit points, identifying momentum, and auto-stop loss.
⚪ Candle Modes:
Traders can select from three different types of arithmetic candle calculations and enable our volatility-adjusted filter for all of them. By default, the candles are set to Arithmetic candlesticks. However, depending on their trading preferences, users can select Arithmetic + Heikin Ashi Candles or Impulse + Wicks Candles.
The Heikin Ashi mode of the candlesticks makes the indicator smoother and more trend-friendly.
The Impulse + Wick mode of the candlesticks makes the indicator responsive to momentum. The length of the wicks represents the strength of the current momentum. The longer the wicks, the greater the momentum in the market.
If traders enable the Volatility Adjusted candles , the indicator becomes much more responsive to volatility moves, which is a way of making the candlesticks more responsive to significant price movements.
⚪ Trend coloring
Arithmetic candlesticks come in three different color modes: the default one, the gradient one, and the advanced trend coloring. Enable the Trend coloring if you want to engage in long-term trend trading. This filter does not change the arithmetic candlesticks, only the bar coloring.
⚪ Buy and Sell signals
To make trend trading easier to understand, we have included Buy/Sell signals. These signals are based both on the type of candlesticks selected and the type of coloring used. In addition, they come with three filters and are available in scalping and trend modes.
Candle Color Filter: A buy signal will only occur if the candlesticks are bullish, and a sell signal will only occur if the candlesticks are bearish.
Trend Tracker Filter: A buy signal will only occur if the Trend Tracker is bullish, and a sell signal will only occur if the Trend Tracker is bearish.
When both filters are applied, it means that both the candle color and the Trend Tracker should have the same sign in order to trigger a signal.
These filters are very effective and should be used when utilizing the signals.
Take Profit signals can be enabled to help traders know when to take profits.
Adaptive Stop Loss can be enabled for the signals, helping traders manage their risk.
⚪ Trend Tracker
The Trend Tracker line provides insights about the underlying trend. Adjust it if you want to engage in scalping, which makes the line much more responsive. Set the underlying speed of the trend to either Fast or Slow. This Trend Tracker works well in conjunction with Arithmetic Candlesticks and the associated signals.
⚪ Trend Sentiment
Enable Trend Sentiment to identify the levels at which the market is considered bullish or bearish. This feature helps you gauge the overall market direction, allowing you to align your trades with the prevailing trend. The Trend Sentiment also measures the strength of the trend, highlighting whether the current price action reflects a strong or weak trend. Adjust the sensitivity to determine how early or late you want to capture these trend signals.
⚪ Impulse
Enable Impulse Signals to understand when the market is making a significant move, often leading to a pullback or pause. These Impulse Signals can indicate the very start of a trend or serve as the first sign of a reversal. Enable 'Significant Impulses' if you only want to display the most significant market impulses.
█ How is Arithmetic Candlesticks Calculated?
⚪ Candlesticks
These candlesticks combine advanced smoothing techniques with price pattern recognition, giving traders a clearer view of market dynamics.
Adaptive Smoothing: The core of this smoothing approach is its ability to adjust dynamically based on market conditions. It reduces lag while staying responsive to price changes. This adaptive nature allows the candlesticks to follow the price action smoothly, minimizing the influence of short-term fluctuations. As a result, the trend is depicted with greater accuracy, helping traders to stay in tune with the market’s true direction.
Refined Smoothing with Weighted Averages: Another key component of the smoothing process involves applying a refined technique that uses a bell-shaped curve to weight price data. This method reduces the impact of outlier movements, resulting in a smoother, more continuous curve that accurately represents the market's central trend. This ensures that the candlesticks reflect a more balanced view of price action, focusing on the significant movements while filtering out unnecessary noise.
⚪ Trend Coloring
The Trend Coloring feature offers a powerful visualization tool that helps traders quickly identify the prevailing market trend and its strength. By analyzing market structure and the velocity of price movements, this feature provides a clear, dynamic view of the long-term trend direction.
Market Structure Analysis: The Trend Coloring is rooted in a thorough analysis of market structure, focusing on key price levels over time. By evaluating these levels, the system determines whether the market is in an uptrend, downtrend, or ranging phase. This information is then used to color the chart according to the current trend direction, providing a visual cue that makes it easier to align your trades with the broader market movement.
Velocity of Price Movements: . In addition to identifying the trend direction, the system also calculates the velocity of price movements. This involves assessing how quickly or slowly prices are advancing in a particular direction, offering deeper insight into the trend's strength and momentum. Faster price movements suggest a stronger trend, while slower movements may indicate a weakening or consolidating market. This dynamic approach ensures that the Trend Coloring not only highlights the trend but also reflects its intensity and potential sustainability.
⚪ Buy and Sell signals
The Buy/Sell signals are generated using a sophisticated approach that tracks key price action levels to determine market direction and momentum. This method constantly evaluates the relationship between the current price and dynamically adjusting levels that reflect the underlying market conditions. By staying in tune with the flow of the market, this approach effectively captures the onset of new trends while reducing the lag typically associated with traditional indicators.
Dynamic Price Action Levels: The signals are based on critical price action levels that adapt in real-time to market movements. These levels serve as flexible thresholds that help identify potential buy or sell opportunities. When the price interacts with these levels, it triggers signals that indicate possible entry or exit points, aligning your trades with the prevailing market direction.
Price Patterns: The algorithm also recognizes and integrates specific price patterns that are often precursors to significant market moves. By identifying these patterns, the system can anticipate changes in market direction more accurately, enabling earlier and more precise signals. This helps in capturing trend reversals or continuations effectively.
Momentum-Driven Adjustments: The system's price action levels are not static; they adjust dynamically in response to strong price movements. This ensures that the signals are not only timely but also in sync with the underlying market momentum, making the system highly effective in volatile conditions where quick decision-making is crucial.
⚪ Trend Tracker
The Trend Tracker utilizes the core principles of Arithmetic Candlesticks, including their sophisticated smoothing techniques and pattern recognition capabilities. By leveraging these features, the Trend Tracker effectively filters out market noise, allowing it to present a smooth and accurate representation of the current trend. This makes it easier to identify whether the market is trending upwards, downwards, or entering a period of consolidation.
Adaptive to Market Conditions: The Trend Tracker is not static; it dynamically adjusts as market conditions change. Whether the market is experiencing high volatility or moving through a quieter phase, the Trend Tracker remains responsive, continuously updating to reflect the most recent price action. This ensures that traders are always working with the most relevant information, making it easier to stay in sync with the market's true direction.
⚪ Trend Sentiment
Trend Sentiment analyzes key price levels and market structure to determine whether the current market sentiment is bullish or bearish. By examining the direction and momentum of price movements, it provides a straightforward view of the market's overall trend direction.
⚪ Impulse
Impulse monitors the market for sudden shifts in momentum, recognizing when the price is making a strong move that could lead to a trend continuation or a reversal. The feature is tuned to distinguish between regular market fluctuations and significant impulses. It focuses on the most meaningful price movements, ensuring that the signals you receive are relevant and actionable.
█ Important Note
Caution! Arithmetic candlesticks do not always reflect the actual price. Arithmetic uses smoothing and noise filtering to capture trends; hence, it might deviate from the actual close.
It's important to understand that Arithmetic Candlesticks are intended to provide a clearer picture of trend direction rather than exact price levels. Therefore, they should not be used as a substitute for actual market prices, especially in scenarios like backtesting or precise trade execution where exact price data is crucial. Instead, use Arithmetic Candlesticks as a tool for understanding trends and overall market direction, while relying on actual price data for decisions that require precise price points.
-----------------
Disclaimer
The information contained in my Scripts/Indicators/Ideas/Algos/Systems does not constitute financial advice or a solicitation to buy or sell any securities of any type. I will not accept liability for any loss or damage, including without limitation any loss of profit, which may arise directly or indirectly from the use of or reliance on such information.
All investments involve risk, and the past performance of a security, industry, sector, market, financial product, trading strategy, backtest, or individual's trading does not guarantee future results or returns. Investors are fully responsible for any investment decisions they make. Such decisions should be based solely on an evaluation of their financial circumstances, investment objectives, risk tolerance, and liquidity needs.
My Scripts/Indicators/Ideas/Algos/Systems are only for educational purposes!

MidnightQuant Buy/Exit SignalsThe MidnightQuant Indicator is a sophisticated trend-following tool designed for traders seeking an edge in market analysis through a multi-symbol, multi-timeframe approach. Built on an enhanced Supertrend algorithm, this indicator goes beyond traditional trend-following methods by integrating advanced features that cater to both novice and experienced traders. Its unique design provides comprehensive market insights, empowering traders to make informed decisions with confidence.
Keep in mind that it was tested mainly with higher timeframes, 4H, 1D, 1W.
Overview:
MidnightQuant is specifically engineered to simplify the complexity of market analysis by monitoring and analyzing multiple currency pairs simultaneously. It combines trend detection, reversal signals, and a user-friendly dashboard to present a holistic view of market conditions. Whether you're trading a single asset or managing a portfolio, MidnightQuant delivers actionable insights in real-time.
Key Features:
Multi-Symbol Trend Analysis:
MidnightQuant's most distinguishing feature is its ability to track and analyze up to ten different currency pairs simultaneously. Unlike traditional indicators that focus on a single asset, this multi-symbol capability provides a broader view of market dynamics, allowing traders to identify correlations and divergences across various pairs. This is particularly useful for traders who want to confirm the strength of a trend across different markets before making a trading decision.
Enhanced Supertrend Algorithm:
At the core of MidnightQuant lies an optimized Supertrend algorithm that has been fine-tuned for both accuracy and responsiveness. The algorithm calculates trend directions by factoring in average true range (ATR) data, which helps in identifying significant price movements while filtering out market noise. This results in more reliable trend detection and fewer false signals, making it a powerful tool for trend-following strategies.
Intuitive Dashboard Display:
The MidnightQuant dashboard is designed to centralize critical information, making it accessible at a glance. It displays four key columns: Potential Reversals, Confirmed Reversals, Bullish Trends, and Bearish Trends. Each column provides a quick summary of the current market state for all tracked symbols, allowing traders to see where potential opportunities lie. This streamlined presentation reduces the need for constant chart monitoring and helps traders focus on the most promising setups.
Visual Signals and Candlestick Integration:
MidnightQuant enhances chart readability by incorporating visual signals directly on the price chart. Buy and sell signals are clearly marked at points where trend reversals are detected, providing immediate entry and exit cues. Additionally, the indicator color-codes candlesticks according to the current trend direction—purple for bullish and light lavender for bearish—enabling traders to instantly gauge market sentiment.
Customizable Alerts:
The indicator includes flexible alert conditions that can be customized according to your trading preferences. Alerts are triggered for trend direction changes, providing timely notifications for potential buy or sell opportunities. This feature is invaluable for traders who need to stay informed of market movements even when they are not actively monitoring their charts.
Trend Reversal Detection:
One of MidnightQuant's core functionalities is its ability to detect and signal trend reversals. The indicator monitors changes in the trend direction with precision, helping traders to identify potential turning points in the market. This feature is particularly useful for swing traders and those who aim to capitalize on shifts in market momentum.
Customizable Settings:
The indicator comes with various settings that allow traders to tailor it to their specific needs. From selecting which symbols to track to adjusting the sensitivity of the Supertrend algorithm, users have full control over how the indicator behaves. This customization ensures that MidnightQuant can be adapted to different trading styles and strategies.
How It Works:
MidnightQuant uses a proprietary calculation based on the Supertrend algorithm, which leverages ATR to dynamically adjust to market volatility. The indicator tracks the midpoint of each trading range and applies a factor that defines the threshold for trend changes. When the closing price crosses this threshold, a new trend is identified, and corresponding signals are generated.
The multi-symbol feature is powered by the request.security function, which allows MidnightQuant to pull in data from multiple symbols and timeframes. This data is then processed through the Supertrend algorithm to determine the trend direction for each symbol, which is subsequently displayed on the dashboard.
The indicator also includes a built-in dashboard that provides a summarized view of market conditions, including potential and confirmed reversals, as well as current trend directions. This dashboard updates in real-time, giving traders a continuously updated snapshot of market sentiment across multiple assets.
Use Cases:
Swing Traders: The trend reversal detection and real-time alerts help swing traders identify potential entry and exit points, making it easier to capitalize on market swings.

ICT Market Structure Screener (Zeiierman)█ Overview
The ICT Market Structure Screener (Zeiierman) is designed to identify and display key market structure levels and patterns based on Smart Money Concepts. It highlights bullish and bearish structures, premium and discount levels, and generates alerts for significant market structure changes, making it a valuable tool for traders looking to understand institutional trading behaviors and market trends. A key feature of this indicator is its screener function, which allows traders to monitor multiple symbols simultaneously. This feature provides a consolidated view of the market structure for various assets, making it easier to identify trading opportunities across a diverse portfolio.
█ How It Works
The ICT Market Structure Screener operates by identifying high and low pivot points within a specified period, then analyzing these pivots to determine changes in market structure. The indicator tracks price movements and categorizes them into bullish or bearish structures, indicating potential trend reversals or continuations. By plotting premium and discount levels, it helps traders identify overbought and oversold conditions. The indicator also provides real-time updates and alerts for significant changes in the market structure.
█ Terminology
ChoCH (Change of Character): Indicates a potential reversal in market direction. It is identified when the price breaks a significant high or low, suggesting a shift from a bullish to bearish trend or vice versa.
SMS (Smart Money Shift): Represents the transition phase in market structure where smart money begins accumulating or distributing assets. It typically follows a BMS and indicates the start of a new trend.
BMS (Bullish/Bearish Market Structure): Confirms the trend direction. Bullish Market Structure (BMS) confirms an uptrend, while Bearish Market Structure (BMS) confirms a downtrend. It is characterized by a series of higher highs and higher lows (bullish) or lower highs and lower lows (bearish).
Premium: A zone where the price is considered overbought. It is calculated as the upper range of the current market structure and indicates a potential area for selling or shorting.
Mid Range: The midpoint between the high and low of the market structure. It often acts as a support or resistance level, helping traders identify potential reversal or continuation points.
Discount: A zone where the price is considered oversold. It is calculated as the lower range of the current market structure and indicates a potential area for buying or going long.
█ How to Use
The ICT Market Structure Screener allows traders to follow smart money moves in the market more effectively. By identifying key market levels and monitoring bullish and bearish structures, traders can easily spot trend changes and strong trends. The indicator's premium and discount levels help identify overbought and oversold conditions, providing valuable entry and exit points. Alerts for ChoCH, SMS, and BMS keep traders informed about significant market changes, enabling real-time adjustments to trading strategies.
The screener functionality is particularly valuable for monitoring multiple markets simultaneously. The screener table displays critical information such as current price, trend direction, signal type, and premium/discount levels for each symbol. This makes it easier to track the market structure of various assets at a glance and quickly identify trading opportunities across different markets.
Example Strategies:
⚪ Trend Following: Use the indicator to identify the current market trend (bullish or bearish) and trade in the direction of the trend. Enter trades on pullbacks to premium (for shorts) or discount (for longs) levels.
⚪ Reversal Trading: Look for ChoCH signals to identify potential trend reversals. Enter trades when the price breaks a significant high or low and confirms a change in market structure, or wait for a retest of the nearest Orderblock that was formed.
⚪ Support and Resistance: Utilize the mid-range, premium, and discount levels as support and resistance zones. Enter trades when the price approaches these levels and shows signs of reversal or continuation.
⚪ Multi-Symbol Analysis: Use the screener table to monitor multiple symbols and quickly assess their market structure. This helps in diversifying trading opportunities and managing a portfolio of assets efficiently.
█ Settings
Period: The pivot period for calculating the structure. Increasing the period captures broader trends, making the structure more representative of long-term movements. Decreasing the period focuses on shorter-term trends, increasing sensitivity.
Response: Enabling this option uses the response period instead of the pivot period, providing more flexibility in capturing short-term or long-term structures. The period for the response, which determines the structure's sensitivity. Increasing the response period smoothens the structure, making it less reactive to short-term fluctuations. Decreasing the response period makes the structure more responsive to short-term changes.
Structure Display: Choose between displaying the active range or the previous range. 'Active Range' shows real-time premium, discount, and mid-range levels based on the current structure. 'Previous Range' displays past ranges, useful for analyzing historical support/resistance levels.
Ticker Symbols: List of symbols to include in the screener. Enabling the option includes the symbol in the screener, allowing the user to track its structure. Disabling it excludes the symbol from the screener, reducing the number of tracked symbols.
-----------------
Disclaimer
The information contained in my Scripts/Indicators/Ideas/Algos/Systems does not constitute financial advice or a solicitation to buy or sell any securities of any type. I will not accept liability for any loss or damage, including without limitation any loss of profit, which may arise directly or indirectly from the use of or reliance on such information.
All investments involve risk, and the past performance of a security, industry, sector, market, financial product, trading strategy, backtest, or individual's trading does not guarantee future results or returns. Investors are fully responsible for any investment decisions they make. Such decisions should be based solely on an evaluation of their financial circumstances, investment objectives, risk tolerance, and liquidity needs.
My Scripts/Indicators/Ideas/Algos/Systems are only for educational purposes!

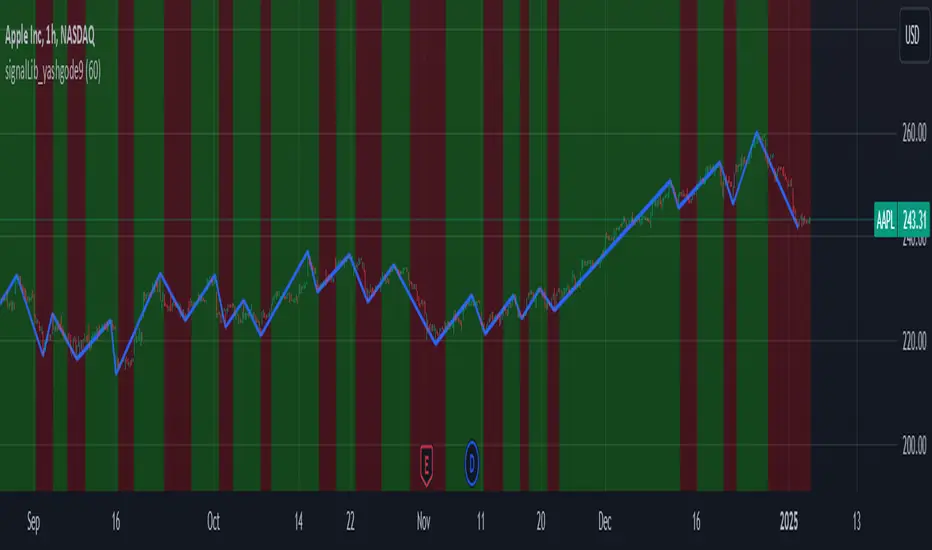
signalLib_yashgode9Signal Generation Library = "signalLib_yashgode9"
This library, named "signalLib_yashgode9", is designed to generate buy and sell signals based on the price action of a financial instrument. It utilizes various technical indicators and parameters to determine the market direction and provide actionable signals for traders.
Key Features:-
1.Trend Direction Identification: The library calculates the trend direction by comparing the number of bars since the highest and lowest prices within a specified depth. This allows the library to determine the overall market direction, whether it's bullish or bearish.
2.Dynamic Price Tracking: The library maintains two chart points, zee1 and zee2, which dynamically track the price levels based on the identified market direction. These points serve as reference levels for generating buy and sell signals.
3.Customizable Parameters: The library allows users to adjust several parameters, including the depth of the price analysis, the deviation threshold, and the number of bars to consider for the trend direction. This flexibility enables users to fine-tune the library's behavior to suit their trading strategies.
4.Visual Representation: The library provides a visual representation of the buy and sell signals by drawing a line between the zee1 and zee2 chart points. The line's color changes based on the identified market direction, with red indicating a bearish signal and green indicating a bullish signal.
Usage and Integration:
To use this library, you can call the "signalLib_yashgode9" function and pass in the necessary parameters, such as the lower and higher prices, the depth of the analysis, the deviation threshold, and the number of bars to consider for the trend direction. The function will return the direction of the market (1 for bullish, -1 for bearish), as well as the zee1 and zee2 chart points.You can then use these values to generate buy and sell signals in your trading strategy. For example, you could use the direction value to determine when to enter or exit a trade, and the zee1 and zee2 chart points to set stop-loss or take-profit levels.
Potential Use Cases:
This library can be particularly useful for traders who:
1.Trend-following Strategies: The library's ability to identify the market direction can be beneficial for traders who employ trend-following strategies, as it can help them identify the dominant trend and time their entries and exits accordingly.
2.Swing Trading: The dynamic price tracking provided by the zee1 and zee2 chart points can be useful for swing traders, who aim to capture medium-term price movements.
3.Automated Trading Systems: The library's functionality can be integrated into automated trading systems, allowing for the development of more sophisticated and rule-based trading strategies.
4.Educational Purposes: The library can also be used for educational purposes, as it provides a clear and concise way to demonstrate the application of technical analysis concepts in a trading context.
Important Notice:- This library effectively work on timeframe of 5-minute and 15-minute.
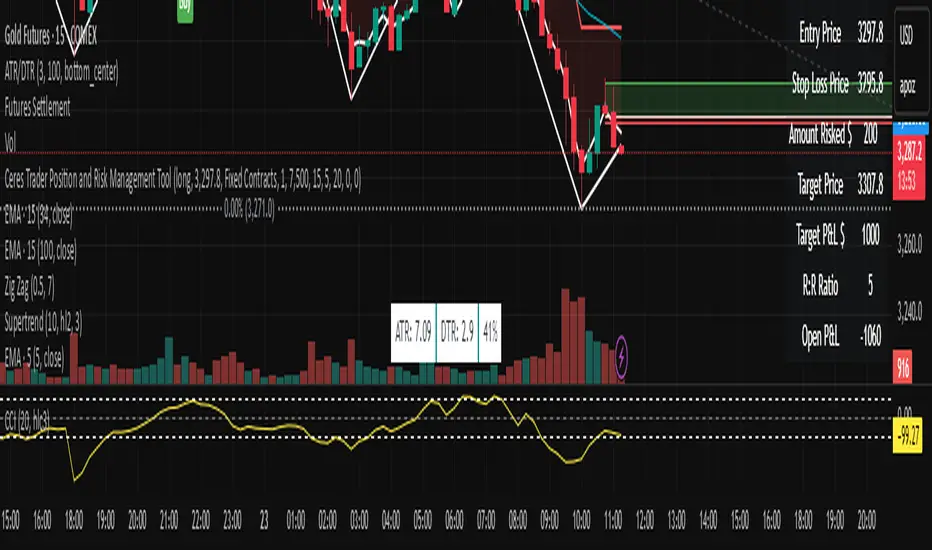
Ceres Trader Position and Risk Management ToolNOTE: It won't properly scale until you enter an entry point that is located on the chart. It's a feature not a bug. After that, you will see the entry, s/l, and target price lines properly displayed on the chart.
The "Ceres Trader Position and Risk Management Tool" is a comprehensive indicator designed for TradingView, meticulously crafted for traders who prioritize effective risk management and clear position visualization. This tool seamlessly integrates with your trading strategy, providing crucial information about your trades directly on your chart.
Key Features:
Position Type Visualization: Displays long or short positions with distinct color-coded lines and boxes for easy recognition.
Entry, Stop Loss, and Target Levels: Visual markers for entry price, stop loss, and target price, enabling you to track your trade setup at a glance.
Risk Assessment: Calculates and displays the amount at risk based on the stop loss distance and the percentage of risk capital.
Profit Potential: Shows the potential profit in dollar terms if the target is reached, helping you understand the reward prospects of your trade.
Reward to Risk Ratio: Indicates the ratio of potential reward to risk, an essential metric for evaluating the efficiency of your trade setup.
Current P&L Tracking: Continuously updates the open profit and loss based on the current market price, giving you real-time insight into your trade's performance.
Customizable Risk and Reward Boxes: Allows personalization of the risk and reward zones with color options, enhancing chart clarity and visual appeal.
How to Use:
Setting Up Your Trade:
Input your trade details including position type (long or short), entry price, risk capital, risk percentage, reward-risk ratio, and stop loss distance.
Visualize Your Trade:
The tool will automatically plot the entry, stop loss, and target prices on the chart.
Risk and reward areas will be highlighted with customizable color boxes.
Monitor Your Risk and Reward:
View the amount risked and potential profit in dollar terms directly on the chart.
Keep track of the reward to risk ratio to assess trade efficiency.
Stay Informed of Real-time Performance:
The current P&L of your open position will be updated in real-time, helping you make informed decisions.
This tool is ideal for traders who follow disciplined risk management practices and want to keep essential trade information easily accessible. With the "Ceres Trader Position and Risk Management Tool," you are equipped to make strategic trading decisions backed by clear visual cues and critical data.
Camarilla Pivots - Signals, Alerts, TP and SL by Tech Store OnThis is a Camarilla Pivots indicator script, which will show signals, take profit and stop-loss on the chart with alerts based on Camarilla Pivot strategies:
LONG signals: S5 > S4, TP1: S4, TP2: S3, TP3: R3 SL: Manual | S3 > R3, TP1: R3, TP2: R4, TP3: R5, SL: S4 | R4 > R5, TP1: R5, SL: R3
SHORT signals R5 > R4, TP1: R4, TP2: R3, TP3: S3, SL: Manual | R3 > S3, TP1: S3, TP2: S4, TP3: S5, S4 > S5, TP1: S5, SL: S3
Mainly, the script is based on the pivot levels and price action. The script will trigger a signal if a supporting direction candle breaks or bounces at certain pivot, triggering a direction of the potential trade with the next pivot serving as a Price Target area, each signal will potentially wait for 3 Price Target areas and if they happen will show each on chart. An opposite direction pivots are used as a Stop Loss, which the indicator will show on the chart. If stop-loss will be hit, the script will not show take profit areas considering the trade is closed with a loss. Same way if take profit area 1 is reach, it is considered that SL is moved to Entry and therefore the script will no longer show stop-loss for that trade. This indicator was mainly tested via 15min timeframe, but feel free to try different timeframes as the concept is the same.
This strategy was extensively manually tested, trade by trade, with S&P 500 ETF 15min timeframe, for back-testing results for the whole 2021 year (this is simply if you would LONG/SHORT stocks, don’t forget that if you trade Options, there is also Theta present (options price decay over time), the win rate is: 86.12%
*** If a trade was uncertain > it was marked immediately as stop-loss
*** A position was always closed at the end of the day no matter what (profit/loss)
Config: Alerts need to be set for each signal, take profit and stop-loss, it is pretty much self-explanatory, just right click the chart, select “Add alert” > next to Conditions select “Camarilla Pivot…”, for each trade signal and stop-loss, make sure it is “Once per Bar Close” and for each take-profit make sure it is “Once Per Bar”. Stop-losses are confirmed price breaks, while take-profits – we just need to touch those pivots.
Config: By Default, indicator signals are given during regular BEST (after 3PM ET – it’s power hour, which often is unpredictable + market will be closing soon) US standard market hours: 9:30AM-3PM ET, take profit and stop-losses by default are set to 9:30AM-4PM ET (US standard market hours. Both can be adjusted via Inputs. If you wish for the signals/take profit and stop-losses to be tracked 24/7 > choose the “EMPTY” space for both.
Config: Number of candles/bars to track back for opened positions is the number of Candles/Bars tracked back for each position. You can change this setting as it relates to timeframe versus trading style (day trading/swing), play around to find your best settings, by default it’s 13, which is best for day trading/15M timeframe. Please note: if position takes “too long” to reach TP or SL, it may not show TP or SL, so you need to keep an eye on this. It is best to use slightly lower number for day trading, because otherwise if you receive the same signal more than twice during the day > it will not show TP or SL for the second/third/etc. position. This is custom for you to change though, so if you want longer position tracking for the day, choose: 26 candles (this is the amount of 15M candles during the day), but keep in mind that for second/third position > it may not show you the TP1/SL.
Config: The table showing positions will show current open position on the bottom cell if position is opened per indicator, you can move or even hide this table in the indicator settings. (Please note: this is decorative thing and sometimes may show a position open, which is not actually open, especially when the market is not currently open).
Tip: Note: if pivots are too far away from each other and there is either big profit already or another support/resistance indicator (VWAP, SMA, support & resistance levels, etc.) – it is wise to take some profit off and move SL to Entry to secure profits in case market decides to turn around. This is especially wise if you trade Options as they include Theta (options price decay over time). Please note: back-test results displayed above were done without VWAP.
Tip: R5 > R4 and S5 > S4 are riskier signals as there are no pivots above/below for the SL, the script does not have a built-in stop-loss level/indicator for these, so you will need to manually set your stop-losses for these signals. Last day pivots often can help with this or simply use most recent support & resistance levels.
Tip: If trading S&P: be careful opening positions near 3PM ET, as during the “power hour” – 3-4PM ET > volatility increases and direction of the price becomes much more unpredictable. Similar: if you are in profit, it is wise to close the majority of your position at 3PM ET, before the “power hour” starts.
Tip: Very conservative trading approach: after signal happens, wait for a bounce back (price going back touching the pivot) and open position right there, that way > SL will be smaller and better risk/reward ration.
Tip: There is no limit on how many signals the script will show if it meets the conditions (in case you miss one of the signals and conditions repeat > you can still get into decent trade at next signal if it matches the condition).
Note1: if candle closes crossing/breaking several pivots at the same time and that same candle will touch take profit pivot – the script is configured to minimize showing/alerting signals/TP/SL for such conditions, so that you don’t get a very dirty chart / spammed with alerts, however sometimes it may or may not show signals and/or take profits/losses incorrectly. Overall, when you see such huge candles, it means that market volatility is bigger than usual, so a caution should be practiced.
Note2: If the signal candle almost nearly touches the first take profit area > it’s best not to open a position (you literally opening it at the first take profit pivot, and it may bounce the other way from that same pivot).
Note3: You may sometimes see take profit/stop-loss indicators in the beginning of the day or simply when pivot levels change, this is due to script registering the position open per old pivot levels and then show you take profit/stop-loss per new pivot levels.

Technical Analysis Consulting Table (TACT)Inspired by Tradingview's own "Technical Analysis Summary", I present to you a table with analogous logic.
You can track any ticker you want, no matter your chart. You can even have multiple tables to track multiple tickers. By default it tracks the Total Crypto Cap.
You can change the resolution you want to track. By default it is the same as the chart.
You can position the table to whichever corner of the chart you want. By default it draws in the bottom right corner.
Background colors and text size can be adjusted.
Indicators Used:
Oscillators
RSI(14)
STOCH(14, 3, 3)
CCI(20)
ADX(14)
AO
Momentum(10)
MACD(12, 26)
STOCH RSI(3, 3, 14, 14)
%R(14)
Bull Bear Power
UO(7,14,28)
Moving Averages
EMA(5)
SMA(5)
EMA(10)
SMA(10)
EMA(20)
SMA(20)
EMA(30)
SMA(30)
EMA(50)
SMA(50)
EMA(100)
SMA(100)
EMA(200)
SMA(200)
Ichimoku Cloud(9, 26, 52, 26)
VMWA(20)
HMA(9)
Pivots
Traditional
Fibonacci
Camarilla
Woodie
WARNING: I have observed up to a couple of seconds of signal jitter/delay, so use it with caution in very small resolutions (1s to 1m).
I hope you enjoy this and good luck with your trading. Suggestions and feedback are most welcome.

RS Alpha α | viResearchRS Alpha α | viResearch
Conceptual Foundation and Strategy Innovation
RS Alpha α is a dynamic, multi-asset crypto allocation engine designed for precision rotation among trending major assets. Grounded in intra-asset relative strength and enhanced by real-time trend classification, this model moves beyond static filters—adapting allocations to prevailing momentum and volatility regimes.
The strategy is purpose-built to extract tactical alpha in high-beta environments while minimizing whipsaw and drawdowns during uncertain conditions. It achieves this via a systematic, multi-layer filter stack: statistical ranking, trend validation, and risk-adjusted performance scoring.
Technical Architecture and Signal Composition
Relative Strength Matrix:
Assets are scored using a comprehensive 7x7 ratio matrix comparing each asset’s relative momentum against all others. Each row contributes to a cumulative trend score, identifying the top-performing names based on cross-asset strength.
Trend Filters (Multi-Timeframe Adaptive):
Each candidate must pass intra-trend classification (12H, 8H, 4H) and optionally a macro trend regime filter using a user-defined market benchmark (e.g., BTC or ETH on 1D).
Beta & Alpha Filter:
Assets are further screened using custom beta and alpha calculations versus a benchmark. When enabled, only assets showing above-median beta and alpha values are retained.
Optional Risk Ratios:
Sharpe, Sortino, and Omega ratio filters are included (opt-in) for forward testing purposes. These risk metrics refine selection in volatile regimes but are not required for core functionality.
Equity Engine & Allocation Logic:
A real-time system equity curve grows based on rate of change (ROC) from allocated assets, with support for:
100% single asset allocation
50/50 equal split if scores match closely
80/20 weighted allocation based on dominance
Performance Tracking and Alerts
System Equity Visualization: Real-time equity plotted using dynamic coloring tied to the primary asset allocation.
Drawdown Table: Tracks max equity drawdown since a user-defined start date.
Dominant Asset Panel: Displays current allocation format (100%, 80/20, or 50/50) and scoreboard of all considered assets.
Allocation Alerts: Sends alerts when asset rotation occurs, with clear breakdowns of new weightings and symbol changes.
Timeframe Guard: Warns users if running on anything other than the recommended 1D timeframe.
Customization and UX Enhancements
Asset Inclusion Toggle: Easily exclude assets from rotation by changing their input to "USDT".
Background Overlay (Optional): Background color highlights the dominant asset dynamically, with adjustable transparency.
User Switches for All Visual Modules: Toggle individual elements such as alerts, drawdown, dominant tables, or error messages.
Use Case and Target Audience
This tool is ideal for:
Active crypto portfolio managers seeking structured, rule-based asset rotation
Tactical traders who value adaptability and clarity in allocation shifts
Swing traders operating within medium to high-beta environments
It thrives particularly during bull trends, sector rotations, or when paired with macro regime filters like market confidence signals.
Summary
RS Alpha α provides a comprehensive, data-driven framework for crypto asset rotation. It combines statistical rigor with real-time responsiveness, offering high customization and strong risk awareness. Designed for professionals and advanced retail traders alike, it’s both a decision-support tool and a visual performance dashboard.
⚠️ Always validate any strategy with proper backtesting and forward tracking. While RS Alpha α provides robust signal logic, it is one component in a larger portfolio and risk management process.

Choch Pattern Levels [BigBeluga]🔵 OVERVIEW
The Choch Pattern Levels indicator automatically detects Change of Character (CHoCH) shifts in market structure — crucial moments that often signal early trend reversals or major directional transitions. It plots the structural break level, visualizes the pattern zone with triangle overlays, and tracks delta volume to help traders assess the strength behind each move.
🔵 CONCEPTS
CHoCH Pattern: A bullish CHoCH forms when price breaks a previous swing high after a swing low, while a bearish CHoCH appears when price breaks a swing low after a prior swing high.
Break Level Mapping: The indicator identifies the highest or lowest point between the pivot and the breakout, marking it with a clean horizontal level where price often reacts.
Delta Volume Tracking: Net bullish or bearish volume is accumulated between the pivot and the breakout, revealing the momentum and conviction behind each CHoCH.
Chart Clean-Up: If price later closes through the CHoCH level, the zone is automatically removed to maintain clarity and focus on active setups only.
🔵 FEATURES
Automatic CHoCH pattern detection using pivot-based logic.
Triangle shapes show structure break: pivot → breakout → internal high/low.
Horizontal level marks the structural zone with a ◯ symbol.
Optional delta volume label with directional sign (+/−).
Green visuals for bullish CHoCHs, red for bearish.
Fully auto-cleaning invalidated levels to reduce clutter.
Clean organization of all lines, labels, and overlays.
User-defined Length input to adjust pivot sensitivity.
🔵 HOW TO USE
Use CHoCH levels as early trend reversal zones or confirmation signals.
Treat bullish CHoCHs as support zones, bearish CHoCHs as resistance.
Look for high delta volume to validate the strength behind each CHoCH.
Combine with other BigBeluga tools like supply/demand, FVGs, or liquidity maps for confluence.
Adjust pivot Length based on your strategy — shorter for intraday, longer for swing trading.
🔵 CONCLUSION
Choch Pattern Levels highlights key structural breaks that can mark the start of new trends. By combining precise break detection with volume analytics and automatic cleanup, it provides actionable insights into the true intent behind price moves — giving traders a clean edge in spotting early reversals and key reaction zones.

ATR SPREADThis is a comprehensive ATR SPREAD indicator for TradingView that combines volatility monitoring with spread analysis. Here's what it does and why it's useful:
Core Functionality
ATR Progress Tracking:
Monitors how much of the daily ATR (Average True Range) has been "consumed" during the current trading day
Calculates progress from two reference points: day's open and previous day's close
Displays progress as percentages or absolute values
Provides color-coded visual feedback (green → yellow → orange → red) based on ATR consumption levels
Spread Monitoring with Advanced Filtering:
Tracks current market spreads using multiple methods (minute high-low ranges, tick-to-tick differences)
Calculates rolling average spread to establish baseline conditions
Implements sophisticated filtering to exclude anomalous spread readings that could skew analysis
Key Features
Smart Filtering System:
Automatically filters out abnormal spreads during session opens
Excludes spreads that are too large relative to price or ATR
Removes outliers that exceed normal spread multiples
Maintains data quality for accurate analysis
Multi-Level Alert System:
ATR threshold alerts (50%, 80%, 100% consumption)
Customizable warning threshold (default 70%)
Spread expansion warnings and alerts
Session start notifications
Professional Dashboard:
Customizable information panel showing real-time metrics
Multiple positioning options and visual themes
Displays ATR status, progress percentages, current/average spreads
Color-coded status indicators for quick assessment
Trading Applications
Risk Management:
Helps traders understand how much daily volatility has been used up
Assists in position sizing based on remaining expected movement
Identifies periods of unusual market conditions
Market Condition Assessment:
Monitors liquidity conditions through spread analysis
Detects when spreads widen beyond normal levels
Filters out unreliable data during volatile periods
Entry/Exit Timing:
High ATR consumption may suggest limited further movement
Low ATR consumption early in the day might indicate potential for larger moves
Spread conditions help assess execution quality expectations
This indicator is particularly valuable for intraday traders, scalpers, and anyone who needs to monitor market microstructure conditions alongside volatility metrics. It provides a comprehensive view of both price movement potential (ATR) and execution environment quality (spreads) in a single, professional-grade tool.

Signalgo XSignalgo X
Signalgo X is a sophisticated indicator crafted for traders who demand a disciplined, multi-layered approach to market analysis and trade management. This overview will help you understand its capabilities, logic, and how it can elevate your trading.
Core Concept
Signalgo X is built to:
Scan multiple timeframes simultaneously for price, volume, and volatility patterns.
Filter out unreliable signals during periods of market hype or manipulation.
Automate trade management with dynamic take-profit (TP), stop-loss (SL), and trailing logic.
Deliver actionable, visual signals and alerts for timely, confident decisions.
Inputs & Controls
Preset System Parameters:
News Sensitivity: Determines how responsive the indicator is to price moves.
Hype Filter Strength: Sets how aggressively the system avoids volatile, manipulated, or news-driven periods.
User-Configurable:
Show TP/SL Logic: Turn on/off the display of take-profit and stop-loss levels directly on your chart.
How Signalgo X Works
1. Multi-Timeframe Market Analysis
Signalgo X continuously monitors:
Closing price
Trading volume
Volatility (ATR)
across six distinct timeframes, from 1 hour to 3 months. This layered approach ensures that signals are validated by both short-term momentum and long-term trends.
2. Price, Volume, and Volatility Synthesis
Price Change: The system tracks percentage changes over each timeframe to gauge momentum.
Volume Ratio: By comparing current volume to a moving average, it detects unusual spikes that may signal institutional activity or manipulation.
Volatility: Measures the intensity of price movements relative to average ranges, helping to identify breakout or exhaustion scenarios.
3. Proprietary Anti-Hype Filter
A unique scoring mechanism evaluates:
Volume spikes without corresponding price action
Sudden jumps in volatility
Conflicting signals across timeframes
Social hype proxies (e.g., sharp moves on low volume)
If the market is deemed “hyped,” all trading signals are suppressed and a clear warning is shown, keeping you out of unpredictable conditions.
4. Signal Classification & Mapping
Significant Moves: Only price actions that exceed a sensitivity threshold and are confirmed by volume/volatility are considered.
Bullish/Bearish Signals: Generated for each timeframe.
Signal Strength: Categorized as regular, or strong based on multi-timeframe agreement.
Entry & Exit Strategy
Entry Logic
Long (Buy) Entry: Triggered when bullish signals are detected (of any strength) and no hype is present.
Short (Sell) Entry: Triggered when bearish signals are detected and no hype is present.
Exit & Trade Management
Stop Loss (SL): Placed at a calculated distance from entry, adapting to recent volatility.
Take Profits (TP1, TP2, TP3): Three profit targets, each at a greater reward multiple.
Trailing Stop: After the first take-profit is hit, the stop-loss moves to breakeven and a trailing stop is activated to protect further gains.
Event Tracking: The indicator visually marks when each TP or SL is hit, providing real-time feedback.
Chart Plots: All relevant SL, TP, and trailing stop levels are clearly marked for both long and short trades.
Labels: Entry, exit, and signal strength events are color-coded and visually prominent.
Alerts: Built-in alert conditions allow you to set up TradingView notifications for strong/regular buy/sell signals and hype warnings.
Trading Strategy Application
Multi-Timeframe Confirmation: Only strong signals confirmed by several timeframes are acted upon, reducing false positives.
Volume & Volatility Awareness: The indicator avoids low-quality, “fakeout” signals by requiring confirmation from both price and volume/volatility.
Hype Avoidance: Keeps you out of the market during news-driven or manipulated periods, helping to protect your capital.
Automated Discipline: The TP/SL logic enforces a rules-based exit strategy, helping you lock in profits and limit losses without emotional interference.
Who Should Use Signalgo X?
Signalgo X is ideal for traders who want:
Systematic, high-confidence signals
Automated and disciplined trade management
Protection against unpredictable market events
Clear, actionable visuals and alerts

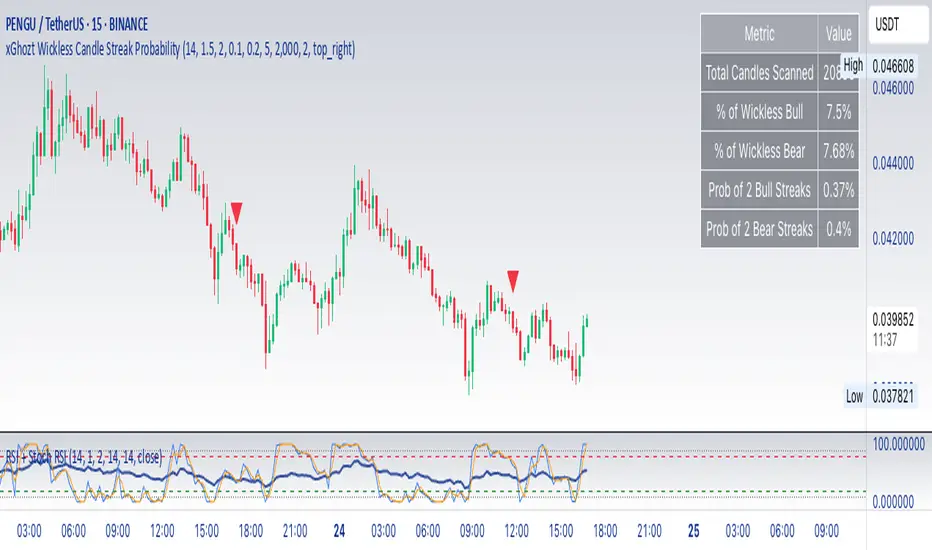
xGhozt Wickless Candle Streak ProbabilityThe xGhozt Wickless Candle Streak Probability is a custom Pine Script indicator designed to identify and quantify the occurrence of consecutive "wickless" candles of the same trend (either bullish or bearish).
Key Features:
Wickless Candle Detection: It first identifies candles that lack an upper or lower wick (meaning their open/close is equal to their high/low, respectively).
Consecutive Streak Tracking: The indicator tracks how many wickless bullish candles occur in a row, and similarly for wickless bearish candles.
User-Defined Streak Length: You can specify a Streak Length in the indicator's settings. This defines how many consecutive wickless candles are needed to register a "streak."
Probability Calculation: For the chosen Streak Length, the indicator calculates the historical probability (as a percentage) of encountering such a streak for both bullish and bearish wickless candles. This is done by dividing the number of times a streak of that length has occurred by the total number of candles scanned.
On-Chart Display: The results, including the total wickless candles, total scanned candles, and the calculated streak probabilities, are displayed in a convenient table directly on your chart.
Purpose:
This indicator helps traders and analysts understand the historical likelihood of sustained, strong directional moves as indicated by consecutive wickless candles. By quantifying these probabilities, it can provide insights into potential continuation patterns or extreme market conditions, which might be useful for developing trading strategies or confirming market biases.
RTH Standard Deviation+RTH Standard Deviation+ Indicator
Overview
The RTH Standard Deviation+ (RTH SD+) indicator is a versatile tool designed for traders to visualize key price levels based on the Regular Trading Hours (RTH) session.
It calculates and displays the high, low, equilibrium (midpoint), and standard deviation-based levels derived from the RTH session's price range.
This indicator is ideal for day traders and swing traders looking to identify potential support, resistance, and breakout zones.
Features
Customizable Session Window: Define the RTH session based on your preferred time window and timezone.
Key Price Levels: Displays high, low, equilibrium, 25%/75% quartile levels, and standard deviation levels (±0.5, ±1.0, ±1.33, ±1.66, ±2.0, and optional extended levels up to ±4.0).
Visual Elements: Includes horizontal lines, labels, boxes, and vertical lines to highlight key levels and session boundaries.
Flexible Styling: Customize line styles, colors, thicknesses, and visibility for all elements.
Extended Levels: Optional display of additional standard deviation levels (±2.25, ±2.33, ±2.5, ±2.66, ±2.75, ±3.0, ±3.25, ±3.33, ±3.5, ±3.66, ±3.75, ±4.0).
Deviation Boxes: Visualize specific standard deviation ranges (±0.1, ±1.33/1.66, ±2.33/2.66, ±3.33/3.66) with customizable colors.
Inputs
Session Window: Set the RTH session time (default: 06:00–09:00).
Timezone: Select the appropriate timezone (default: UTC-4).
Label Offset: Adjust the horizontal offset for price level labels (default: 5 bars).
Line Offset: Set the length of horizontal lines extending from the session end (default: 20 bars).
Show SD Levels: Toggle visibility of standard deviation lines (±0.5, ±1.0, ±1.33, ±1.66, ±2.0).
Show SD Labels: Enable or disable labels for standard deviation levels.
Show SD Boxes: Display shaded boxes for specific standard deviation ranges (e.g., ±1.33/1.66).
Show ±0.1 Dev Boxes: Highlight smaller deviation ranges (±0.1) with boxes.
Vertical Line: Toggle a vertical line at the session end, with customizable color, style, and thickness.
High/Low, Equilibrium, 25%/75%, ±0.1 Dev, ±1.33/1.66: Toggle visibility and customize colors, styles, and thicknesses for these levels.
Extended Levels: Enable additional standard deviation levels (e.g., ±2.25, ±2.5, etc.) for advanced analysis.
How It Works
Session Tracking: The indicator identifies the user-defined RTH session based on the specified time window and timezone.
It tracks the high, low, and equilibrium (midpoint) of the session's price action.
Price Range Calculation: At the session's end, the indicator calculates the price range (high - low) and uses it to compute standard deviation levels relative to the high, low, or equilibrium.
Level Visualization:
High/Low Lines: Display the session's high and low prices as horizontal lines, extended beyond the session end.
Equilibrium Line: Shows the midpoint of the session range.
Quartile Lines: Plots 25% and 75% levels within the session range.
Standard Deviation Lines: Displays levels at ±0.5, ±1.0, ±1.33, ±1.66, and ±2.0 standard deviations, with optional extended levels up to ±4.0.
Deviation Boxes: Shaded boxes highlight specific ranges (e.g., ±1.33/1.66) for quick reference.
±0.1 Deviation Lines/Boxes: Optional smaller deviation levels for precise analysis.
Dynamic Updates: During the session, high and low lines update in real-time. At session end, all levels are finalized and extended forward for post-session analysis.
Clearing Mechanism: When a new session begins, previous drawings are cleared to avoid clutter.
Usage
Add to Chart: Apply the indicator to your TradingView chart via the Pine Editor or Indicator menu.
Configure Settings:
Adjust the session window and timezone to match your market (e.g., 09:30–16:00 UTC-4 for US equities RTH).
Customize visibility, colors, styles, and thicknesses to suit your chart preferences.
Enable extended levels for deeper analysis or disable them for simplicity.
Interpret Levels:
High/Low: Act as potential support/resistance or breakout levels.
Equilibrium: Represents the session's midpoint, often a pivot point.
25%/75% Quartiles: Indicate intermediate levels within the session range.
Standard Deviation Levels: Highlight statistically significant price zones for potential reversals or breakouts.
Boxes: Emphasize key zones for quick visual reference.
Trading Application: Use levels to identify entry/exit points, set stop-losses, or gauge market volatility.
For example, ±1.0 standard deviation levels often act as strong support/resistance, while ±2.0 levels may indicate overextension.
Notes
Ensure the session window aligns with the market’s trading hours for accurate calculations.
The indicator is designed for intraday and post-session analysis but can be adapted for other timeframes.
Use in conjunction with other technical analysis tools for comprehensive decision-making.
Extended levels (±2.25 and beyond) are disabled by default to reduce chart clutter but can be enabled for specific strategies.
TradingView House Rules Compliance
This indicator contains no copyrighted material and adheres to TradingView’s Pine Script guidelines.
This indicator was approved and created with @TIMELESS1_

LANZ Strategy 1.0🔷 LANZ Strategy 1.0 — Session-Based Directional Logic with Visual Multi-Account Risk Management
LANZ Strategy 1.0 is a structured and disciplined trading strategy designed for the 1-hour timeframe, operating during the NY session and executing trades overnight. It uses the directional behavior between 08:00 and 18:00 New York time to define precise limit entries for the following night. Ideal for traders who prefer time-based execution, clear visuals, and professional risk management across multiple accounts.
🧠 Core Components:
1. Session Direction Confirmation:
At 18:00 NY, the system evaluates the market direction by comparing the open at 08:00 vs the close at 18:00:
If the direction matches the previous day, it is reversed.
If it differs, the current day’s direction is kept.
This logic is designed to avoid trend exhaustion and favor potential reversal opportunities.
2. EP Level & Risk Definition:
Once direction is defined:
For BUY, EP is set at the Low of the session.
For SELL, EP is set at the High of the session.
The system automatically plots:
SL fixed at 18 pips from EP
TP at 3.00× the risk → 54 pips from EP
All levels (EP, SL, TP) are shown with visual lines and price labels.
3. Time-Restricted Entry Execution:
The entry is only valid if price touches the EP between 19:00 and 08:00 NY.
If EP is not touched before 08:00 NY, the trade is automatically cancelled.
4. Multi-Account Lot Sizing:
Traders can configure up to five different accounts, each with its own capital and risk percentage.
The system calculates and displays the lot size per account, based on SL distance and pip value, in a dynamic floating label.
5. Outcome Tracking:
If TP is hit, a +3.00% profit label is displayed along with a congratulatory alert.
If SL is hit, a -1.00% label appears with a loss alert.
If the trade is still open by 09:00 NY, it is manually closed, and the result is shown as a percentage of the initial risk.
📊 Visual Features:
Custom-colored angle and guide lines.
Dynamic angle line starts at 08:00 NY and tracks price until 18:00.
Shaded backgrounds for key time zones (e.g., 08:00, 18:00, 19:00).
BUY/SELL signals shown at 19:00 based on match/divergence logic.
Label panel showing risk metrics and lot size for each active account.
⚙️ How It Works:
08:00 NY: Marks the session open and initiates a dynamic angle line.
18:00 NY: Evaluates the session direction and calculates EP/SL/TP based on outcome.
19:00 NY: Activates limit order monitoring.
During the night (until 08:00 NY): If EP is touched, the trade is triggered.
At 08:00 NY: If no touch occurred, trade is cancelled.
Overnight: TP/SL logic is enforced, showing percentage outcomes.
At 09:00 NY: If still open, trade is closed manually and result is labeled visually.
🔔 Alerts:
🚀 EP execution alert when touched
💢 Stop Loss hit alert
⚡ Take Profit hit alert
✅ Manual close at 09:00 NY with performance result
🔔 Daily reminder at 19:00 NY to configure and prepare the trade
📝 Notes:
Strategy is exclusive to the 1-hour timeframe.
Works best on assets with clean NY session movement.
Perfect for structured, semi-automated swing/overnight trading styles.
Fully visual, self-explanatory, and backtest-friendly.
👨💻 Credits:
Developed by LANZ
A strategy created with precision, discipline, and a vision for traders who value time-based entries, clean execution logic, and visual confidence on the chart.
Special thanks to Kairos — your AI assistant — for the detailed structure, scripting, and documentation of the strategy.

ACE FVG & IFVG Trading System1. What the Script Does
The "ACE FVG & IFVG Trading System " is a TradingView Pine Script (version 5) that identifies and trades Fair Value Gaps (FVGs) and Inverse Fair Value Gaps (IFVGs). It offers:
Detection of bullish/bearish FVGs and IFVGs with customizable parameters.
Multiple entry types: regular FVG retracement, Break of Structure (BOS), breakaway gaps, and Immediate/Retrace IFVG entries.
A pending setup system showing potential trades before they trigger.
Risk management with configurable stop loss (SL) and take profit (TP) based on FVG levels, swing points, or risk-reward ratios.
Market structure analysis using swing highs/lows, BOS, and Market Structure Shifts (MSS).
Time filters to restrict trading to specific sessions.
Visualizations including FVG boxes, trade boxes, pivot lines, and labels.
Entry and performance tables displaying trade details and metrics like win rates and P&L by entry type.
2. How It Works
The script is organized into modular sections for efficient execution:
Inputs: Extensive customization options (e.g., FVG size, entry types, SL/TP modes, time filters) grouped for clarity.
Data Structures: Custom types (FVGData, SwingPoint, EntryData) store FVG, pivot, and trade data in arrays.
Utility Functions: Handle calculations like risk-reward ratios, time validation, and trade size filtering.
Swing Point Detection: Uses ta.pivothigh/ta.pivotlow to identify pivots, supporting BOS/MSS and SL/TP calculations.
FVG Detection: Identifies regular FVGs (low > high or high < low ) and IFVGs (mitigated FVGs with immediate or retrace signals).
Entry Logic: Triggers trades based on user-enabled conditions (e.g., retracement, BOS, breakaway gaps) with dynamic SL/TP.
Trade Management: Tracks active/pending trades, updates visualizations (boxes, lines, labels), and handles cancellations/invalidations.
Main Logic: Executes on each bar to detect FVGs, process entries, update trades, and manage visualizations.
Tables: Displays recent trades and performance stats (e.g., win rates by entry type) on the last bar.
Pivot Visualization: Plots swing points with dynamic extensions and mitigation status (solid/dotted lines).
3. How to Use It
Add to TradingView:
Open Pine Editor, paste the script, save it, and add to chart.
Configure Inputs:
Access settings via chart (right-click indicator > Settings).
Adjust:
fvgMinSize for market volatility (e.g., 5 for forex).
Entry types (e.g., enable IFVG, disable breakaway gaps).
SL/TP modes and minimum R:R (e.g., 2.0 for 1:2).
Time filters for active sessions (e.g., 09:30-16:00).
Visual settings (box transparency, table positions).
Interpret Output:
FVG Boxes: Green (bullish), red (bearish), purple (IFVG/mitigated).
Trade Boxes: Gray-green/red-gray (pending), green/red (active), updated for win/loss.
Pivot Lines: Solid (unmitigated), dotted (mitigated).
Tables: Entry table shows trade details; performance table shows win rates/P&L.
Trading:
Monitor pending setups for entry signals.
Enter manually at active trade levels, following SL/TP.
Use performance stats to refine settings.
Test on demo charts and adjust for market/timeframe.
Best Practices:
Use higher timeframes (e.g., 1H, 4H) for less noise.
Combine with other analysis (e.g., support/resistance).
Backtest using TradingView’s replay feature.
Originality
The script is original due to its unique combination of features:
Enhanced IFVG Strategy: Dual Immediate/Retrace IFVG modes with a novel “Immediate Then Retrace” preference.
Pending Setup System: Proactive visualization of potential trades with auto-cancellation.
Granular Performance Tracking: Detailed breakdown of win rates/P&L by entry type (regular FVG, IFVG, breakaway).
Dynamic Pivot Visualization: Real-time mitigation updates (solid to dotted lines).
Modular Design: Custom types and organized logic for extensibility. It builds on general FVG concepts (e.g., from ICT) but implements unique logic and features not found in standard
TradingView FVG scripts, distinguishing it from both open-source and premium indicators.
Credit of Concepts to ICT
Collaborations with JMAC and Timeless

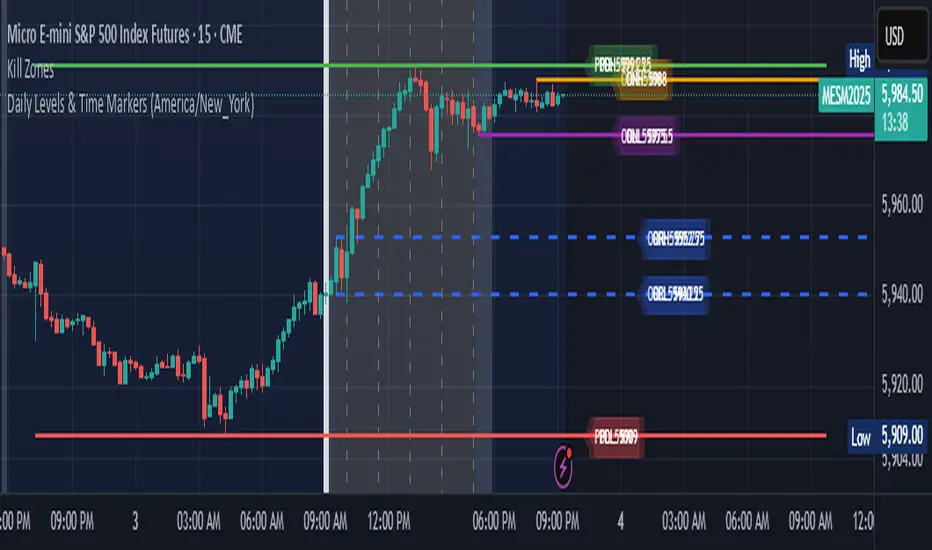
Daily Levels & Time MarkersKey Features:
Price Level Tracking:
Previous Day High/Low (PDH/PDL) - Shows yesterday's highest and lowest prices as horizontal lines
Overnight High/Low (ONH/ONL) - Tracks the highest and lowest prices during overnight sessions (4:00 PM to 9:30 AM ET)
Opening Range High/Low (ORH/ORL) - Captures the price range during the first 30 minutes of regular trading (9:30-10:00 AM ET)
Visual Elements:
Draws horizontal lines for previous day levels that extend across the chart
Creates rays (extending lines) for overnight and opening range levels that project forward from when they were established
Uses different colors and line styles for each level type (solid lines for daily levels, dashed for opening range)
Adds text labels showing the exact price values (PDH, PDL, ONH, ONL, ORH, ORL)
Time Markers:
Draws vertical dashed lines at key trading times: 10:00 AM, 11:30 AM, 1:00 PM, 2:30 PM, and 4:00 PM ET
Uses Eastern Time zone by default but allows customization
Customization Options:
Toggle each feature on/off independently
Customize colors for all line types
Adjust timezone settings
FvgObject█ OVERVIEW
This library provides a suite of methods designed to manage the visual representation and lifecycle of Fair Value Gap (FVG) objects on a Pine Script™ chart. It extends the `fvgObject` User-Defined Type (UDT) by attaching object-oriented functionalities for drawing, updating, and deleting FVG-related graphical elements. The primary goal is to encapsulate complex drawing logic, making the main indicator script cleaner and more focused on FVG detection and state management.
█ CONCEPTS
This library is built around the idea of treating each Fair Value Gap as an "object" with its own visual lifecycle on the chart. This is achieved by defining methods that operate directly on instances of the `fvgObject` UDT.
Object-Oriented Approach for FVGs
Pine Script™ v6 introduced the ability to define methods for User-Defined Types (UDTs). This library leverages this feature by attaching specific drawing and state management functions (methods) directly to the `fvgObject` type. This means that instead of calling global functions with an FVG object as a parameter, you call methods *on* the FVG object itself (e.g., `myFvg.updateDrawings(...)`). This approach promotes better code organization and a more intuitive way to interact with FVG data.
FVG Visual Lifecycle Management
The core purpose of this library is to manage the complete visual journey of an FVG on the chart. This lifecycle includes:
Initial Drawing: Creating the first visual representation of a newly detected FVG, including its main box and optionally its midline and labels.
State Updates & Partial Fills: Modifying the FVG's appearance as it gets partially filled by price. This involves drawing a "mitigated" portion of the box and adjusting the `currentTop` or `currentBottom` of the remaining FVG.
Full Mitigation & Tested State: Handling how an FVG is displayed once fully mitigated. Depending on user settings, it might be hidden, or its box might change color/style to indicate it has been "tested." Mitigation lines can also be managed (kept or deleted).
Midline Interaction: Visually tracking if the price has touched the FVG's 50% equilibrium level (midline).
Visibility Control: Dynamically showing or hiding FVG drawings based on various criteria, such as user settings (e.g., hide mitigated FVGs, timeframe-specific visibility) or external filters (e.g., proximity to current price).
Deletion: Cleaning up all drawing objects associated with an FVG when it's no longer needed or when settings dictate its removal.
Centralized Drawing Logic
By encapsulating all drawing-related operations within the methods of this library, the main indicator script is significantly simplified. The main script can focus on detecting FVGs and managing their state (e.g., in arrays), while delegating the complex task of rendering and updating them on the chart to the methods herein.
Interaction with `fvgObject` and `drawSettings` UDTs
All methods within this library operate on an instance of the `fvgObject` UDT. This `fvgObject` holds not only the FVG's price/time data and state (like `isMitigated`, `currentTop`) but also the IDs of its associated drawing elements (e.g., `boxId`, `midLineId`).
The appearance of these drawings (colors, styles, visibility, etc.) is dictated by a `drawSettings` UDT instance, which is passed as a parameter to most drawing-related methods. This `drawSettings` object is typically populated from user inputs in the main script, allowing for extensive customization.
Stateful Drawing Object Management
The library's methods manage Pine Script™ drawing objects (boxes, lines, labels) by storing their IDs within the `fvgObject` itself (e.g., `fvgObject.boxId`, `fvgObject.mitigatedBoxId`, etc.). Methods like `draw()` create these objects and store their IDs, while methods like `updateDrawings()` modify them, and `deleteDrawings()` removes them using these stored IDs.
Drawing Optimization
The `updateDrawings()` method, which is the most comprehensive drawing management function, incorporates optimization logic. It uses `prev_*` fields within the `fvgObject` (e.g., `prevIsMitigated`, `prevCurrentTop`) to store the FVG's state from the previous bar. By comparing the current state with the previous state, and also considering changes in visibility or relevant drawing settings, it can avoid redundant and performance-intensive drawing operations if nothing visually significant has changed for that FVG.
█ METHOD USAGE AND WORKFLOW
The methods in this library are designed to be called in a logical sequence as an FVG progresses through its lifecycle. A crucial prerequisite for all visual methods in this library is a properly populated `drawSettings` UDT instance, which dictates every aspect of an FVG's appearance, from colors and styles to visibility and labels. This `settings` object must be carefully prepared in the main indicator script, typically based on user inputs, before being passed to these methods.
Here’s a typical workflow within a main indicator script:
1. FVG Instance Creation (External to this library)
An `fvgObject` instance is typically created by functions in another library (e.g., `FvgCalculations`) when a new FVG pattern is identified. This object will have its core properties (top, bottom, startTime, isBullish, tfType) initialized.
2. Initial Drawing (`draw` method)
Once a new `fvgObject` is created and its initial visibility is determined:
Call the `myFvg.draw(settings)` method on the new FVG object.
`settings` is an instance of the `drawSettings` UDT, containing all relevant visual configurations.
This method draws the primary FVG box, its midline (if enabled in `settings`), and any initial labels. It also initializes the `currentTop` and `currentBottom` fields of the `fvgObject` if they are `na`, and stores the IDs of the created drawing objects within the `fvgObject`.
3. Per-Bar State Updates & Interaction Checks
On each subsequent bar, for every active `fvgObject`:
Interaction Check (External Logic): It's common to first use logic (e.g., from `FvgCalculations`' `fvgInteractionCheck` function) to determine if the current bar's price interacts with the FVG.
State Field Updates (External Logic): Before calling the `FvgObjectLib` methods below, ensure that your `fvgObject`'s state fields (such as `isMitigated`, `currentTop`, `currentBottom`, `isMidlineTouched`) are updated using the current bar's price data and relevant functions from other libraries (e.g., `FvgCalculations`' `checkMitigation`, `checkPartialMitigation`, etc.). This library's methods render the FVG based on these pre-updated state fields.
If interaction occurs and the FVG is not yet fully mitigated:
Full Mitigation Update (`updateMitigation` method): Call `myFvg.updateMitigation(high, low)`. This method updates `myFvg.isMitigated` and `myFvg.mitigationTime` if full mitigation occurs, based on the interaction determined by external logic.
Partial Fill Update (`updatePartialFill` method): If not fully mitigated, call `myFvg.updatePartialFill(high, low, settings)`. This method updates `myFvg.currentTop` or `myFvg.currentBottom` and adjusts drawings to show the filled portion, again based on prior interaction checks and fill level calculations.
Midline Touch Check (`checkMidlineTouch` method): Call `myFvg.checkMidlineTouch(high, low)`. This method updates `myFvg.isMidlineTouched` if the price touches the FVG's 50% level.
4. Comprehensive Visual Update (`updateDrawings` method)
After the FVG's state fields have been potentially updated by external logic and the methods in step 3:
Call `myFvg.updateDrawings(isVisibleNow, settings)` on each FVG object.
`isVisibleNow` is a boolean indicating if the FVG should currently be visible.
`settings` is the `drawSettings` UDT instance.
This method synchronizes the FVG's visual appearance with its current state and settings, managing all drawing elements (boxes, lines, labels), their styles, and visibility. It efficiently skips redundant drawing operations if the FVG's state or visibility has not changed, thanks to its internal optimization using `prev_*` fields, which are also updated by this method.
5. Deleting Drawings (`deleteDrawings` method)
When an FVG object is no longer tracked:
Call `myFvg.deleteDrawings(deleteTestedToo)`.
This method removes all drawing objects associated with that `fvgObject`.
This workflow ensures that FVG visuals are accurately maintained throughout their existence on the chart.
█ NOTES
Dependencies: This library relies on `FvgTypes` for `fvgObject` and `drawSettings` definitions, and its methods (`updateMitigation`, `updatePartialFill`) internally call functions from `FvgCalculations`.
Drawing Object Management: Be mindful of TradingView's limits on drawing objects per script. The main script should manage the number of active FVG objects.
Performance and `updateDrawings()`: The `updateDrawings()` method is comprehensive. Its internal optimization (checking `hasStateChanged` based on `prev_*` fields) is crucial for performance. Call it judiciously.
Role of `settings.currentTime`: The `currentTime` field in `drawSettings` is key for positioning time-dependent elements like labels and the right edge of non-extended drawings.
Mutability of `fvgObject` Instances: Methods in this library directly modify the `fvgObject` instance they are called upon (e.g., its state fields and drawing IDs).
Drawing ID Checks: Methods generally check if drawing IDs are `na` before acting on them, preventing runtime errors.
█ EXPORTED FUNCTIONS
method draw(this, settings)
Draws the initial visual representation of the FVG object on the chart. This includes the main FVG box, its midline (if enabled), and a label
(if enabled for the specific timeframe). This method is typically invoked
immediately after an FVG is first detected and its initial properties are set. It uses drawing settings to customize the appearance based on the FVG's timeframe type.
Namespace types: types.fvgObject
Parameters:
this (fvgObject type from no1x/FvgTypes/1) : The FVG object instance to be drawn. Core properties (top, bottom,
startTime, isBullish, tfType) should be pre-initialized. This method will
initialize boxId, midLineId, boxLabelId (if applicable), and
currentTop/currentBottom (if currently na) on this object.
settings (drawSettings type from no1x/FvgTypes/1) : A drawSettings object providing all visual parameters. Reads display settings (colors, styles, visibility for boxes, midlines, labels,
box extension) relevant to this.tfType. settings.currentTime is used for
positioning labels and the right boundary of non-extended boxes.
method updateMitigation(this, highVal, lowVal)
Checks if the FVG has been fully mitigated by the current bar's price action.
Namespace types: types.fvgObject
Parameters:
this (fvgObject type from no1x/FvgTypes/1) : The FVG object instance. Reads this.isMitigated, this.isVisible,
this.isBullish, this.top, this.bottom. Updates this.isMitigated and
this.mitigationTime if full mitigation occurs.
highVal (float) : The high price of the current bar, used for mitigation check.
lowVal (float) : The low price of the current bar, used for mitigation check.
method updatePartialFill(this, highVal, lowVal, settings)
Checks for and processes partial fills of the FVG.
Namespace types: types.fvgObject
Parameters:
this (fvgObject type from no1x/FvgTypes/1) : The FVG object instance. Reads this.isMitigated, this.isVisible,
this.isBullish, this.currentTop, this.currentBottom, original this.top/this.bottom,
this.startTime, this.tfType, this.isLV. Updates this.currentTop or
this.currentBottom, creates/updates this.mitigatedBoxId, and may update this.boxId's
top/bottom to reflect the filled portion.
highVal (float) : The high price of the current bar, used for partial fill check.
lowVal (float) : The low price of the current bar, used for partial fill check.
settings (drawSettings type from no1x/FvgTypes/1) : The drawing settings. Reads timeframe-specific colors for mitigated
boxes (e.g., settings.mitigatedBullBoxColor, settings.mitigatedLvBullColor),
box extension settings (settings.shouldExtendBoxes, settings.shouldExtendMtfBoxes, etc.),
and settings.currentTime to style and position the mitigatedBoxId and potentially adjust the main boxId.
method checkMidlineTouch(this, highVal, lowVal)
Checks if the FVG's midline (50% level or Equilibrium) has been touched.
Namespace types: types.fvgObject
Parameters:
this (fvgObject type from no1x/FvgTypes/1) : The FVG object instance. Reads this.midLineId, this.isMidlineTouched,
this.top, this.bottom. Updates this.isMidlineTouched if a touch occurs.
highVal (float) : The high price of the current bar, used for midline touch check.
lowVal (float) : The low price of the current bar, used for midline touch check.
method deleteDrawings(this, deleteTestedToo)
Deletes all visual drawing objects associated with this FVG object.
Namespace types: types.fvgObject
Parameters:
this (fvgObject type from no1x/FvgTypes/1) : The FVG object instance. Deletes drawings referenced by boxId,
mitigatedBoxId, midLineId, mitLineId, boxLabelId, mitLineLabelId,
and potentially testedBoxId, keptMitLineId. Sets these ID fields to na.
deleteTestedToo (simple bool) : If true, also deletes drawings for "tested" FVGs
(i.e., testedBoxId and keptMitLineId).
method updateDrawings(this, isVisibleNow, settings)
Manages the comprehensive update of all visual elements of an FVG object
based on its current state (e.g., active, mitigated, partially filled) and visibility. It handles the drawing, updating, or deletion of FVG boxes (main and mitigated part),
midlines, mitigation lines, and their associated labels. Visibility is determined by the isVisibleNow parameter and relevant settings
(like settings.shouldHideMitigated or timeframe-specific show flags). This method is central to the FVG's visual lifecycle and includes optimization
to avoid redundant drawing operations if the FVG's relevant state or appearance
settings have not changed since the last bar. It also updates the FVG object's internal prev_* state fields for future optimization checks.
Namespace types: types.fvgObject
Parameters:
this (fvgObject type from no1x/FvgTypes/1) : The FVG object instance to update. Reads most state fields (e.g.,
isMitigated, currentTop, tfType, etc.) and updates all drawing ID fields
(boxId, midLineId, etc.), this.isVisible, and all this.prev_* state fields.
isVisibleNow (bool) : A flag indicating whether the FVG should be currently visible. Typically determined by external logic (e.g., visual range filter). Affects
whether active FVG drawings are created/updated or deleted by this method.
settings (drawSettings type from no1x/FvgTypes/1) : A fully populated drawSettings object. This method extensively
reads its fields (colors, styles, visibility toggles, timeframe strings, etc.)
to render FVG components according to this.tfType and current state. settings.currentTime is critical for positioning elements like labels and extending drawings.

NY Reversal Pattern StatsThe NY Reversal Pattern Stats indicator is a tool for identifying and analyzing specific price action patterns that occur during the New York trading session. Its goal is to highlight potential reversal or continuation opportunities that may arise from market manipulation or shifts in volatility within this key market window. Beyond simply identifying patterns, the indicator provides valuable historical statistics on their performance, helping traders evaluate their effectiveness.
Key Features
New York Session Highlighting: Clearly visualizes the defined New York trading session directly on your chart.
Automated Pattern Detection: Automatically detects two types of patterns within the New York session:
Manipulation Wick: Identifies instances where price attempts to push significantly beyond a recent session extreme but is rejected, resulting in a wick with the close returning to the original side.
Low Volatility Reversal: Detects price interaction with a recent session extreme where the resulting candle shows lower-than-average volatility, suggesting potential exhaustion or a reversal point.
Pattern Confirmation Tracking: Tracks whether a detected pattern leads to a follow-through move based on a defined confirmation rule (currently, price returning to the session midpoint).
Comprehensive Statistics Table: Displays a detailed table on the chart summarizing:
Total patterns observed.
Number of patterns that were confirmed.
Success and failure rates.
Maximum losing streak.
Statistical relevance metrics (Sigma, Z-Score, P-value) to help assess if the observed success rate is likely due to chance.
A clear description interpreting the statistical relevance and pattern performance (more often right/wrong).
Customizable Visuals: Allows users to control the appearance of the session background and pattern labels.
Alerts: Provides options to set alerts when a new pattern is detected or when a detected pattern is confirmed.
How to Use the Indicator
Add to Chart: Apply the "NY Reversal Pattern Stats" indicator to your desired chart in TradingView.
Configure Inputs: Open the indicator's settings to customize the parameters:
Session Time Definition: Set the exact start hour, minute, and duration (in hours) for the New York session you wish to analyze. Use the "NY Time" inputs (e.g., 6:00 AM - 10:00 AM for Indices, 5:00 AM - 9:00 AM for Forex). The indicator uses the "America/New_York" timezone to handle Daylight Saving Time.
NY Session Visuals: Choose whether to display the session background and pattern labels, and customize their colors.
Pattern Detection: Adjust the sensitivity of the Manipulation Wick threshold and configure the settings for the Low Volatility Reversal pattern detection (enable/disable, ATR length, volatility factor).
Confirmation: Enable or disable the session midpoint confirmation criterion.
Show Statistics Table: Toggle the visibility of the statistics table.
Interpret the Chart: Observe the highlighted New York session windows and the labels indicating detected and confirmed patterns.
Analyze the Statistics Table: Refer to the statistics table for historical performance data.
Total Patterns: Indicates the sample size. More patterns generally lead to more statistically reliable results.
Confirmed/Failed: Shows the raw counts of successful and unsuccessful patterns based on the confirmation rule.
Success/Fail Rate (%): Provides the percentage of patterns that met or did not meet the confirmation criterion.
Statistical Relevance: Read the description provided in the table. It interprets the Z-Score and sample size to tell you if the observed success rate is statistically significant (i.e., unlikely to be just random chance).
Pattern Performance: Read the description indicating whether the pattern has historically been "More often right than wrong" or "More often wrong than right" based on the success rate.
Sigma / Z-Score / P-value: These are standard statistical measures. A higher absolute Z-Score and a lower P-value (especially below 0.05 or 0.01) suggest stronger statistical evidence that the pattern's success rate is different from a random 50/50 outcome.
Set Alerts: If desired, configure alerts to be notified when patterns are detected or confirmed, allowing you to potentially take action in real-time.
Interpretation of Results
High Success Rate + High Statistical Relevance: This combination suggests the detected pattern, as defined and confirmed by the indicator, has historically shown a consistent edge within the specified New York session window, and this performance is unlikely due to random chance.
High Success Rate + Low Statistical Relevance: The pattern has performed well in the observed data, but the sample size might be too small for high confidence that this performance will continue.
Low Success Rate + High Statistical Relevance: The pattern, as defined, has historically shown a tendency to fail more often than succeed, and this underperformance is statistically significant.
Low Statistical Relevance (Regardless of Success Rate): The sample size is insufficient to draw strong conclusions about the pattern's effectiveness. More historical data is needed.
Remember that past performance is not indicative of future results. Statistical analysis provides insights into historical tendencies, but trading decisions should always involve a comprehensive analysis and risk management plan.
Limitations
Timeframe Dependency: The pattern detection and session high/low accumulation operate on the chart's current timeframe. It does not specifically analyze only the 4-hour candles as might be implied by "4H Candle Profiling Patterns".
Confirmation Criterion: The confirmation rule is fixed to price returning to the session midpoint. If your strategy uses a different confirmation or target, this indicator's statistics may not directly reflect its performance.
No London/Asia Filter: The indicator does not check the performance or characteristics of the London or Asia sessions to filter for instances where "London and Asia Fail".
Potential Timezone Compiler Issues: While the code uses standard v6 timezone handling, some specific TradingView environments may exhibit unexpected behavior with timezone strings, potentially affecting the precise timing of the session boundaries.
This indicator is a powerful tool for analyzing specific price action patterns during the New York session. By understanding its inputs, outputs, and limitations, traders can gain valuable insights into potential trading opportunities.
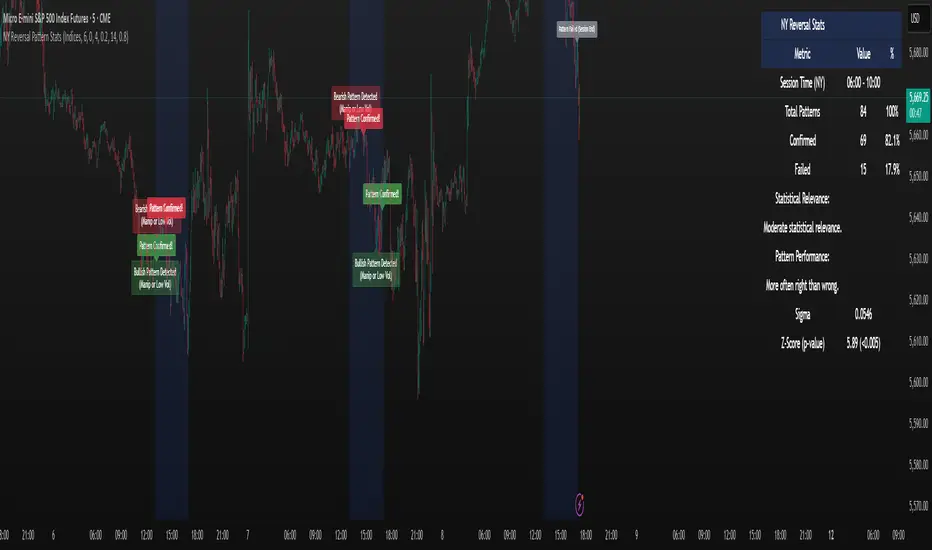
Nifty Sectoral Performance ComparisonThis Pine Script indicator tracks and compares the percentage performance of Indian sectoral and thematic indices (e.g., Nifty 50, Nifty Bank, Nifty IT) relative to their starting price in a user-defined timeframe. Performance is plotted as colored lines on the chart, with transparent labels showing percentage changes. A user-configurable label offset ensures clarity. Ideal for analyzing sectoral trends in the Indian market.
Features
Multi-Index Tracking:
Monitors up to 21 indices in five groups:
Core/Large Cap: Nifty 50, Nifty Bank, Nifty Auto, Nifty IT, Nifty FMCG, Nifty Fin Services
Thematic/Sectoral: SENSEX, Nifty Healthcare, Nifty Metal, Nifty Pharma
Bank Sub-Indices & Realty: Nifty Pvt Bank, Nifty PSU Bank, Nifty Realty
Consumption & Energy: Nifty ConsDurables, Nifty Oil & Gas
MidSmall Cap Thematic: Nifty MidSmFinSrv, S&P BSE Healthcare, Nifty MidSmIT&Tel
Calculates performance as the percentage change from the first valid close in the timeframe.
Customizable Display:
Toggle each index on/off via boolean inputs.
Define ticker symbols and colors for each index (e.g., Blue for Nifty 50, Green for Nifty Fin Services).
Colors are preset but editable for clear differentiation.
Labeling:
Displays index name and performance (e.g., "Nifty 50: 12.34%") with transparent labels (no background).
Labels match the plot color and are positioned using a user-defined offset (in bars) to avoid overlap.
Precision and Timeframe:
Shows performance with two decimal places.
Supports custom timeframes (e.g., daily, weekly) for flexible analysis.
Overlay Mode:
Plots performance lines on the price chart for direct comparison with price movements.
Inputs
Label Offset (Bars): Set label position left of the current bar (default: 5, min: 0).
Show : Enable/disable each index’s plot and label.
Ticker : Specify ticker symbols (e.g., NSE:NIFTY).
Color : Choose plot and label colors.
How It Works
Performance Calculation:
Fetches closing prices via request.security for the specified ticker and timeframe.
Captures the first valid close as the starting price.
Computes performance: ((current_price / start_price) - 1) * 100.
Handles invalid data (e.g., na or zero start price) by returning na.
Plotting:
Plots enabled indices with valid performance as lines (linewidth: 1) in user-defined colors.
Labeling:
Creates labels for enabled indices with valid performance at bar_index - label_offset and the performance value.
Labels show the index name and percentage (e.g., "Auto: 5.67%") in the plot’s color, with no background.
Usage
Setup: Apply to a TradingView chart and set the desired timeframe.
Customize:
Enable relevant indices, adjust tickers, and modify colors.
Set Label Offset to position labels clearly.
Analyze:
Compare lines to spot outperforming/underperforming sectors.
Use labels for precise performance values.
Pair with price action or other indicators for trading insights.

Asian & London Session Highs/LowsAsian & London Session Highs/Lows with Extendable Lines
This TradingView script automatically marks the highs and lows of the Asian and London trading sessions for the most recent day, allowing traders to identify key levels during these active periods. The lines representing the high and low of each session are drawn at the exact price point where the high/low occurred, and they extend to the right for a customizable number of bars, helping to visualize how the price reacts to these key levels after the session ends.
Key Features:
Session High/Low Tracking: Automatically tracks the highest and lowest points for the Asian and London sessions.
Extendable Lines: Lines start at the exact bar where the high/low occurred and can be extended to the right for a specified number of bars.
Timezone Adjustment: Allows you to input a timezone offset to adjust session times based on your local time or desired market time zone.
Customizable Colors & Line Thickness: Adjust the color and thickness of the session high and low lines to suit your visual preferences.
Clear & Precise Levels: Helps identify important support and resistance levels, making it easier to spot market reactions around session highs and lows.
This indicator is perfect for day traders and those looking to trade during specific market hours, offering clear visual markers of session boundaries and critical price levels.
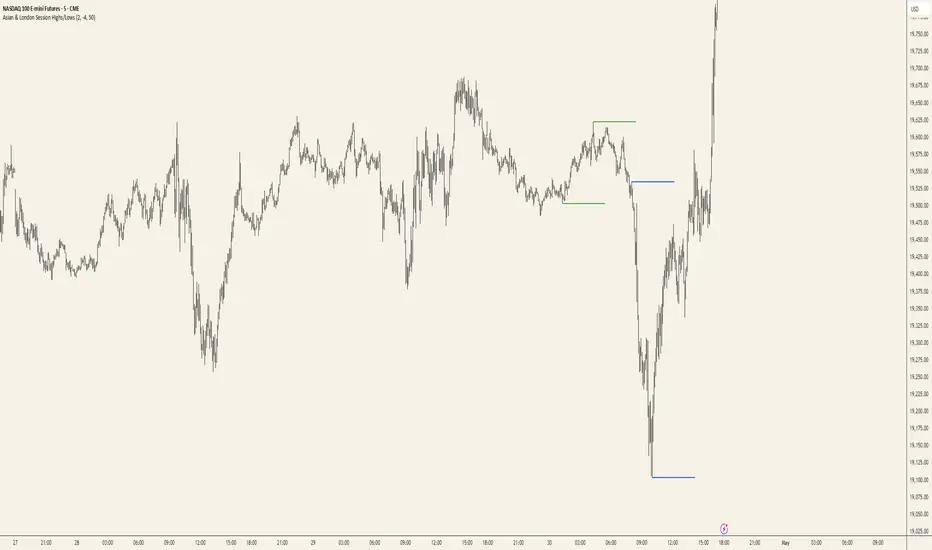
Dskyz (DAFE) Adaptive Regime - Quant Machine ProDskyz (DAFE) Adaptive Regime - Quant Machine Pro:
Buckle up for the Dskyz (DAFE) Adaptive Regime - Quant Machine Pro, is a strategy that’s your ultimate edge for conquering futures markets like ES, MES, NQ, and MNQ. This isn’t just another script—it’s a quant-grade powerhouse, crafted with precision to adapt to market regimes, deliver multi-factor signals, and protect your capital with futures-tuned risk management. With its shimmering DAFE visuals, dual dashboards, and glowing watermark, it turns your charts into a cyberpunk command center, making trading as thrilling as it is profitable.
Unlike generic scripts clogging up the space, the Adaptive Regime is a DAFE original, built from the ground up to tackle the chaos of futures trading. It identifies market regimes (Trending, Range, Volatile, Quiet) using ADX, Bollinger Bands, and HTF indicators, then fires trades based on a weighted scoring system that blends candlestick patterns, RSI, MACD, and more. Add in dynamic stops, trailing exits, and a 5% drawdown circuit breaker, and you’ve got a system that’s as safe as it is aggressive. Whether you’re a newbie or a prop desk pro, this strat’s your ticket to outsmarting the markets. Let’s break down every detail and see why it’s a must-have.
Why Traders Need This Strategy
Futures markets are a gauntlet—fast moves, volatility spikes (like the April 28, 2025 NQ 1k-point drop), and institutional traps that punish the unprepared. Meanwhile, platforms are flooded with low-effort scripts that recycle old ideas with zero innovation. The Adaptive Regime stands tall, offering:
Adaptive Intelligence: Detects market regimes (Trending, Range, Volatile, Quiet) to optimize signals, unlike one-size-fits-all scripts.
Multi-Factor Precision: Combines candlestick patterns, MA trends, RSI, MACD, volume, and HTF confirmation for high-probability trades.
Futures-Optimized Risk: Calculates position sizes based on $ risk (default: $300), with ATR or fixed stops/TPs tailored for ES/MES.
Bulletproof Safety: 5% daily drawdown circuit breaker and trailing stops keep your account intact, even in chaos.
DAFE Visual Mastery: Pulsing Bollinger Band fills, dynamic SL/TP lines, and dual dashboards (metrics + position) make signals crystal-clear and charts a work of art.
Original Craftsmanship: A DAFE creation, built with community passion, not a rehashed clone of generic code.
Traders need this because it’s a complete, adaptive system that blends quant smarts, user-friendly design, and DAFE flair. It’s your edge to trade with confidence, cut through market noise, and leave the copycats in the dust.
Strategy Components
1. Market Regime Detection
The strategy’s brain is its ability to classify market conditions into five regimes, ensuring signals match the environment.
How It Works:
Trending (Regime 1): ADX > 20, fast/slow EMA spread > 0.3x ATR, HTF RSI > 50 or MACD bullish (htf_trend_bull/bear).
Range (Regime 2): ADX < 25, price range < 3% of close, no HTF trend.
Volatile (Regime 3): BB width > 1.5x avg, ATR > 1.2x avg, HTF RSI overbought/oversold.
Quiet (Regime 4): BB width < 0.8x avg, ATR < 0.9x avg.
Other (Regime 5): Default for unclear conditions.
Indicators: ADX (14), BB width (20), ATR (14, 50-bar SMA), HTF RSI (14, daily default), HTF MACD (12,26,9).
Why It’s Brilliant:
Regime detection adapts signals to market context, boosting win rates in trending or volatile conditions.
HTF RSI/MACD add a big-picture filter, rare in basic scripts.
Visualized via gradient background (green for Trending, orange for Range, red for Volatile, gray for Quiet, navy for Other).
2. Multi-Factor Signal Scoring
Entries are driven by a weighted scoring system that combines candlestick patterns, trend, momentum, and volume for robust signals.
Candlestick Patterns:
Bullish: Engulfing (0.5), hammer (0.4 in Range, 0.2 else), morning star (0.2), piercing (0.2), double bottom (0.3 in Volatile, 0.15 else). Must be near support (low ≤ 1.01x 20-bar low) with volume spike (>1.5x 20-bar avg).
Bearish: Engulfing (0.5), shooting star (0.4 in Range, 0.2 else), evening star (0.2), dark cloud (0.2), double top (0.3 in Volatile, 0.15 else). Must be near resistance (high ≥ 0.99x 20-bar high) with volume spike.
Logic: Patterns are weighted higher in specific regimes (e.g., hammer in Range, double bottom in Volatile).
Additional Factors:
Trend: Fast EMA (20) > slow EMA (50) + 0.5x ATR (trend_bull, +0.2); opposite for trend_bear.
RSI: RSI (14) < 30 (rsi_bull, +0.15); > 70 (rsi_bear, +0.15).
MACD: MACD line > signal (12,26,9, macd_bull, +0.15); opposite for macd_bear.
Volume: ATR > 1.2x 50-bar avg (vol_expansion, +0.1).
HTF Confirmation: HTF RSI < 70 and MACD bullish (htf_bull_confirm, +0.2); RSI > 30 and MACD bearish (htf_bear_confirm, +0.2).
Scoring:
bull_score = sum of bullish factors; bear_score = sum of bearish. Entry requires score ≥ 1.0.
Example: Bullish engulfing (0.5) + trend_bull (0.2) + rsi_bull (0.15) + htf_bull_confirm (0.2) = 1.05, triggers long.
Why It’s Brilliant:
Multi-factor scoring ensures signals are confirmed by multiple market dynamics, reducing false positives.
Regime-specific weights make patterns more relevant (e.g., hammers shine in Range markets).
HTF confirmation aligns with the big picture, a quant edge over simplistic scripts.
3. Futures-Tuned Risk Management
The risk system is built for futures, calculating position sizes based on $ risk and offering flexible stops/TPs.
Position Sizing:
Logic: Risk per trade (default: $300) ÷ (stop distance in points * point value) = contracts, capped at max_contracts (default: 5). Point value = tick value (e.g., $12.5 for ES) * ticks per point (4) * contract multiplier (1 for ES, 0.1 for MES).
Example: $300 risk, 8-point stop, ES ($50/point) → 0.75 contracts, rounded to 1.
Impact: Precise sizing prevents over-leverage, critical for micro contracts like MES.
Stops and Take-Profits:
Fixed: Default stop = 8 points, TP = 16 points (2:1 reward/risk).
ATR-Based: Stop = 1.5x ATR (default), TP = 3x ATR, enabled via use_atr_for_stops.
Logic: Stops set at swing low/high ± stop distance; TPs at 2x stop distance from entry.
Impact: ATR stops adapt to volatility, while fixed stops suit stable markets.
Trailing Stops:
Logic: Activates at 50% of TP distance. Trails at close ± 1.5x ATR (atr_multiplier). Longs: max(trail_stop_long, close - ATR * 1.5); shorts: min(trail_stop_short, close + ATR * 1.5).
Impact: Locks in profits during trends, a game-changer in volatile sessions.
Circuit Breaker:
Logic: Pauses trading if daily drawdown > 5% (daily_drawdown = (max_equity - equity) / max_equity).
Impact: Protects capital during black swan events (e.g., April 27, 2025 ES slippage).
Why It’s Brilliant:
Futures-specific inputs (tick value, multiplier) make it plug-and-play for ES/MES.
Trailing stops and circuit breaker add pro-level safety, rare in off-the-shelf scripts.
Flexible stops (ATR or fixed) suit different trading styles.
4. Trade Entry and Exit Logic
Entries and exits are precise, driven by bull_score/bear_score and protected by drawdown checks.
Entry Conditions:
Long: bull_score ≥ 1.0, no position (position_size <= 0), drawdown < 5% (not pause_trading). Calculates contracts, sets stop at swing low - stop points, TP at 2x stop distance.
Short: bear_score ≥ 1.0, position_size >= 0, drawdown < 5%. Stop at swing high + stop points, TP at 2x stop distance.
Logic: Tracks entry_regime for PNL arrays. Closes opposite positions before entering.
Exit Conditions:
Stop-Loss/Take-Profit: Hits stop or TP (strategy.exit).
Trailing Stop: Activates at 50% TP, trails by ATR * 1.5.
Emergency Exit: Closes if price breaches stop (close < long_stop_price or close > short_stop_price).
Reset: Clears stop/TP prices when flat (position_size = 0).
Why It’s Brilliant:
Score-based entries ensure multi-factor confirmation, filtering out weak signals.
Trailing stops maximize profits in trends, unlike static exits in basic scripts.
Emergency exits add an extra safety layer, critical for futures volatility.
5. DAFE Visuals
The visuals are pure DAFE magic, blending function with cyberpunk flair to make signals intuitive and charts stunning.
Shimmering Bollinger Band Fill:
Display: BB basis (20, white), upper/lower (green/red, 45% transparent). Fill pulses (30–50 alpha) by regime, with glow (60–95 alpha) near bands (close ≥ 0.995x upper or ≤ 1.005x lower).
Purpose: Highlights volatility and key levels with a futuristic glow.
Visuals make complex regimes and signals instantly clear, even for newbies.
Pulsing effects and regime-specific colors add a DAFE signature, setting it apart from generic scripts.
BB glow emphasizes tradeable levels, enhancing decision-making.
Chart Background (Regime Heatmap):
Green — Trending Market: Strong, sustained price movement in one direction. The market is in a trend phase—momentum follows through.
Orange — Range-Bound: Market is consolidating or moving sideways, with no clear up/down trend. Great for mean reversion setups.
Red — Volatile Regime: High volatility, heightened risk, and larger/faster price swings—trade with caution.
Gray — Quiet/Low Volatility: Market is calm and inactive, with small moves—often poor conditions for most strategies.
Navy — Other/Neutral: Regime is uncertain or mixed; signals may be less reliable.
Bollinger Bands Glow (Dynamic Fill):
Neon Red Glow — Warning!: Price is near or breaking above the upper band; momentum is overstretched, watch for overbought conditions or reversals.
Bright Green Glow — Opportunity!: Price is near or breaking below the lower band; market could be oversold, prime for bounce or reversal.
Trend Green Fill — Trending Regime: Fills between bands with green when the market is trending, showing clear momentum.
Gold/Yellow Fill — Range Regime: Fills with gold/aqua in range conditions, showing the market is sideways/oscillating.
Magenta/Red Fill — Volatility Spike: Fills with vivid magenta/red during highly volatile regimes.
Blue Fill — Neutral/Quiet: A soft blue glow for other or uncertain market states.
Moving Averages:
Display: Blue fast EMA (20), red slow EMA (50), 2px.
Purpose: Shows trend direction, with trend_dir requiring ATR-scaled spread.
Dynamic SL/TP Lines:
Display: Pulsing colors (red SL, green TP for Trending; yellow/orange for Range, etc.), 3px, with pulse_alpha for shimmer.
Purpose: Tracks stops/TPs in real-time, color-coded by regime.
6. Dual Dashboards
Two dashboards deliver real-time insights, making the strat a quant command center.
Bottom-Left Metrics Dashboard (2x13):
Metrics: Mode (Active/Paused), trend (Bullish/Bearish/Neutral), ATR, ATR avg, volume spike (YES/NO), RSI (value + Oversold/Overbought/Neutral), HTF RSI, HTF trend, last signal (Buy/Sell/None), regime, bull score.
Display: Black (29% transparent), purple title, color-coded (green for bullish, red for bearish).
Purpose: Consolidates market context and signal strength.
Top-Right Position Dashboard (2x7):
Metrics: Regime, position side (Long/Short/None), position PNL ($), SL, TP, daily PNL ($).
Display: Black (29% transparent), purple title, color-coded (lime for Long, red for Short).
Purpose: Tracks live trades and profitability.
Why It’s Brilliant:
Dual dashboards cover market context and trade status, a rare feature.
Color-coding and concise metrics guide beginners (e.g., green “Buy” = go).
Real-time PNL and SL/TP visibility empower disciplined trading.
7. Performance Tracking
Logic: Arrays (regime_pnl_long/short, regime_win/loss_long/short) track PNL and win/loss by regime (1–5). Updated on trade close (barstate.isconfirmed).
Purpose: Prepares for future adaptive thresholds (e.g., adjust bull_score min based on regime performance).
Why It’s Brilliant: Lays the groundwork for self-optimizing logic, a quant edge over static scripts.
Key Features
Regime-Adaptive: Optimizes signals for Trending, Range, Volatile, Quiet markets.
Futures-Optimized: Precise sizing for ES/MES with tick-based risk inputs.
Multi-Factor Signals: Candlestick patterns, RSI, MACD, and HTF confirmation for robust entries.
Dynamic Exits: ATR/fixed stops, 2:1 TPs, and trailing stops maximize profits.
Safe and Smart: 5% drawdown breaker and emergency exits protect capital.
DAFE Visuals: Shimmering BB fill, pulsing SL/TP, and dual dashboards.
Backtest-Ready: Fixed qty and tick calc for accurate historical testing.
How to Use
Add to Chart: Load on a 5min ES/MES chart in TradingView.
Configure Inputs: Set instrument (ES/MES), tick value ($12.5/$1.25), multiplier (1/0.1), risk ($300 default). Enable ATR stops for volatility.
Monitor Dashboards: Bottom-left for regime/signals, top-right for position/PNL.
Backtest: Run in strategy tester to compare regimes.
Live Trade: Connect to Tradovate or similar. Watch for slippage (e.g., April 27, 2025 ES issues).
Replay Test: Try April 28, 2025 NQ drop to see regime shifts and stops.
Disclaimer
Trading futures involves significant risk of loss and is not suitable for all investors. Past performance does not guarantee future results. Backtest results may differ from live trading due to slippage, fees, or market conditions. Use this strategy at your own risk, and consult a financial advisor before trading. Dskyz (DAFE) Trading Systems is not responsible for any losses incurred.
Backtesting:
Frame: 2023-09-20 - 2025-04-29
Slippage: 3
Fee Typical Range (per side, per contract)
CME Exchange $1.14 – $1.20
Clearing $0.10 – $0.30
NFA Regulatory $0.02
Firm/Broker Commis. $0.25 – $0.80 (retail prop)
TOTAL $1.60 – $2.30 per side
Round Turn: (enter+exit) = $3.20 – $4.60 per contract
Final Notes
The Dskyz (DAFE) Adaptive Regime - Quant Machine Pro is more than a strategy—it’s a revolution. Crafted with DAFE’s signature precision, it rises above generic scripts with adaptive regimes, quant-grade signals, and visuals that make trading a thrill. Whether you’re scalping MES or swinging ES, this system empowers you to navigate markets with confidence and style. Join the DAFE crew, light up your charts, and let’s dominate the futures game!
(This publishing will most likely be taken down do to some miscellaneous rule about properly displaying charting symbols, or whatever. Once I've identified what part of the publishing they want to pick on, I'll adjust and repost.)
Use it with discipline. Use it with clarity. Trade smarter.
**I will continue to release incredible strategies and indicators until I turn this into a brand or until someone offers me a contract.
Created by Dskyz, powered by DAFE Trading Systems. Trade smart, trade bold.

ULTIMATE Price Action Oscillator with Volume-Based S/R - MehtaULTIMATE Price Action Oscillator with Volume-Based S/R (UPO-PRO-VOL)
Key Features:
Smart Oscillator: Combines price action momentum with customizable smoothing.
Volume-Confirmed S/R: Identifies high-confidence Support/Resistance levels when price crosses above-average volume.
Real-Time Tracking: Displays S/R levels with timestamps (IST) in a clean table.
Visual Alerts: Dashed lines + labels mark key levels for easy spotting.
⚠️ STRONG DISCLAIMER
❌ This indicator is for educational purposes only.
❌ Not financial advice. Trading involves risk—always conduct your own analysis.
❌ No guarantee of accuracy. Past performance ≠ future results.
❌ Adjust settings carefully. Test in a demo account first.
❌ Volume thresholds may vary by asset. Customize Volume Threshold Multiplier as needed.
📝 How to Use:
S/R Signals: Green "S" = Support (oscillator crosses up with high volume). Red "R" = Resistance (oscillator crosses down with high volume).
Table: Tracks latest S/R prices and formation time (IST).
Tweak Settings: Adjust Oscillator Length, Smoothing, and Volume Threshold for your trading style.
Tip: Combine with trend analysis for higher-probability trades!
Script Settings (Default):
Oscillator Length: 5 (Can be adjusted upto a maximum value of 200)
Smoothing: 3
S/R Lookback: 100 bars
Volume Threshold: 1.5x avg volume
