Wyckoff Trend Tracking Coins StrengthWyckoff Trend Tracking Coins Strength 该指标集合12个主流数字货币的市场力量强度比较,为您在每日筛选出有单边趋势行情的币种,哪里有大行情就去哪里交易,让您有限的交易资金获得超高效率的赚钱机会。放弃捂币屯币,这才是赚钱最快的交易策略。
"track" için komut dosyalarını ara

Wyckoff Trend Tracking Trend MatrixWyckoff Trend Tracking Trend Matrix 该指标为您提前揭示趋势规模大小,让您在复杂的交易中稳操胜券。


Wyckoff Trend Tracking Future PriceWyckoff Trend Tracking Future Price 未来趋势和价格目标策略。该策略基于傅立叶和吉姆赫斯特周期理论,通过遗传基因非线性测序算法检测市场历史价格循环中全周期因子,拟合周期因子并投射到未来的时间框架,以获得趋势的方向和未来的价格目标。该策略能很好的辅助交易者跟踪趋势、交易未来并获得可预见性收益。
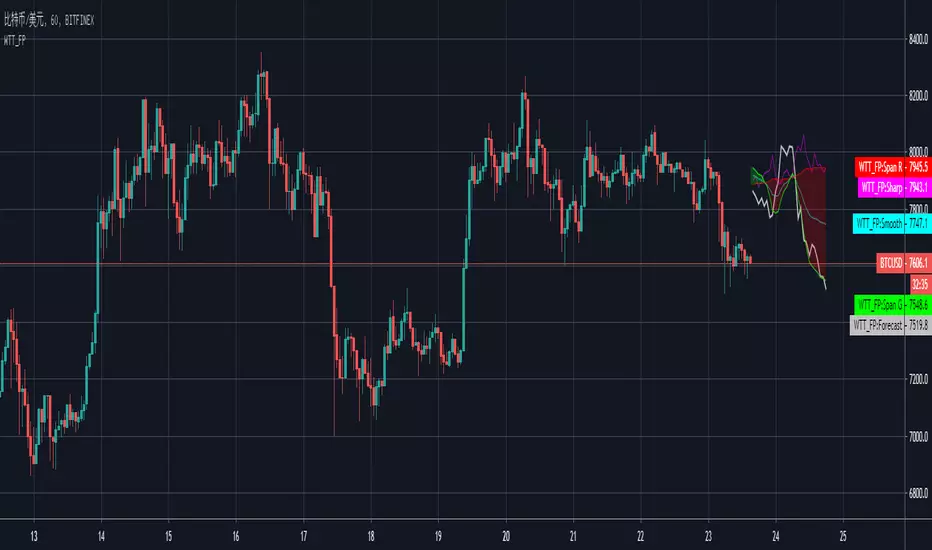
Wyckoff Trend Tracking Future CycleWyckoff Trend Tracking Future Cycle 未来趋势和价格目标策略。该策略建基于傅立叶和吉姆赫斯特周期理论,通过遗传基因非线性测序算法检测市场历史价格循环中全周期因子,拟合周期因子并投射到未来的时间框架,以获得趋势的方向和未来的价格目标。该策略能很好的辅助交易者跟踪趋势、交易未来并获得可预见性收益。

Wyckoff Trend Tracking MACDWyckoff Trend Tracking MACD 该指标为您重新定义了传统的MACD指标,改进了传统的滞后与延时,给您非常好的信号辅助作用。

Wyckoff Trend Tracking Buffett's SecretWyckoff Trend Tracking Buffett's Secret 该指标拟合数十种策略综合计算趋势整体水平。红色或黄色区域代表趋势到达顶部,暗绿色或亮绿色代表趋势到达底部,助力交易员逃顶抓底一网打尽。该指标可等用于贪婪恐惧指数使用。如巴菲特名言:“当别人贪婪的时候你要恐惧,当别人恐惧的时候你要贪婪”。故取名为:“巴菲特的秘密”。

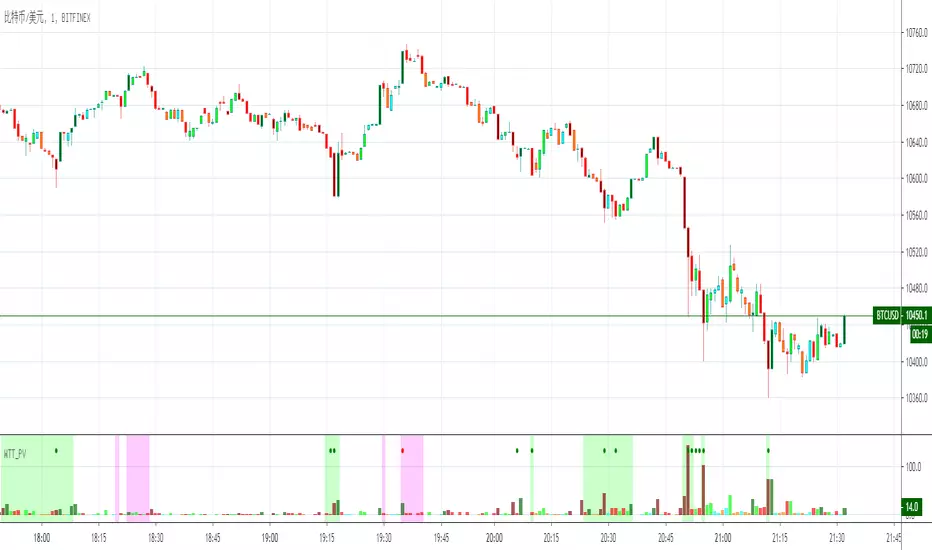
Wyckoff Trend Tracking Key VolumeWyckoff Trend Tracking Key Volume 该指标为您在纷繁复杂的众多交易量中一眼就能识别出关键量,过滤掉其它交易量杂波。

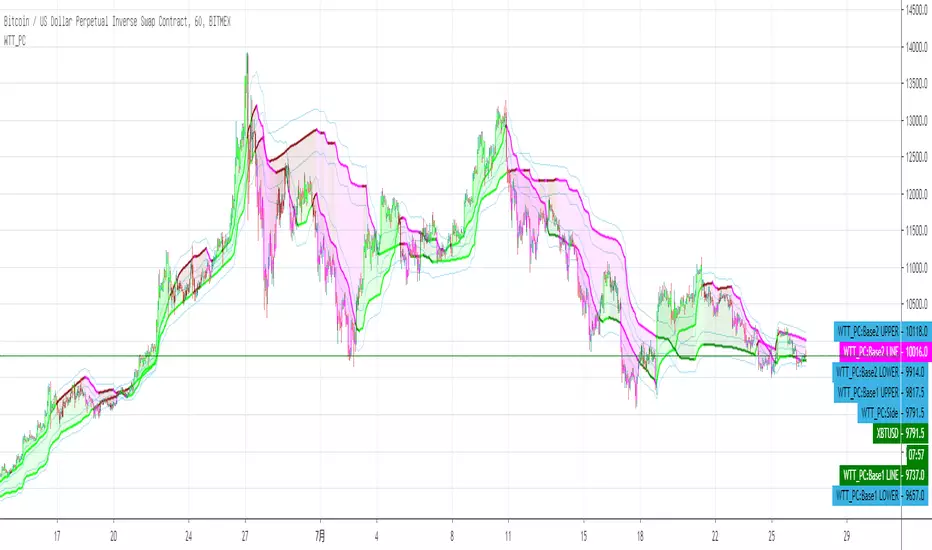
Wyckoff Trend Tracking Price CyclesWyckoff Trend Tracking Price Cycles 该指标为您揭示市场动态运行的区间及价格运行的方位,让市场变化了然于胸。

Wyckoff Trend Tracking Market NavigatorWyckoff Trend Tracking Market Navigator 该指标可以向您导航大的市场波动,但在震荡市场行情中需要您的慧眼并设好止损。

Wyckoff Trend Tracking Market NevigatorWyckoff Trend Tracking Market Nevigator 该指标可以向您导航大的市场波动,但在震荡市场行情中需要您的慧眼并设好止损。

Wyckoff Trend Tracking Volatility StopWyckoff Trend Tracking Volatility Stop该指标为您提示小时、日与周的周期波动幅度,在无序的震荡中提示未来可能的波动幅度。

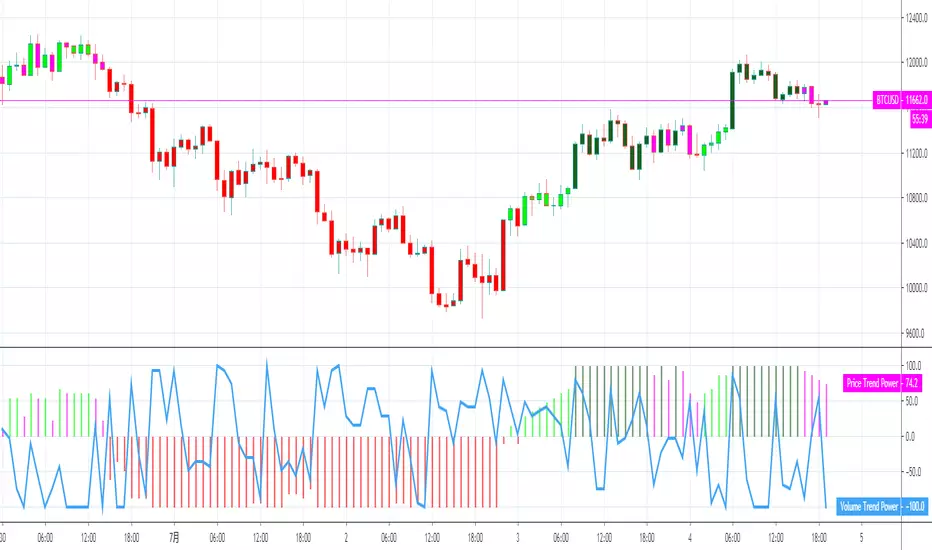
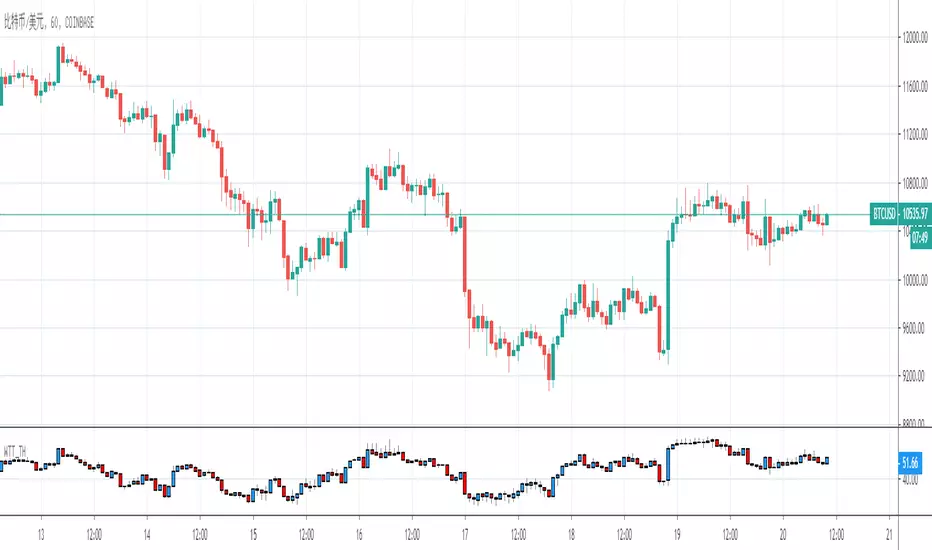
Wyckoff Trend Tracking Trend OscillatorWyckoff Trend Tracking Trend Oscillator该指标在纷繁复杂的市场震荡中为您清晰的提示趋势的强弱。

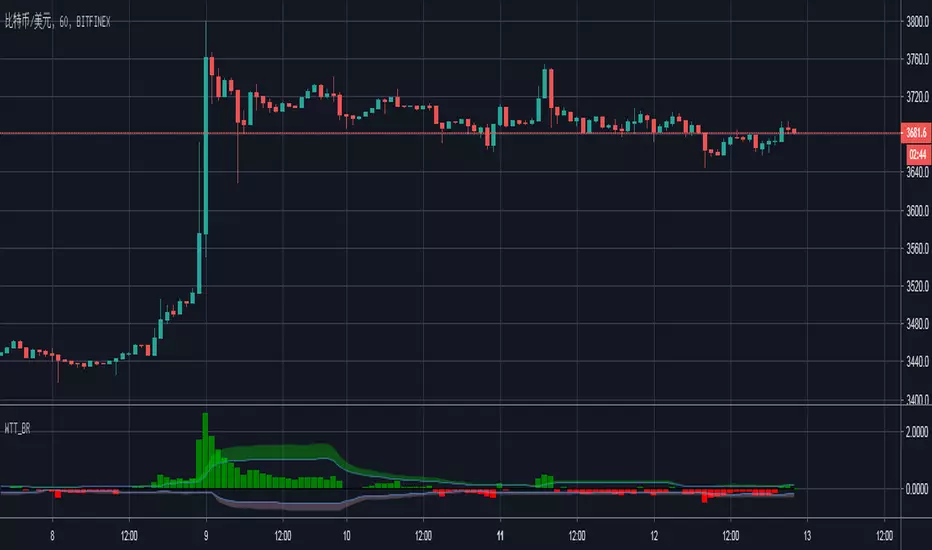
Wyckoff Trend Tracking Breakout ReversalWyckoff Trend Tracking Breakout Reversal该指标为您提示市场多空双方的突破与反转。
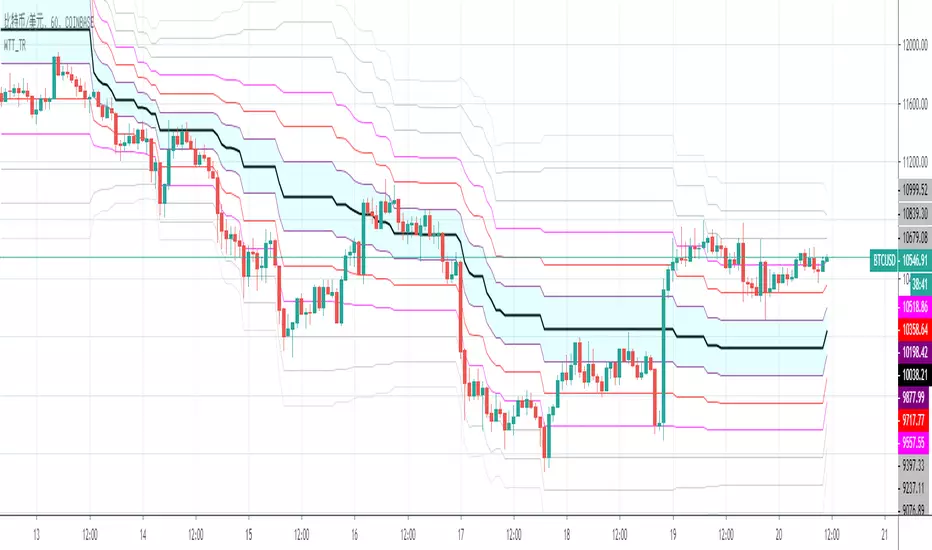
Wyckoff Trend Tracking Trend & Stop X4Wyckoff Trend Tracking Trend & Stop X4该指标为您提供多方位的趋势分析,让您在变化万千的市场中辨清方向。

Wyckoff Trend Tracking Conversion Point X8Wyckoff Trend Tracking Conversion Point X8威科夫趋势跟踪交易指标工具为非结构化的市场增添了结构,它有一套明确一致的交易规则,让您专注于具有最高回报和最低风险的交易机会,无论您是刚刚开始从事交易还是经验丰富的交易员,它对您来说绝对是一种竞争优势。

Wyckoff Volume, Wyckoff Trend Tracking Trading SystemWyckoff Volume by Wyckoff Trend Tracking Trading System

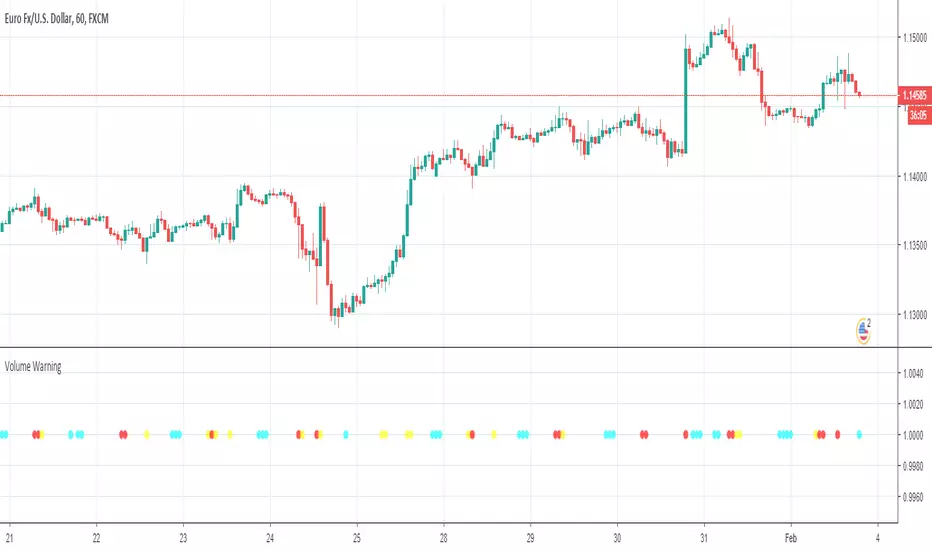
Volume Warning, Wyckoff Trend Tracking Trading SystemVolume Warning by Wyckoff Trend Tracking Trading System