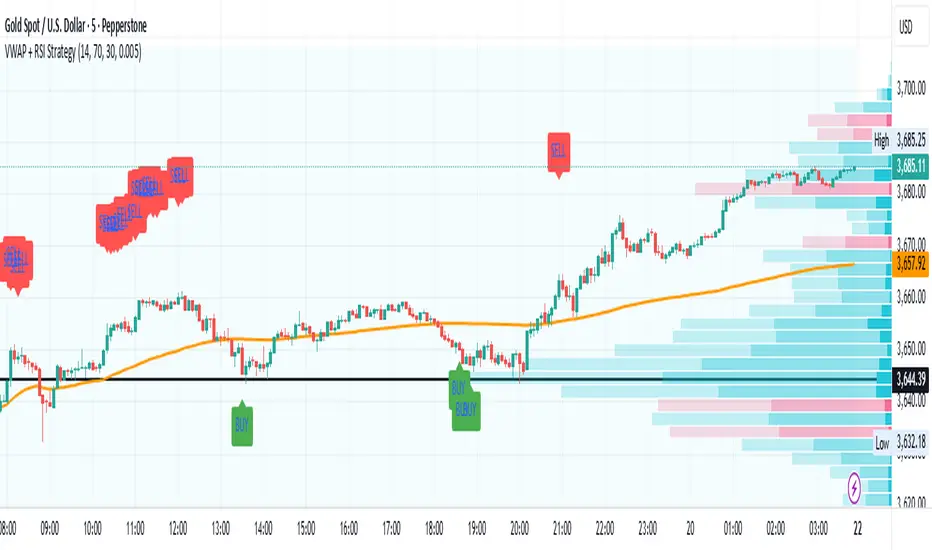
VWAP + RSI Strategytesting this method, based on RSI combine with Vwap
there is a buy and sell alert, if you like pls comment it, this is a simple method that can surely adapt to any assets,
"vwap" için komut dosyalarını ara
VWAP With EMAFor those who want the classic Volume Weighted Average Price and Ema on the same overlay.
This script utilizes the same protocols as the VWAP and EMA you currently use. Just frees up an indicator space.
KEEP UP TO DATE
Are you a college student or graduate?
Join College Town Trade discord for helpful community specializing in trading stocks, options, and crypto.
Our staff consists of a group of college students with 10+ years of combined experience. Collectively we have profited and made well above an average yearly salary while being in college. The community aspect is everything and the team always listens and appreciates feedback. We all earn and learn together. There are free trials in place in order for you to see what it’s all about. These are in place so we can gain your trust and show transparency!
I look forward to seeing you in the community
advBtBjDhk

VWAP With EMA Overlay (Adjustable Anchor)For those who want the classic Volume Weighted Average Price and Ema on the same overlay.
This script utilizes the same protocols as the VWAP and EMA you currently use. Just frees up an indicator space.
KEEP UP TO DATE
Are you a college student or graduate?
Join College Town Trade discord for helpful community specializing in trading stocks, options, and crypto.
Our staff consists of a group of college students with 10+ years of combined experience. Collectively we have profited and made well above an average yearly salary while being in college. The community aspect is everything and the team always listens and appreciates feedback. We all earn and learn together. There are free trials in place in order for you to see what it’s all about. These are in place so we can gain your trust and show transparency!
I look forward to seeing you in the community
advBtBjDhk

TBM VWAP Bands Style SetupA stripped down and modified version of the 'VWAP with Standard Deviation Bands' indicator by pmk07. The bands have been modified and styled to match those used on the Tradovate platform by Matt from the Trades By Matt youtube channel so if you would like to know how they should be used go to his youtube channel and watch his strategy explanation video.
Session/Day VWAP & Std Dev Bands/VWAP and Standard Deviation Bands for intra-day & Day sessions
/Intra-day sessions be default are set to crypto
- Asia session
- London Session
- New York Session
- Close Session
Day broken up into sessions as a 24 hour period consists of different market participants and therefore different behaviour.

MTF Anchored VWAPAnchored VWAP is all the rage, but it's just one indicator. That being said, it seems like people want to add more than one at a time so why eat into your indicator cap. This script will allow you to configure 5 AVWAPS at a time.
This will not plot if the time chosen is not in market hour s. Note: market hours may be outside of YOUR timeframe. i.e, the market may open at 7:30 your time, but it will not plot until you change it to 9:30.
Enjoy

Hello VWAP "Beta"This is my 1st indicator, and my attention is to plot the VWAP "Volume-weighted average price" using the SMA "Simple Moving Average" over time... IE over the last 50,100,200 bars and just the VWAP... All of them in just one line... I have made it when I have been using the BTC/US chart, but it should work for stocks/forex or any other chart that you want to use...
I am not completely sure about this indicator and I do want to add more to this, that is how come I am posting to the community to show what I have done and people can use it and if they are open to it give me feedback or tips to make it better...
Happy trading...

VWAP-ATRstopAdapted ATR-stop with only VWAP and ATR.
Didnt test it, feel free to use it the way you want. You can turn off the bar color function and change any config.

Multi-Timeframe VWAP V2 MODQuick and dirty mod of this script in order to fit my needs.
Added one custom session
More user friendly (Enable/disable through inputs menu)

Multi MTF VWAPMulti inteveral MTF VWAP
-----------------------------------------------------------------------------------
If you find it useful please consider a tip/donation : BTC - 3BMEXEDyWJ58eXUEALYPadbn1wwWKmf6sA

VWAP ColorfulWhen the current VWAP is rising, the indicator will be green. When it is falling, it will be red. Good trades!

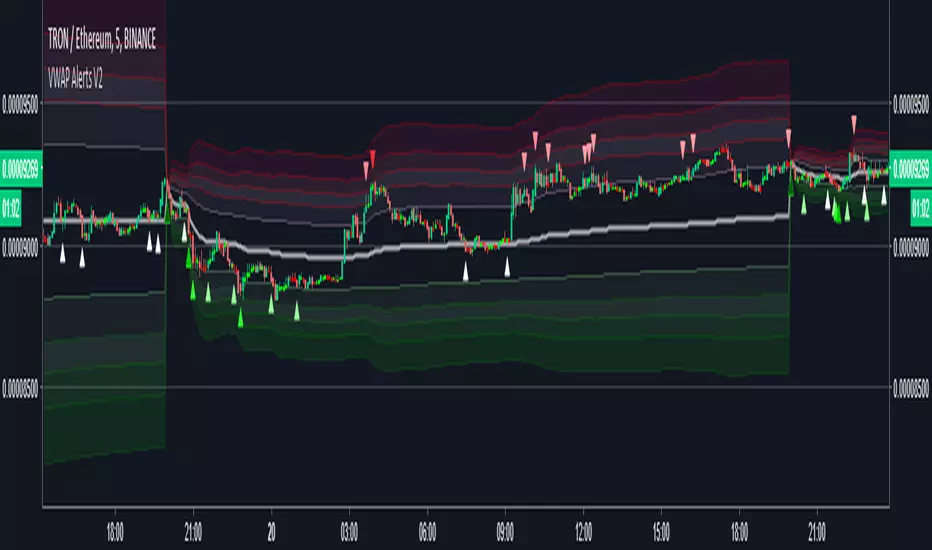
VWAP Alerts V2Alerts added to "VWAP Stdev Bands v2" by SandroTurriate
Changes
-Adjusted trigger conditions for higher signal sensitivity
-Color change on bands and signals for better readability and ease on the eyes
-Alerts added for up to 4 deviations up and down
-Re-enabled deviations 4 and 5
-Re-enabled previous close
BTC World Price: Multi-Exchange VWAPBTC World Price: Multi-Exchange VWAP
__________________________
WHAT IT DOES
What you see above are not Bitmex candles, but this indicator's.
Bitcoin is listed on multiple exchanges. Many people have called for a single global index that would quote BTC price and volume across all exchanges: this script is such a virtual aggregate (formerly: Multi-Listed , Volume-Weighted Average Price ).
It will, independently for each tick, for any time-frame:
- Quote the price (O, H, L, C) and volume from Bitfinex (USD), Binance (USDT), bitFlyer (Yen), Bithumb (S. Korean Won), Coinbase (USD), Kraken (EUR) and even Bitmex (USD Contracts).
- Weight each price with the corresponding volume of the exchange.
- Quote the FOREX conversion rate in USD for each currency (USDJPY etc.)
- Finally return global average price (candles) in USD.
- Additionally provide (H+L)/2 etc. values.
No more "on Coinbase this" or "on Bitstamp that", you've now got a global overview!
See CoinMarketCap: Markets for reference. I've included alternative exchanges in the comments at the top of the script.
__________________________
HOW TO USE IT
Basically just add it to your chart and use the indicator's candles instead of the chart's main ticker.
By default, BTC World Price will display candles only, but you can also display OHLC & averages (in whichever style you want).
You may indeed want to hide the main symbol (top-left corner, click the 'eye' button next to its name), or switch it to something else than candles/bars (e.g. line).
Make sure "Scale Price Chart Only" is disabled if you want to use the auto-zoom feature. (if other indicators are messing your zoom, you can try to select "Line with Breaks" or "Area with Breaks" to allow these to overflow from the main window)
By clicking the triangle next to the indicator's name, you can select "Visual Order" (e.g "Bring to Front").
You can select regular Candles or Heikin-Ashi in Options.
In the Format > Inputs tab, you can select which exchanges to quote. By default, all of them are enabled.
The script also exposes the following typical values to the backend, which you can use as Price Source for other indicators: (e.g. MA, RSI, in their "Format > Input" tab)
Open Price (grey)
High Price (green)
Low Price (red)
Close Price (white)
(H + L)/2 (light blue)
(H + L + C)/3 (blue)
(O + H + L + C)/4 (purple)
They are all hidden by default (by means of maximum transparency).
In the Format > Style tab, you can change their color, transparency and style (line, area, etc), as well as uncheck Candles and Wicks to hide these.
If you are using "Indicator Last Value" and want to clear the clutter from all these values, simply uncheck them in Style. They will still be available as Price Source for other indicators.
You can also choose to scale it to the left, right (default) or "screen" (no scaling).
Once you're satisfied with your Style, you may click "Default"> "Save as default" in the botton-left. Everytime you load the indicator, it will look the same. ("Reset Settings" will reset to the script's defaults)
__________________________
Please leave feedback below in comments or pm me directly for bugs and suggestions.

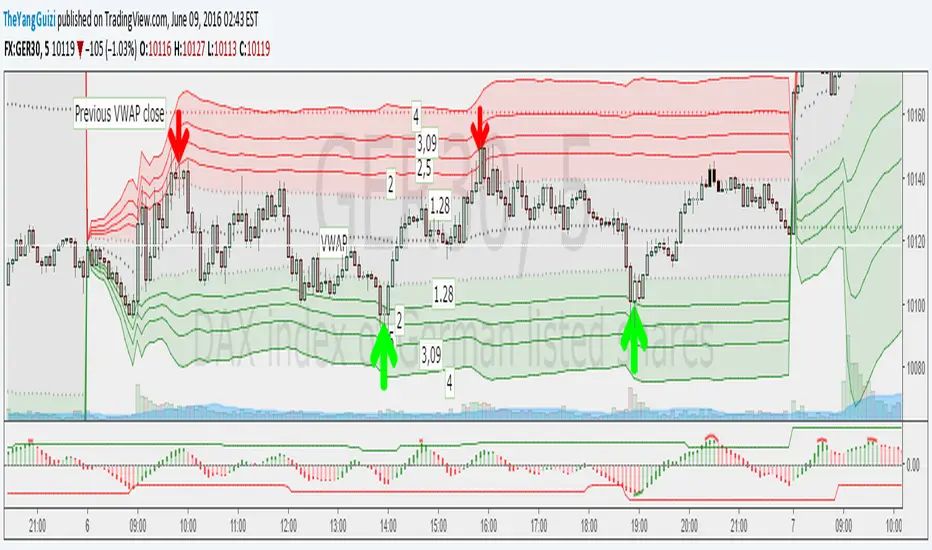
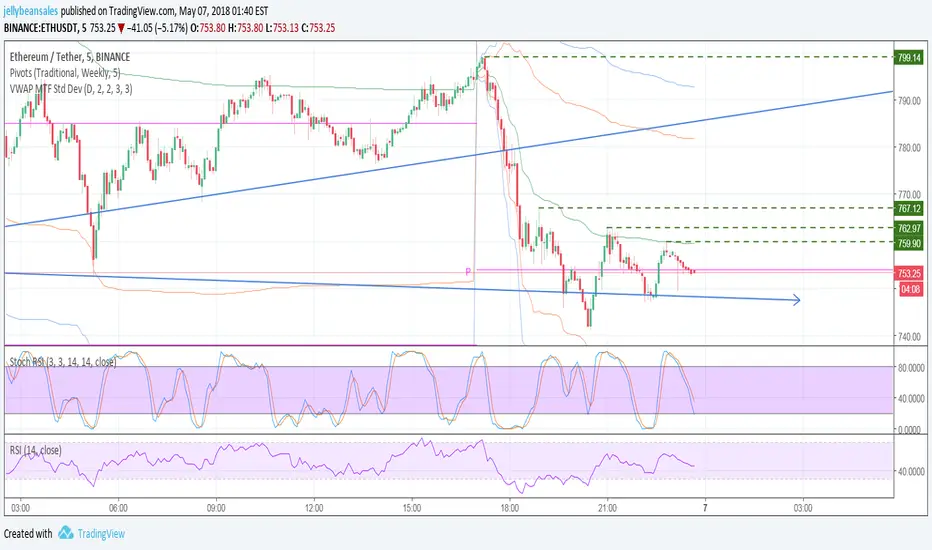
VWAP Stdev Bands v2 Modoriginal script by /u/SandroTurriate/ - I just made some small changes.
Vwap + standard deviation bands. Good for reversal trading among other things. Used intraday.
Very useful when price is ranging.
I added the option to fill the spaces between the deviation lines with color and also the option to add some extra bands. That's about it. Color/length/style etc is customizable.
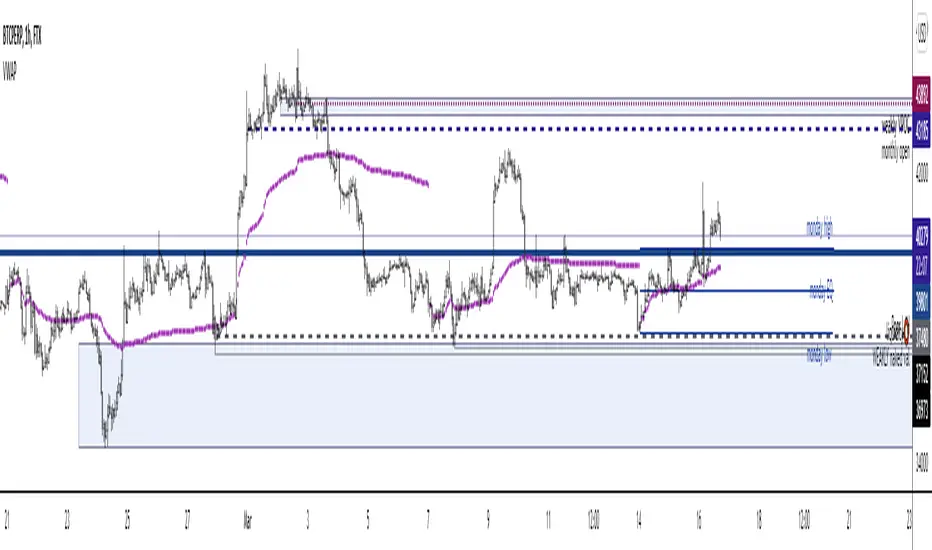


VWAP MTF Std DevIncludes 2 sets of standard deviations, with a variable time frame for Daily (D) Weekly (W) and Monthly(M)
Multi-Timeframe VWAP Master ProThe Multi-Timeframe VWAP Suite is a comprehensive and highly customizable indicator designed for traders who rely on Volume-Weighted Average Price (VWAP) across multiple timeframes and periods. This tool provides a complete suite of VWAP calculations, including daily, weekly, monthly, quarterly, yearly, and custom VWAPs, allowing traders to analyze price action and volume trends with precision. Whether you're a day trader, swing trader, or long-term investor, this indicator offers unparalleled flexibility and depth for your trading strategy.
Multi-Timeframe VWAPs:
Daily, Weekly, Monthly, Quarterly, and Yearly VWAPs: Track VWAP across various timeframes to identify key support and resistance levels.
Customizable Timeframes: Use the SMA timeframe input to adjust the period for moving averages and other calculations.
Previous Period VWAPs:
Previous Daily, Weekly, Monthly, and Quarterly VWAPs: Analyze historical VWAP levels to understand past price behavior and identify potential reversal zones.
Previous Year Quarterly VWAPs: Compare current price action to VWAP levels from specific quarters of the previous year.
Custom VWAPs:
Custom Start Date and Timeframe: Define your own VWAP periods by specifying a start date and timeframe, allowing for tailored analysis.
Dynamic Custom VWAP Calculation: Automatically calculates VWAP based on your custom inputs, ensuring flexibility for unique trading strategies.
Seasonal and Yearly VWAPs:
April, July, and October VWAPs: Analyze seasonal trends by tracking VWAP levels for specific months.
Yearly VWAP: Get a broader perspective on long-term price trends with the yearly VWAP.
SMA Integration:
SMA Overlay: Combine VWAP analysis with a Simple Moving Average (SMA) for additional confirmation of trends and reversals.
Customizable SMA Length and Timeframe: Adjust the SMA settings to match your trading style and preferences.
User-Friendly Customization:
Toggle Visibility and Labels: Easily enable or disable the display of specific VWAPs and their labels to keep your chart clean and focused.
Color Customization: Each VWAP line and label is color-coded for easy identification and can be customized to suit your preferences.
Dynamic Labeling:
Automatic Labels: Labels are dynamically placed on the last bar, providing clear and concise information about each VWAP level.
Customizable Label Text: Labels include detailed information, such as the timeframe or custom period, for quick reference.
Flexible Timeframe Detection:
Automatic Timeframe Detection: The indicator automatically detects new days, weeks, months, and quarters, ensuring accurate VWAP calculations.
Support for Intraday and Higher Timeframes: Works seamlessly on all chart timeframes, from 1-minute to monthly charts.
Previous Year Quarterly VWAPs:
Q1, Q2, Q3, Q4 VWAPs: Compare current price action to VWAP levels from specific quarters of the previous year.
User-Selectable Year: Choose the year for which you want to calculate previous quarterly VWAPs.
Persistent Monthly VWAPs:
Option to Persist Monthly VWAPs Year-Round: Keep monthly VWAP levels visible even after the month ends for ongoing analysis.
Comprehensive Analysis: Combines multiple VWAP timeframes and periods into a single tool, eliminating the need for multiple indicators.
Customizable and Flexible: Tailor the indicator to your specific trading strategy with customizable timeframes, periods, and settings.
Enhanced Decision-Making: Gain deeper insights into price action and volume trends across different timeframes, helping you make more informed trading decisions.
Clean and Organized Charts: Toggle visibility and labels to keep your chart clutter-free while still accessing all the information you need.
Ideal For:
Day Traders: Use daily and intraday VWAPs to identify intraday support and resistance levels.
Swing Traders: Analyze weekly and monthly VWAPs to spot medium-term trends and reversals.
Long-Term Investors: Leverage quarterly and yearly VWAPs to understand long-term price behavior and key levels.
Seasonal Traders: Track April, July, and October VWAPs to capitalize on seasonal trends.
The Multi-Timeframe VWAP Suite is a powerful and versatile tool for traders of all styles and timeframes. With its comprehensive suite of VWAP calculations, customizable settings, and user-friendly design, it provides everything you need to analyze price action and volume trends with precision and confidence. Whether you're looking to fine-tune your intraday strategy or gain a broader perspective on long-term trends, this indicator has you covered.

Swing Anchored Vwap [BigBeluga]🔵 OVERVIEW
Swing Anchored Vwap tracks the market’s directional behavior by anchoring VWAPs (Volume Weighted Average Price) to dynamically detected swing highs and lows. It visually distinguishes the active swing VWAP from historical ones—offering traders a clean view of trend-aligned value zones with clearly marked inflection points.
🔵 CONCEPTS
Swing Anchored VWAPs: VWAPs are initiated from recent swing highs during downtrends and swing lows during uptrends.
Trend Detection: The indicator identifies trend shifts based on the breaking of recent highest or lowest price value.
Trend-Based Coloring:
• Green VWAPs: are drawn from swing lows in uptrends.
• Blue VWAPs: are drawn from swing highs in downtrends.
Sensitivity Control: The Length input defines how far back the script looks to determine swing points—shorter lengths make it more reactive.
🔵 FEATURES
Real-time VWAP projection from the current swing point, updated live.
Historical VWAP traces with slightly faded color to emphasize the current active one.
Swing markers automatically placed on highs/lows where VWAPs are anchored.
Label with price value at the end of each active VWAP line for clarity.
Adaptive color scheme that visually separates uptrend/downtrend zones.
🔵 HOW TO USE
Use active VWAP as a dynamic support/resistance guide during ongoing trends.
Observe breaks or rejections around these VWAPs for trend continuation or reversal clues .
Compare current price position relative to swing VWAPs to assess trend maturity and extension .
Combine with volume analysis or structure to increase conviction at swing points.
🔵 CONCLUSION
Swing Anchored Vwap merges the logic of anchored VWAPs and swing structure into a responsive visual tool. It helps traders stay aligned with the current trend while offering historical context via previous value anchors—ideal for intraday to swing-level analysis.

Volume Spikes + Daily VWAP SD BandsVolume Spikes + Daily VWAP SD Bands
This indicator combines volume spike detection to help traders identify potential absorption zones with daily VWAP and standard deviation bands , key price levels, continuation opportunities, and possible institutional bias.
Features:
Volume Spike Detection
Highlights candles with unusually high volume relative to a configurable SMA.
Optional filters:
Local highs/lows only (Only Use Valid Highs & Lows)
Candle shapes: Hammer / Shooter only
Candle color match: bullish spikes on green, bearish on red
Plots small circles above/below bars for bullish and bearish volume spikes.
Alerts available for both bullish and bearish spikes.
Interpretation: Volume spikes at local highs/lows can indicate absorption, where one side absorbs aggressive buying/selling pressure.
Daily VWAP
Calculates volume-weighted average price (VWAP) for the current day.
Optionally shows previous day’s VWAP for reference.
Plot lines are customizable with optional circles on lines for visual clarity.
Labels on the last bar show exact VWAP values.
Institutional Bias Insight: Price above both current and previous VWAPs may indicate bullish positioning; price below both VWAPs may indicate bearish positioning. Many professional traders consider this a clue to institutional bias, but it’s not guaranteed. Always confirm with volume, delta, or orderflow analysis.
Standard Deviation Bands
Optional x1 and x2 SD bands around the daily VWAP.
Visual fill between bands shows price volatility zones.
Can be used to identify potential support/resistance or absorption zones.
Use Case: Price bounces off first SD band may indicate continuation signals, especially when volume spikes occur at those levels.
Customizable Visuals
Colors for bullish and bearish volume spikes
VWAP and SD band colors and thickness
Optional circles and filled bands for better readability
Alerts
Bullish / Bearish Volume Spikes
Supports TradingView alert system for automated notifications
Advanced Use Cases:
Combine with Cumulative Delta or Orderflow tools to confirm true absorption zones.
Identify high-volume rejection candles signaling possible trend continuation.
Use VWAP positioning relative to price to assess potential institutional bias, keeping in mind it is probabilistic, not guaranteed.
Visualize intraday VWAP levels and volatility with SD bands for better trade timing.
Settings: Fully customizable, including volume multiplier, SMA length, session filter, candle shape, color options, and VWAP/SD display preferences.

Session VWAPS [QuantVue]The Session VWAPS indicator is a designed for traders to enhance their trading analysis by incorporating Volume Weighted Average Price (VWAP) anchored to custom-defined trading sessions.
This indicator automatically plots VWAPs at three critical points of a user defined session:
🔹session start
🔹session high
🔹session low
Additionally, it provides the option to display the VWAPs from previous sessions, offering a look at potential areas of support and resistance.
Anchored VWAP, or Anchored Volume-Weighted Average Price, is a technical analysis tool used to determine the average price of a stock weighted by volume, starting from a specific point in time chosen by the analyst.
Unlike traditional VWAP, which starts at the beginning of the trading session, the anchored VWAP allows traders to select any point on the chart, such as a significant event, price low, high, or a breakout, to begin the calculation.
VWAP incorporates price and volume in a weighted average and can be used to identify areas of support and resistance on the chart.
Indicator Features:
Custom Session Definition:
Users can define their own trading sessions by specifying start and end times, allowing for tailored analysis according to individual trading strategies or market hours.
Anchored VWAP at Three Key Points:
🔹Session Start VWAP: This VWAP is anchored at the start of the defined session.
🔹Session High VWAP: Anchored at the highest price point within the session.
🔹Session Low VWAP: Anchored at the lowest price point within the session.
Previous Session VWAPs:
The indicator can display VWAPs from the previous session, allowing traders to spot potential areas of support and resistance.
Give this indicator a BOOST and COMMENT your thoughts below!
We hope you enjoy.
Cheers!

Central Pivot Ranges (CPR) & 3 x VWAP & BarcolorsThis Script Combines daily, weekly and monthly VWAP (Volume Weighted Average Price) with a intraday, daily, weekly and monthly CPR (Central Pivot Range) - which is considered by some traders as the bread and butter of the market for a reason. A combination of Multiple CPRs and VWAPs from different timeframes can provide you with interesting confluences that can give you more confidence in performing your trades.
CPR Features:
- The option to look at current or developing CPRs.
- A resolution selector for all 4 CPRs
- Options to hide and show Tops, Bottoms and Pivots separately
- Various Styling options
- Alerts
VWAP Features:
- 3 x preset VWAPs set to daily, weekly and monthly
- VWAP Lines from the daily O&C or H&L
- Previous VWAP for S/R
- Line Styling options
General Features:
- Barcolors by pivots crossed or daily, weekly and monthly VWAP.
- Barcolors by daily VWAP additionally contain an O and C check instead of just taking the price above or below the VWAP into consideration.
