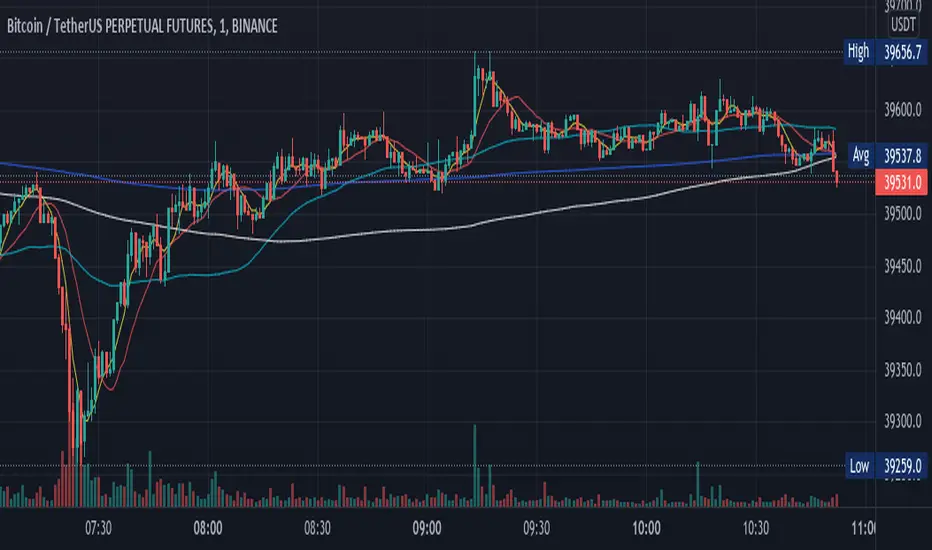
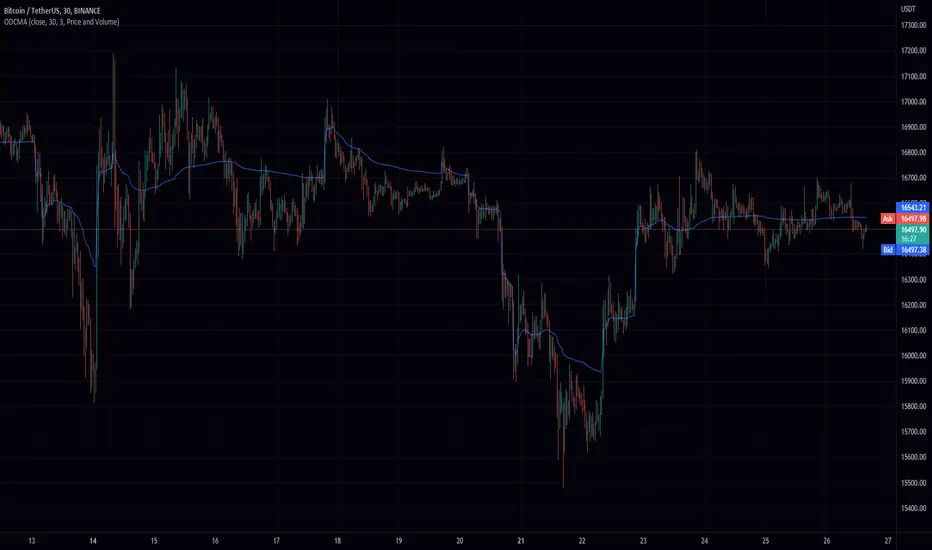
Outlier Detecting Cumulative Moving Average (ODCMA)This is a simple moving average with a rolling length that resets whenever there is an outlier in the data. I have also included volume weighting.
The length represents the lookback period for the outlier detection and the "Outlier Detection" is the deviation level to trigger the detection. You can select from: price detection, volume detection, price or volume detection, price and volume detection.
I hope you can find this script useful. Its like a session weighted moving average but instead it retriggers the cumulative sum whenever there is an outlier.
Komut dosyalarını "vwap" için ara
Index OverlayNote: use this indicator only with New York Timezone + you need to understand ICT concepts already, this indicator simplifies the chart work.
Also, in this script I added some open-source scripts from creators here on tradingview, but I forgot to annotate their names...
If you recognize your script, please text me and I'll add your credits.
features
- displays Midnight and Sunday open lines
- day separation (from midnight)
- FVGs
- VWAP (calculated from midnight open)
- daily labels
- TDH & TDL (liquidity)
- trading time window (from 9:30 to 12:00 ny time)
HOW TO USE
Combined with daily bias, the idea is to wait for 9:30 to open, and then wait for a liquidation of TDH (plotted in blue) or TDL (in red).
Once it happens, you can look for ICT buy / sell model, ideally in the 5m TF.

Rolling MACDThis indicator displays a Rolling Moving Average Convergence Divergence . Contrary to MACD indicators which use a fix time segment, RMACD calculates using a moving window defined by a time period (not a simple number of bars), so it shows better results.
This indicator is inspired by and use the Close & Inventory Bar Retracement Price Line to create an MACD in different timeframes.
█ CONCEPTS
If you are not already familiar with MACD, so look at Help Center will get you started www.tradingview.com
The typical MACD, short for moving average convergence/divergence, is a trading indicator used in technical analysis of stock prices, created by Gerald Appel in the late 1970s. It is designed to reveal changes in the strength, direction, momentum, and duration of a trend in a stock's price.
The MACD indicator(or "oscillator") is a collection of three time series calculated from historical price data, most often the closing price. These three series are: the MACD series proper, the "signal" or "average" series, and the "divergence" series which is the difference between the two. The MACD series is the difference between a "fast" (short period) exponential moving average (EMA), and a "slow" (longer period) EMA of the price series. The average series is an EMA of the MACD series itself.
Because RMACD uses a moving window, it does not exhibit the jumpiness of MACD plots. You can see the more jagged MACD on the chart above. I think both can be useful to traders; up to you to decide which flavor works for you.
█ HOW TO USE IT
Load the indicator on an active chart (see the Help Center if you don't know how).
Time period
By default, the script uses an auto-stepping mechanism to adjust the time period of its moving window to the chart's timeframe. The following table shows chart timeframes and the corresponding time period used by the script. When the chart's timeframe is less than or equal to the timeframe in the first column, the second column's time period is used to calculate RMACD:
Chart Time
timeframe period
1min 🠆 1H
5min 🠆 4H
1H 🠆 1D
4H 🠆 3D
12H 🠆 1W
1D 🠆 1M
1W 🠆 3M
You can use the script's inputs to specify a fixed time period, which you can express in any combination of days, hours and minutes.
By default, the time period currently used is displayed in the lower-right corner of the chart. The script's inputs allow you to hide the display or change its size and location.
Minimum Window Size
This input field determines the minimum number of values to keep in the moving window, even if these values are outside the prescribed time period. This mitigates situations where a large time gap between two bars would cause the time window to be empty, which can occur in non-24x7 markets where large time gaps may separate contiguous chart bars, namely across holidays or trading sessions. For example, if you were using a 1D time period and there is a two-day gap between two bars, then no chart bars would fit in the moving window after the gap. The default value is 10 bars.
//
This indicator should make trading easier and improve analysis. Nothing is worse than indicators that give confusingly different signals.
I hope you enjoy my new ideas
best regards
Chervolino

QQE Student's T-Distribution Bollinger Bands Oscillator Credit to all of the developers on this project (aka all of the places I got the code from lol) @eylwithsteph @storma @Fractured @lejmer @AlexGrover @Montyjus @Jiehonglim @StephXAGs @peacefulLizard50262 @gorx1 @above-c-level
This script utilizes @above-c-level 's Student's T-Distribution script to give us a great estimation of volatility. I took this idea and apply it to the QQE filter! That being said I have added a boat load of features as to make this script as useful to as many people as possible. This is the Osc version
Included averages: 'TMA', 'ALMA', 'EMA', 'DEMA', 'TEMA', 'WMA', 'VWMA', 'SMA', 'SMMA', 'HMA', 'LSMA', 'JMA', 'VAMA', 'FRAMA', 'ZLEMA', 'KAMA', 'IDWMA', 'FLMSA', 'PEMA', 'HCF', 'TIF', 'MF', 'ARMA', 'DAF', 'WRMA', 'RMA', 'RAF', 'A2RMA', 'QQE 1', 'QQE 2','Centroid',"Harmonic Mean","Geometric Mean","Quadratic Mean","Median","Trimean","Midhinge","Midrange","VWAP"
Included Features: Smoothing, Additional Moving Average, Log Space, Mean Momentum via Derivative, Normalization, Convergence DIvergence, Candle View
Use this just like macd/rsi but instead this directly reflects the band version! It also shows really valid support and resistance. Use this in combination with the band version for more power.

QQE Student's T-Distribution Bollinger BandsCredit to all of the developers on this project (aka all of the places I got the code from lol) @eylwithsteph @storma @Fractured @lejmer @AlexGrover @Montyjus @Jiehonglim @StephXAGs @peacefulLizard50262 @gorx1 @above-c-level
This script utilizes @above-c-level 's Student's T-Distribution script to give us a great estimation of volatility. I took this idea and apply it to the QQE filter! That being said I have added a boat load of features as to make this script as useful to as many people as possible.
Included averages: 'TMA', 'ALMA', 'EMA', 'DEMA', 'TEMA', 'WMA', 'VWMA', 'SMA', 'SMMA', 'HMA', 'LSMA', 'JMA', 'VAMA', 'FRAMA', 'ZLEMA', 'KAMA', 'IDWMA', 'FLMSA', 'PEMA', 'HCF', 'TIF', 'MF', 'ARMA', 'DAF', 'WRMA', 'RMA', 'RAF', 'A2RMA', 'QQE 1', 'QQE 2','Centroid',"Harmonic Mean","Geometric Mean","Quadratic Mean","Median","Trimean","Midhinge","Midrange","VWAP"
Included Features: Smoothing, Additional Moving Average, Log Space, Mean Momentum via Derivative
Use this just like BB but instead (as long as you are on qqe) you get real prices that are stable! It also shows really valid support and resistance. Use this in combination with the osc version for more power.
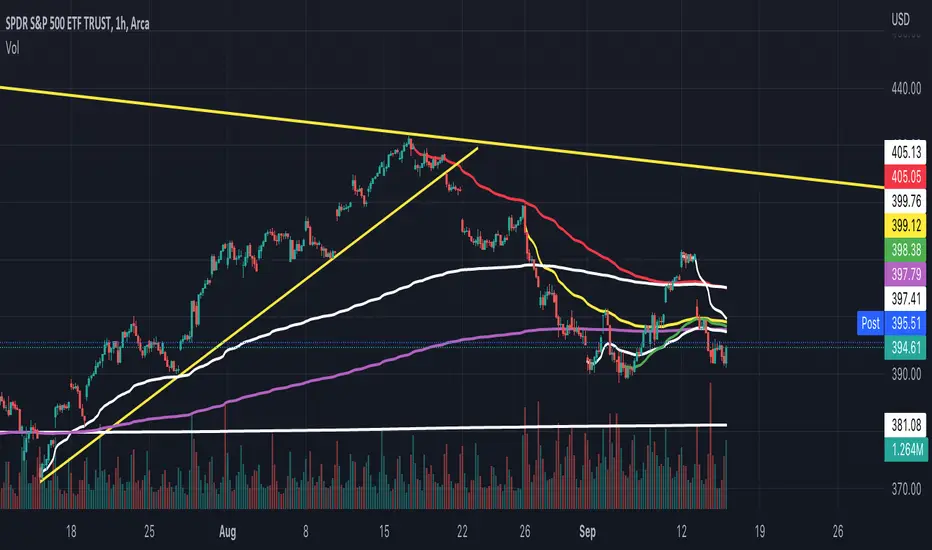
Attrition Scalper v2.0Green/Red Arrowed Buy/Sell signals are just simple buy sell signals based on SuperTrend, VWAP, Bollinger, Linear Regression
Purple Arrowed Buy/Sell Signals happen when the price/candle cross over or under the yellow outer lines (4.236 fib lines) It's extremely rare and hard for price to stay above these lines therefore we can usually and comfortably buy/sell it, a key information here though when price pumps or dumps super fast and hard to the point of crossing these borders, the trend might also be extremely strong and continous so even if the price temporarily goes back inside the borders as the lines expand over time price can continue riding or crossing these lines back again and continue the uptrend/downtrend, therefore crossing these outer borders doesn't necessarilly and always mean a reversal is due.
When analyzing the instrument you're trading the important factors for support/resistance areas are usually the outer lines like i said previously it's super hard for price to be outside these and will almost always get back inside quickly. The Middle thicker green/red line which is Variable Index Dynamic Average should also be a nice pivot line for major support and resistance . All the other lines are also important dynamic support/resistance lines.
Their Importance Order
1- Outer Yellow Line (4.236 Fibs)
2- Thicker Middle Green/Red Line (VIDYA)
3- Thinner Upper/Lower Green/Red Line (VIDYA +3, VIDYA -3)
4- The Rest Of The Lines (Fib Lines)
You can use this indicator in any market condition in any market to determine key support/resistance levels, use it for mean reversion through price expanding to outside of the most outer line therefore being overbought/oversold basically using the purple buy/sell signals or only follow the normal buy/sell signals or use it in confluence with each other. You can also use this indicator in confluence with your own manual technical analysis or other indicators/strategies you are already using and are comfortable with.
A good part is the support/resistance lines from timeframe to timeframe pictures the whole situation quite well, you can use lower timeframe to find your entry/exit positions and higher timeframe to find your key support/resistance points, they all should be somewhat in confluence from timeframe to timeframe anyways. My recommendation would be to look at 1HR, 4HR and 1D charts for swing trading and 5-15 Min for quick scalping/day trading
You should still probably at least take a look to higher timeframes so that you don't get burned when you realize there is a huge resistance line at price XXXXX on the 4 hour chart but you're expecting it to go above it on the 5 minute chart, it can go above it temporarily but we analyze everything on a closing basis so it most likely won't close above it. Again don't take a position or FOMO when price breaks a support/resistance line, we're looking for a CLOSE above/below them and a retest to see if S/R flip happened would even be better.
Sometimes the most outer line won't be the 4.236 (Yellow) lines as when it gets quite volatile the Thinner Upper/Lower Green/Red Lines (VIDYA +3, VIDYA-3) might cross them to be the most outer line, in this case i have observed that the trend is extremely strong this time price almost always doesn't go above or below the VIDYA line but can stay outside of the Yellow 4.236 Fib line for an extended amount of time (price will still get back inside the channel relatively quickly, just not as fast as the normal condition)
With Proper Risk Management and Discipline this indicator can be of great use to you as it's surprisingly successful especially at mean reversion and pointing out the support/resistance lines, they are so much more successful than your average MA/EMA lines.

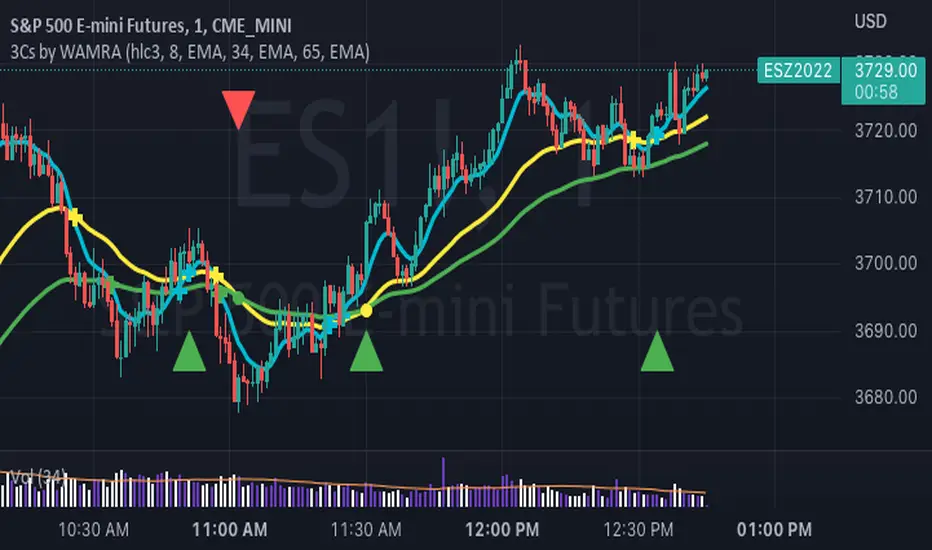
3 Series Cross Indicator with Alerts - by WAMRAThis Indicator allows users to add any 3 combinations of moving averages (SMA, EMA, RMA, RSI, Stochastic RSI, WMA, VWAP ) with granular alert conditions.
Users can alert when all series are in climbing or declining mode.

Visible Range High Low [vnhilton]Inspired by TradingView's "Chart VWAP". Thank you PineCoder for the "VisibleChart" library.
This indicator plots labels for the highest high & lowest low for the visible bars on the chart. TradingView does by default have an indicator similar to this, however it plots labels on the y-axis & cannot be customized.

Trend EMAHello Everyone. This is a new indicator which helps you to follow the trend & find out the support and resistance in Intraday. Time frame is best for this indicator is 5mins. You can also use Vwap which you get in this indicator. This is an Indicator which I'm using to manage my trades.
N.B. I don't insist you to use this. I'm not RESPONSIBLE for your profit and loss after using this indicator.

CosmoSetContains widely use indicators
This contains below indicators
RSI
WMA
SMA
EMA
Colored Vwap
Super Trend
All the above indicators are customizable.

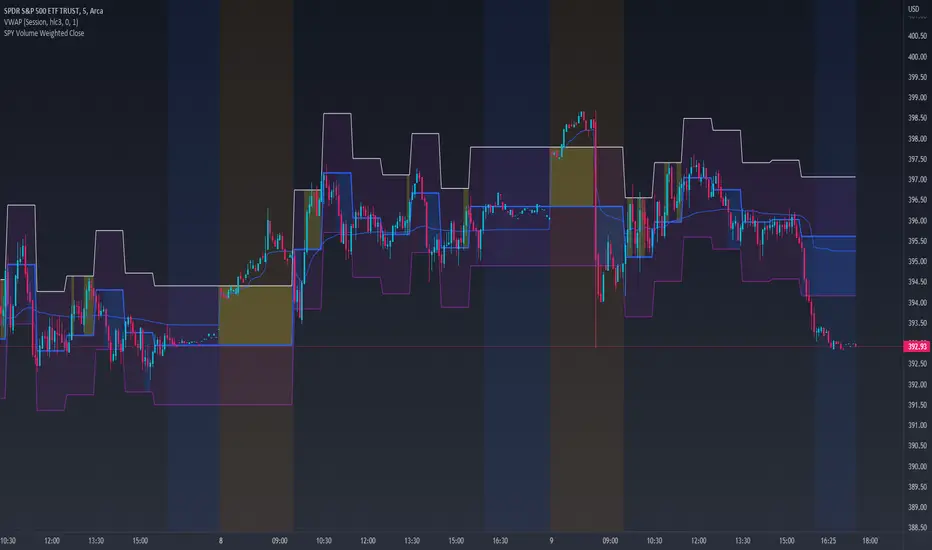
SPY Volume Weighted CloseHey everyone!
Deciding to make this indicator public and open access.
This is a volume weighted close indicator for SPY. It is a statistics based indicator.
How it works:
It uses volume data mixed with some price action data to prospectively predict where SPY's price will close within a 30 minute interval.
As such, its different from other indicators in the sense that its not reactive, it proactive and actively predicts the price that SPY will see within the next 30 minutes and where SPY will most likely close at.
It has 3 bands. The main centre band (blue, but colour can be changed) is the most likely price that SPY will close at within the next 30 minutes.
The Upper Level Confidence and Lower Level Confidence bands are the expected range that the analysis thinks SPY will remain confined in based on current volume and price action.
How to Use it:
I personally use this in place of VWAP, but the applications are infinite. Take a look at the chart below:
Applications:
This is specifically programmed for SPY but I have used it with other stocks such as QQQ, UPRO and DIA. However, using it with those stocks, the upper and lower confidence bands are not helpful. But YMMV with other stocks. This is specifically designed for SPY.
Let me know your questions and thoughts!
Thanks for reading and checking this out!
Caleb's Supply and Demand ZonesThis script takes predetermined levels and plots them as supply and demand zones. These zones are automatically colored as supply or demand based on price action. Additionally, two EMAs and a VWAP are included to help make intraday trading decisions. This script is written to intuitively deduce between SPY, SPX, ES, US500, QQQ, and NQ to plot the zones in their proper corresponding price levels.

Point of Control V2 The genesis of this project was to create a POC library that would be available to deliver volume profile information via pine to other scripts of indicators and strategies.
This is a republish of an invite only script to open access
This is the indicator version of the library function.
A few points of significance:
- Allows the choice of reset of the study period, day/week or bars. This is simple enough to expand to other conditions
- Bar count resets starting from the beginning of the data set (bar index =0) vs bars back from the end of the data set
- A 'period' in this context is the time between resets - the start of the POC (eg. start of Day or Week) until it resets (for example at the beginning of a next day or week)
- Automates the determination of the increment level rather than the user specifying ticks or price brackets
- Does not allow for setting the # of rows and then calculating the implied price increment levels
- When a period is complete it is often useful to look back at the POCs of historical periods, or extend them forward.
- This script will find the historical POCs around the current price and display them rather than extend all the historical POC lines to the right
- This script also looks across all the period POCs and identifies the master POC or what I call the Grand POC, and also the next 3 runner up POCs
This indicator is also available as a library.
BINANCE:BTCUSDT NSE:NIFTY OANDA:XAUUSD NASDAQ:AAPL TVC:USOIL

Month/Month Percentage % Change, Historical; Seasonal TendencyTable of monthly % changes in Average Price over the last 10 years (or the 10 yrs prior to input year).
Useful for gauging seasonal tendencies of an asset; backtesting monthly volatility and bullish/bearish tendency.
~~User Inputs~~
Choose measure of average: sma(close), sma(ohlc4), vwap(close), vwma(close).
Show last 10yrs, with 10yr average % change, or to just show single year.
Chose input year; with the indicator auto calculating the prior 10 years.
Choose color for labels and size for labels; choose +Ve value color and -Ve value color.
Set 'Daily bars in month': 21 for Forex/Commodities/Indices; 30 for Crypto.
Set precision: decimal places
~~notes~~
-designed for use on Daily timeframe (tradingview is buggy on monthly timeframe calculations, and less precise on weekly timeframe calculations).
-where Current month of year has not occurred yet, will print 9yr average.
-calculates the average change of displayed month compared to the previous month: i.e. Jan22 value represents whole of Jan22 compared to whole of Dec21.
-table displays on the chart over the input year; so for ES, with 2010 selected; shows values from 2001-2010, displaying across 2010-2011 on the chart.
-plots on seperate right hand side scale, so can be shrunk and dragged vertically.
-thanks to @gabx11 for the suggestion which inspired me to write this

.srb suite pin-upThe essential suite Indicator
that are well integrated to ensure visibility of essential items for trading.
it is very cumbersome to put symbol in the Tradingview chart and combine essential individual indicators one by one.
Moreover even with such a combination, the chart is messy and visibility is not good.
This is because each indicator is not designed with the others in mind.
This suite was developed as a composite-solution to that situation, and will make you happy.
--> This is steamlined pin-up version of .srb suite.
--> A minimal set of indicators for comparing different symbols.
--> This is well-balanced alternative next version of previous .b pin-up symbol
BTC-agg. Volume
4 BTC-spot & 4 BTC-PERP volume aggregated.
It might helps you don't miss out on important volume flows.
Weighted to spot trading volume when using PERP+spot volume .
If enabled, BTC-agg.Vol automatically applied when selecting BTC-pair.
--> This is used in calculations involving volumes, such as VWAP .
Moving Average
1 x JMA trend ribbon ; Accurately follow short-term trend changes.
2 x EMA ribbon ; zone , not the line.
MA extension line ; It provide high visibility to recognize the direction of the MA.
SPECIAL TOOLS
BB regular (Dev. 2.0, 2.5)
BB Extented (Dev. 2.5, 3.0, 3.5)
SPECIAL TOOLS - Ultra Volume Marking
x2 x4 greater than regular average volume, it will help you can take the reversal
It does not directly indicate volume, but ultra-volume marking is enough for compare.
---------------------------------------------------------------------------------------------------------------------------------------
if you have any questions freely contact to me by message on tradingview
but please understand that responses may be quite late.
Special thanks to all of contributors of community.
The script may be freely distributed under the MIT license.

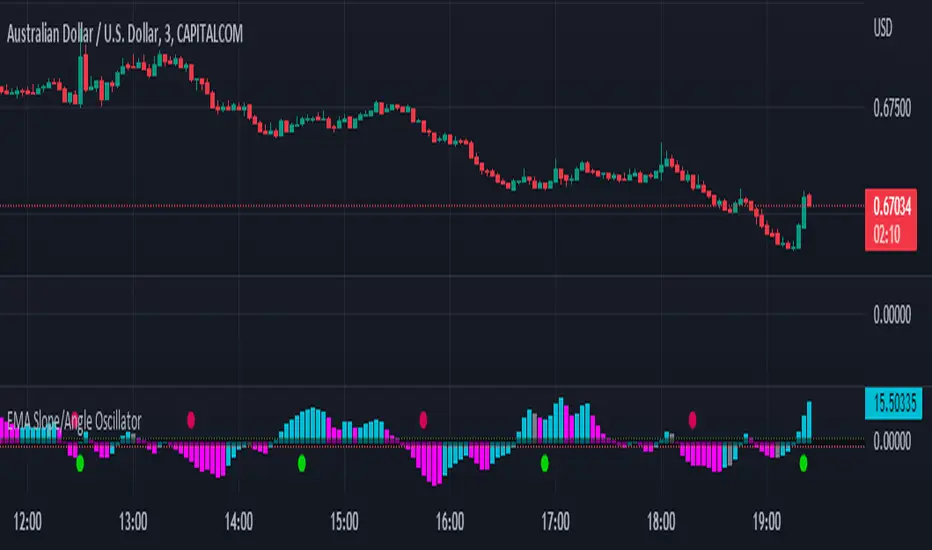
EMA Slope/Angle OscillatorEMA Slope/Angle Oscillator, Multiple Moving Average Oscillator, Multiple type
Moving Averages HMA,EMA,WMA,SMA, VWMA,VWAP provided.
The angle is calculated between the Slow MA and Fast MA and the difference between the angle is plotted as Histogram.
Additionally Buy Sell Signals are plotted as green and red Dots.
its very easy to judge the movement of price Bearish/Bullish.
Bearish if price below 0 line
Bullish if price above 0 line
Zero crossing is Moving Average Crossover.
Trend Filter is provided to filter opposite signals.
Angle Threshold is provided to filter low angle false signals.
Dead zone is plotted around Zero Line. Trades can be taken after Threshold angle or Dead zone is crossed
Its interesting to see how different Moving Averages move along with price Action.
Tabajara 5PSetup Tabajara
Based on several Tabajara setups published in TradingView, idealized by André Machado, aka "WallSt Ogro".
Bar colors follow trend and change based on the main direction.
Including indicators:
Simple Moving Averages and Exponential Averages
Bollinger Bands
VWAP
HiLo indicator

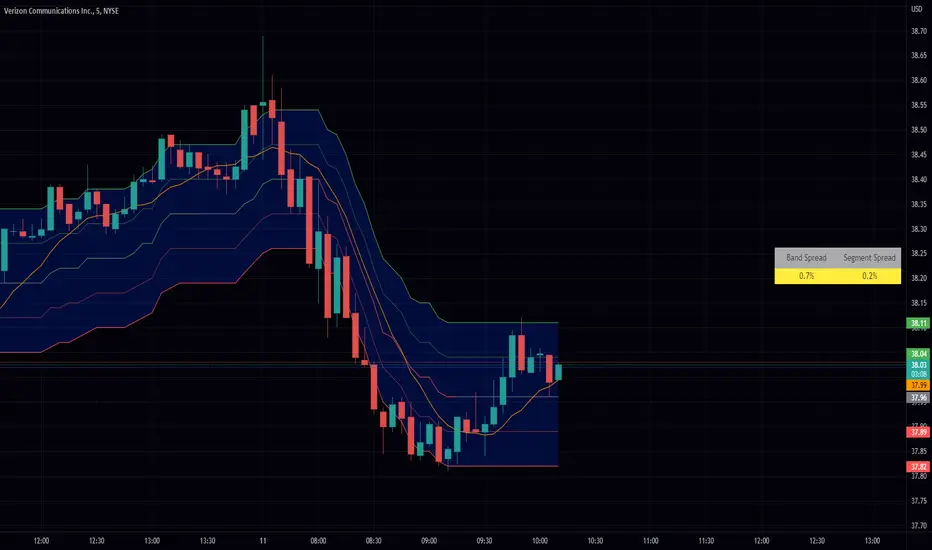
Bollinger Bands + Keltner Channel Refurbished█ Goals
This is an indicator that brings together Bollinger Bands and Keltner's Channels in one thing.
Both are very similar, so I decided to make a merge of the best features I found out there.
Here there is the possibility of choosing one of these two as needed.
In addition, I added the following resources:
1. Pre-Defined intermediate bands with Fibonacci values;
2. Detachment of the bands in which the price was present;
3. Choice of Moving Average:
"Simple", "Exponential", "Regularized Exponential", "Hull", "Arnaud Legoux", "Weighted Moving Average", "Least Squares Moving Average (Linear Regression)", "Volume Weighted Moving Average", "Smoothed Moving Average", "Median", "VWAP");
4. Statistics: bars count within the bands.
█ Concepts
Keltner Channels vs. Bollinger Bands
"These two indicators are quite similar.
Keltner Channels use ATR to calculate the upper and lower bands while Bollinger Bands use standard deviation instead.
The interpretation of the indicators is similar, although since the calculations are different the two indicators may provide slightly different information or trade signals."
(Investopedia)
Bollinger Bands (BB)
"Bollinger Bands (BB) are a widely popular technical analysis instrument created by John Bollinger in the early 1980’s.
Bollinger Bands consist of a band of three lines which are plotted in relation to security prices.
The line in the middle is usually a Simple Moving Average (SMA) set to a period of 20 days (the type of trend line and period can be changed by the trader; however a 20 day moving average is by far the most popular).
The SMA then serves as a base for the Upper and Lower Bands which are used as a way to measure volatility by observing the relationship between the Bands and price.
Typically the Upper and Lower Bands are set to two standard deviations away from the SMA (The Middle Line); however the number of standard deviations can also be adjusted by the trader."
(TradingView)
Keltner Channels (KC)
"The Keltner Channels (KC) indicator is a banded indicator similar to Bollinger Bands and Moving Average Envelopes.
They consist of an Upper Envelope above a Middle Line as well as a Lower Envelope below the Middle Line.
The Middle Line is a moving average of price over a user-defined time period.
Either a simple moving average or an exponential moving average are typically used. The Upper and Lower Envelopes (user defined) are set a range away from the Middle Line.
This can be a multiple of the daily high/low range, or more commonly a multiple of the Average True Range."
(TradingView)
█ Examples
Bollinger Bands with 200 REMA:
Keltner Channel with 200 REMA:
Bollinger Bands with 55 ALMA:
Keltner Channel with 55 ALMA:
Bollinger Bands with 55 Least Squares Moving Average:
█ Thanks
- TradingView (BB, KC, ATR, MA's)
- everget (Regularized Exponential Moving Average)
- TimeFliesBuy ("Triple Bollinger Bands")
- Rashad ("Fibonacci Bollinger Bands")
- Dicargo_Beam ("Is the Bollinger Bands assumption wrong?")

Everything Bitcoin [Kioseff Trading]Hello!
This script retrieves most of the available Bitcoin data published by Quandl; the script utilizes the new request.security_lower_tf() function.
Included statistics,
True price
Volume
Difficulty
My Wallet # Of Users
Average Block Size
api.blockchain size
Median Transaction Confirmation Time
Miners' Revenue
Hash Rate
Cost Per Transaction
Cost % of Transaction Volume
Estimated Transaction Volume USD
Total Output Volume
Number Of Transactions Per Block
# of Unique BTC Addresses
# of BTC Transactions Excluding Popular Addresses
Total Number of Transactions
Daily # of Transactions
Total Transaction Fees USD
Market Cap
Total BTC
Retrieved data can be plotted as line graphs; however, the data is initially split between two tables.
The image above shows how the requested Bitcoin data is displayed.
However, in the user inputs tab, you can modify how the data is displayed.
For instance, you can append the data displayed in the floating statistics box to the stagnant statistics box.
The image above exemplifies the instance.
You can hide any and all data via the user inputs tab.
In addition to data publishing, the script retrieves lower timeframe price/volume/indicator data, to which the values of the requested data are appended to center-right table.
The image above shows the script retrieving one-minute bar data.
Up arrows reflect an increase in the more recent value, relative to the immediately preceding value.
Down arrows reflect a decrease in the more recent value relative to the immediately preceding value.
The ascending minute column reflects the number of minutes/hours (ago) the displayed value occurred.
For instance, 15 minutes means the displayed value occurred 15 minutes prior to the current time (value).
Volume, price, and indicator data can be retrieved on lower timeframe charts ranging from 1 minute to 1440 minutes.
The image above shows retrieved 5-minute volume data.
Several built-in indicators are included, to which lower timeframe values can be retrieved.
The image above shows LTF VWAP data. Also distinguished are increases/decreases for sequential values.
The image above shows a dynamic regression channel. The channel terminates and resets each fiscal quarter. Previous channels remain on the chart.
Lastly, you can plot any of the requested data.
The new request.security_lower_tf() function is immensely advantageous - be sure to try it in your scripts!

Daily Scalping Moving AveragesThis is a technical analysis study based on the most fit leading indicators for short timeframes like EMA and SMA.
At the same time we have daily channel made from the last 2 weeks of ATR values, which will give us the daily top and bottom expected values(with 80%+ confidence)
We have 3 groups of lengths for short length, medium length and a bigger length.
At the same time we combine it with the daily vwap values .
In the end we are going to have a total of 7 indicators telling us the direction.
The way we can use it :
The max ratings that we can have are +7 for long and -7 for short
In general once we have at least 5 indicators(fast and medium ones) giving us a direction, there is a high chance that we can scalp that trend and then we can exit either when we will be at +7 or close to neutral point
At the same time is very important to be aware of the current position inside of the TOP/BOTTOM channel that we have.
For example lets assume we are at 40k on BTC and our top channel is around 41-42k while the bottom is around 38k. In this case the margin that we have for long is much smaller than for short, so we should be prepared to exit once we reach the top values and from there wait and see if there is a huge continuation or a reversal. If the top channel was hit and the market started the rebounce going downwards and the moving averages confirms it, then we have a huge advantage using the top points as a STOP LOSS and continue the short movements, giving us an amazing risk/reward ratio .
If you have any questions let me know !

Moving Averages With Cross AlertsA simple way to add up to 5 moving averages with optional crossover/crossunder alerts.
Available options for Moving Average Type are:
SMA
EMA (default)
HMA
RMA
WMA
VWMA
VWAP
ALMA
By default, 5 moving averages are enabled and set to the following:
MA1 set to 5
MA2 set to 13
MA3 set to 50
MA4 set to 200
MA5 set to 800
Each moving average has the following options:
Enable/Disable
Source (default is close)
Length
Color