Granular Candle-by-Candle VWAPGranular Candle-by-Candle VWAP is a customizable Volume Weighted Average Price (VWAP) indicator designed for TradingView. Unlike traditional VWAP indicators that operate on the chart's primary timeframe, this script enhances precision by incorporating lower timeframe (e.g., 1-minute) data into VWAP calculations. This granular approach provides traders with a more detailed and accurate representation of the average price, accounting for intra-bar price and volume movements. The indicator dynamically adjusts to the chart's current timeframe and offers a range of customization options, including price type selection, visual styling, and alert configurations.
Customizable Features
Users have extensive control over various aspects of the Granular Candle-by-Candle VWAP indicator. Below are the key features that can be customized to align with individual trading preferences:
🎛️ Customizable Features
Users have extensive control over various aspects of the Granular Candle-by-Candle VWAP indicator. Below are the key features that can be customized to align with individual trading preferences:
🔢 Lookback Period
Description: Defines the number of lower timeframe bars used in the VWAP calculation.
Customization:
Input: VWAP Lookback Period (Number of Lower Timeframe Bars)
Default Value: 20 bars
Range: Minimum of 1 bar
Purpose: Allows traders to adjust the sensitivity of the VWAP. A smaller lookback period makes the VWAP more responsive to recent price changes, while a larger period smoothens out fluctuations.
📈 Price Type Selection
Description: Determines which price metric is used in the VWAP calculation.
Customization:
Input: Price Type for VWAP Calculation
Options:
Open: Uses the opening price of each lower timeframe bar.
High: Uses the highest price of each lower timeframe bar.
Low: Uses the lowest price of each lower timeframe bar.
Close: Uses the closing price of each lower timeframe bar.
OHLC/4: Averages the Open, High, Low, and Close prices.
HL/2: Averages the High and Low prices.
Typical Price: (High + Low + Close) / 3
Weighted Close: (High + Low + 2 × Close) / 4
Default Value: Close
Purpose: Offers flexibility in how the average price is calculated, allowing traders to choose the price metric that best fits their analysis style.
🕒 Lower Timeframe Selection
Description: Specifies the lower timeframe from which data is fetched for granular VWAP calculations.
Customization:
Input: Lower Timeframe for Granular Data
Default Value: 1 minute ("1")
Options: Any valid TradingView timeframe (e.g., "1", "3", "5", "15", etc.)
Purpose: Enables traders to select the granularity of data used in the VWAP calculation, enhancing the indicator's precision on higher timeframe charts.
🎨 VWAP Line Customization
Description: Adjusts the visual appearance of the VWAP line based on price position relative to the VWAP.
Customizations:
Color When Price is Above VWAP:
Input: VWAP Color (Price Above)
Default Value: Green
Color When Price is Below VWAP:
Input: VWAP Color (Price Below)
Default Value: Red
Line Thickness:
Input: VWAP Line Thickness
Default Value: 2
Range: Minimum of 1
Line Style:
Input: VWAP Line Style
Options: Solid, Dashed, Dotted
Default Value: Solid
Purpose: Enhances visual clarity, allowing traders to quickly assess price positions relative to the VWAP through color coding and line styling.
🔔 Alerts and Notifications
Description: Provides real-time notifications when the price crosses the VWAP.
Customizations:
Enable/Disable Alerts:
Input: Enable Alerts for Price Crossing VWAP
Default Value: Enabled (true)
Alert Conditions:
Price Crossing Above VWAP:
Trigger: When the closing price crosses from below to above the VWAP.
Alert Message: "Price has crossed above the Granular VWAP."
Price Crossing Below VWAP:
Trigger: When the closing price crosses from above to below the VWAP.
Alert Message: "Price has crossed below the Granular VWAP."
Purpose: Keeps traders informed of significant price movements relative to the VWAP, facilitating timely trading decisions.
📊 Plotting and Visualization
Description: Displays the calculated Granular VWAP on the chart with user-defined styling.
Customization Options:
Color, Thickness, and Style: As defined in the VWAP Line Customization section.
Track Price Feature:
Parameter: trackprice=true
Function: Ensures that the VWAP line remains visible even when the price moves far from the VWAP.
Purpose: Provides a clear and persistent visual reference of the VWAP on the chart, aiding in trend analysis and support/resistance identification.
⚙️ Performance Optimizations
Description: Ensures the indicator runs efficiently, especially on higher timeframes with large datasets.
Strategies Implemented:
Minimized Security Calls: Utilizes two separate request.security calls to fetch necessary data, balancing functionality and performance.
Efficient Calculations: Employs built-in functions like ta.sum for rolling calculations to reduce computational load.
Conditional Processing: Alerts are processed only when enabled, preventing unnecessary computations.
Purpose: Maintains smooth chart performance and responsiveness, even when using lower timeframe data for granular calculations.
Komut dosyalarını "vwap" için ara

Multi Day vWAP (Customizable) with AverageIntroducing the Multi-Day vWAP indicator that is fully customizable with average indicator option.
High level overview (default settings):
Default is 10 plots with each setting 1 day apart (1-10 day look back)
Labels for each plot are turned on by default (labels will default to your value, more below)
Use Style tab in options to change colors, plot style, and turn on/off individual plots
Average is turned off by default (style panel will show it's on-- go to Inputs panel and select "Show vWAP Average" to turn on)
Best use case is go to Visibility Panel in options and turn off for Days, Weeks, and Months
To turn off all labels at once go to Style tab and unselect "Labels" checkbox
If you want plots to be as small as possible in Inputs panel set the Plot Width to 0 (zero)
Detail Overview
This indicator will plot your custom daily vWAP values.
You can change the lookback period. If you change the lookback period the label will match your custom value.
For instance, if you change vWAP 1 value to "5", the label for this plot will be 5.
Average Notes:
The average will average all the vWAP values by the divisor. The default is to average all values by 10.
The average will always start to plot from the shortest lookback period. It is not possible to have the average plot before that point.
Trading Tips (default settings)
The simple way to use the vWAP is to treat them as magnets.
For intance,
Generally if price is trading below all the vWAP plots the chart is in a momentum short enviroment. All vWAP areas can be used for upside resistance/reaction areas.
If price is trading above the chart is in a momentum long enviroment and pullbacks can to vWAP levels can be looked as areas of support/reaction.
For instance:
Price is above the current day vWAP and looking to test the previous day vWAP value.
As it approaches the 2 value you are expecting this area to be a reaction area (good trade entry area) for a continuation short trade. Possibly to check back into the current day vWAP value.
I should share that this is a simple way to trade with the vWAP (true success with vWAP is understanding that price trades in vWAP channels).
Stacking and Strong Momentum
The other pattern you should look for is stacking.
For instance on this CL chart:
This chart is strong momentum long.
All 10 day vWAP plots are stacked on top of each other.
Previous action tested below all vWAPs. Price traded thru and came back and retested. Finally closing above all and above the vWAP avearge (red).
When the day vWAP was broke the next target you look for is the 2 vWAP. This reaction area held up and momentum long continued and continuing to trade above current day vWAP.
7 Day Rolling Example (Larger Timeframe)
Another great way to use this indicator is to customize the values for rolling 7 days (5 days for cash markets).
To do this set values to: 7, 14, 21, 28, 35, 42, 49, 56, 63, 70
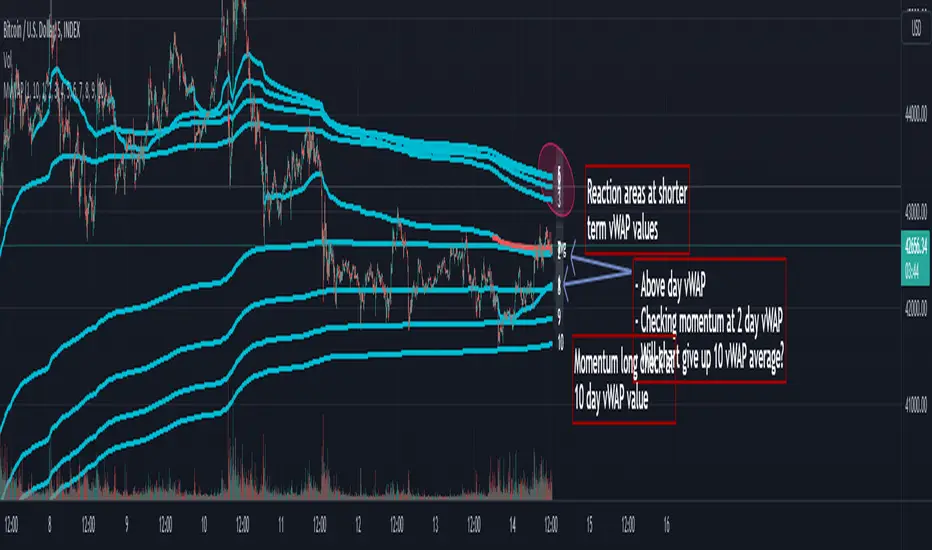
For instance, this BTC chart:
This chart provides a good example of what you'll find when a chart is at a pivot point.
Price is checking in at the average to remain momentum long.
Upside longer term vWAP plots have been tested and had expected reaction.
Price is trading above the shorter term values.
Simple TA here will note if chart continues to trade above and takes out upper vWAPs long momentum is gaining ground.
On the downside if price trades thru the lower vWAP plots you would expect further downside. In this scenario you would be mindful to expect upside tests before (which could be good entry/reaction areas).
NQ example with 7 day values:
Overall chart is momentum short.
7 is above 14, 21
Maybe early sign of bottom.
If price takes out these values and holds above the buyers have quite a few challenges above.
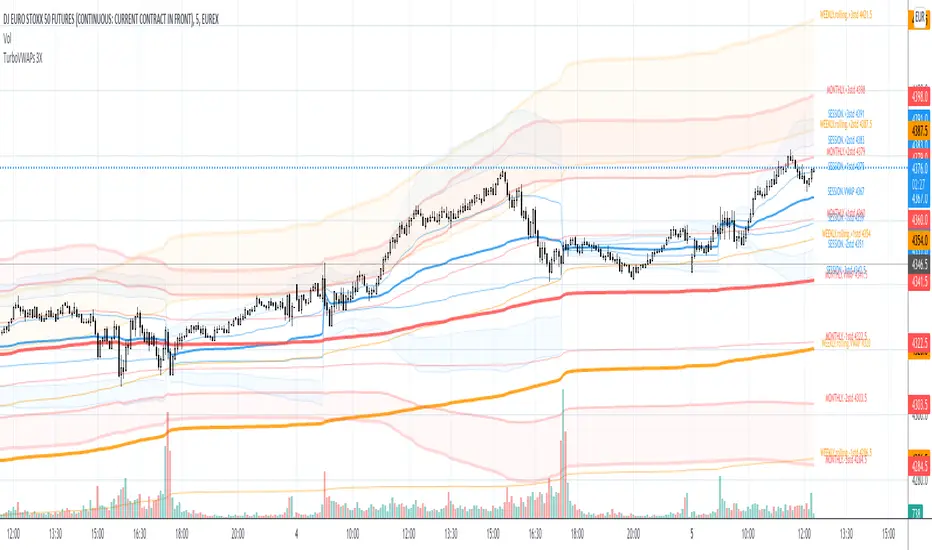
TurboVWAPs 3XAwesome indicator that will plot on your chart up to 3 different VWAPs and optionally up to 3 standard deviations for each one.
Each VWAP can be configured to be a Rolling or Anchored VWAP and to automatically adapt its period depending on the current chart timeframe. For example, you can configure each VWAP to be a rolling 30min VWAP for timeframes below 30M, a session-anchored VWAP between 30M and 1D timeframes, a rolling monthly VWAP for a 1D timeframe and a quarterly VWAP for a weekly timeframe.
You can disable any of the three VWAPs or any of its standard deviations bands.
For session-anchored VWAPs the script will automatically set session times depending on the current futures contract (only for US and EUR futures) if desired. You can disable this feature and manually input session start and end times.
Multi VWAP [MW]Introduction
The Multi VWAP tool extends the concept of using the Anchored Volume Weighted Average Price, popularized by its founder, Brian Shannon, founder of AlphaTrends, and creates automatic AVWAPS for multiple anchor points, such as for 2-day, 3-day, 4-day, 5-day, and custom date anchors as well as automagically creating month-to-date and year-to-date anchors. Currently, most standard VWAP tools allow users to place custom anchored VWAPs, but the routine of doing this for every equity being watched can become cumbersome. This tool makes that process multi-times easier. Brian Shannon is also the author of “Maximum Trading Gains With Anchored VWAP: The Perfect Combination of Price, Time, and Volume”. Available at Amazon.
Settings
Daily VWAP : A continuous line of the the daily Volume Weighted Average Price (VWAP)
Weekly VWAP : A continuous line of the weekly VWAP
2-Day AVWAP : The anchored VWAP from 2 trading days ago (holidays and weekends are excluded in this calculation)
3-Day AVWAP : The anchored VWAP from 3 trading days ago
4-Day AVWAP : The anchored VWAP from 4 trading days ago
5-Day AVWAP : The anchored VWAP from 5 trading days ago. The slope of this line and the position of the price relative to this line can be used to determine trend direction.
10-Day AVWAP : The anchored VWAP from 10 trading days ago
Month-to-Date AVWAP : The anchored VWAP from the beginning of the current month
Year-to-Date AVWAP : The anchored VWAP from the beginning of the current year
Custom Date AVWAP : Sets a date to begin an anchored VWAP starting from any time.
Use only the most recent VWAP for Week, Month, and Year: Toggles on and off the continuous weekly, monthly, and yearly VWAPs
Calculations
This indicator does not provide buy or sell signals. It is simply the VWAP calculated starting from an “anchor point”, or start time. It is the calculated by the summation of Price x Volume / Volume for the period starting at the anchor point.
How to Interpret
According to Brian Shannon, VWAP is an objective measure of what the average trader has paid for a particular equity over a given period, and is the value that large institutional investors frequently use as a trade signal. Therefore, by definition, when the price is above an AVWAP, buyers are in control for that period of time. Likewise, if the price is below the AVWAP, sellers are in control for that period of time.
Shannon also distinguishes the importance of an increasing or decreasing 5 day VWAP, which reflects the price sentiment, objectively, for roughly the last trading week, or 5 trading days. Pricing below a decreasing 5-day VWAP is considered very bearish, while pricing above an increasing 5-day VWAP is considered bullish and is recommended before considering long positions.
Additionally, a custom VWAP can be generated to coincide with important events, such as FOMC meetings, CPI reports, earnings reports, etc.
Practically speaking, price action can tend to change direction when a significant VWAP is hit, voiding buy and sell signals. Like moving averages, this indicator can show, in real-time, how a buy or sell signal should be interpreted. A significant AVWAP line is a point of interest, and can serve as strong support or resistance, because large institutions may be using those values for entries or exits. For a great analysis of how to use AVWAP, visit the AlphaTrends channel on Youtube here or you can buy Brian Shannon’s “Anchored VWAP” book on Amazon.
Other Usage Notes and Limitations
It's important for traders to be aware of the limitations of any indicator and to use them as part of a broader, well-rounded trading strategy that includes risk management, fundamental analysis, and other tools that can help with reducing false signals, determining trend direction, and providing additional confirmation for a trade decision. Diversifying strategies and not relying solely on one type of indicator or analysis can help mitigate some of these risks.
Additionally, the indicator may take a little longer to load than usual. On the rare occasion where it fails to load, you may need to remove the indicator and add it back to your chart. Also, if you do encounter this problem, avoid redrawing your chart while the indicator is being added to the screen.
Acknowledgements
This script uses the MarketHolidays library by @Protervus. Also, for debugging, the JavaScript-style Debug Console by @algotraderdev and the TimeFormattingLibrary by @twingall were invaluable. And, of course, without Brian Shannon's books, videos, and interviews, this indicator would would not be possible.

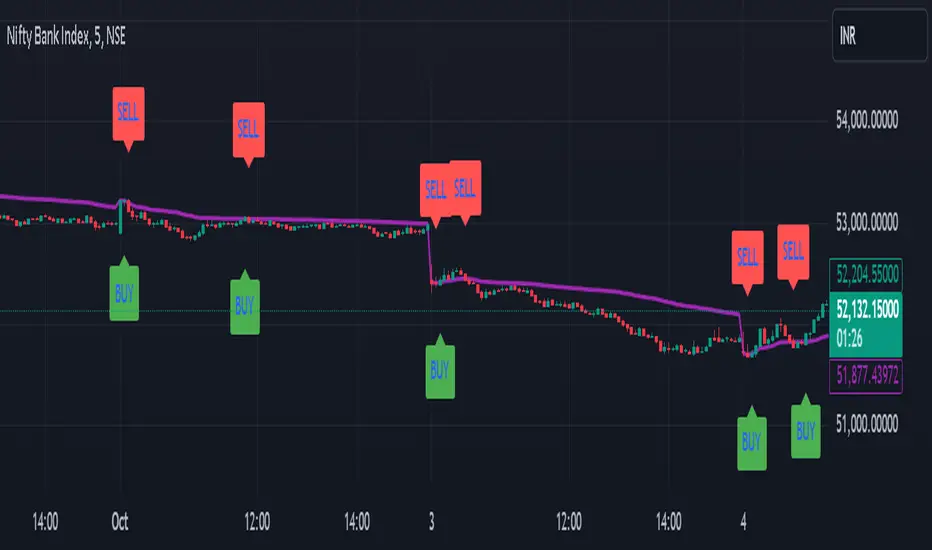
Cumulative Volume Delta with VWAP-based Buy/Sell AlertsDescription:
This script combines Cumulative Volume Delta (CVD) with Volume Weighted Average Price (VWAP) to generate buy and sell signals. It plots both the cumulative volume delta and its moving average on the chart, but the actual buy and sell signals are now based on the crossover and crossunder of the price with the VWAP, a popular tool for tracking price relative to the volume-weighted average over time.
Features:
Cumulative Volume Delta (CVD) Plot:
CVD helps visualize the net buying or selling pressure by accumulating volume when the price is rising and subtracting it when the price is falling. The cumulative volume is plotted on the chart as a blue line.
Moving Average of CVD:
A simple moving average (SMA) of the cumulative volume delta is plotted in orange to smooth out fluctuations and help detect the trend of volume flow.
VWAP Calculation:
VWAP (Volume Weighted Average Price) is a standard benchmark widely used in trading. It gives insight into whether the price is trading above or below the average price at which most of the volume has traded, weighted by volume. The VWAP is plotted as a purple line on the chart.
Buy/Sell Signals Based on VWAP:
Buy Signal: Triggered when the price crosses above the VWAP, indicating potential upward momentum.
Sell Signal: Triggered when the price crosses below the VWAP, signaling potential downward momentum.
These signals are displayed on the chart with clear labels:
Buy Signal: A green upward label appears below the price.
Sell Signal: A red downward label appears above the price.
Alerts for Buy/Sell Conditions:
Alerts are built into the script, so traders can receive notifications when the following conditions are met:
Buy Alert: The price crosses above the VWAP.
Sell Alert: The price crosses below the VWAP.
Use Case:
This script is useful for traders looking to incorporate both volume-based indicators and the VWAP into their trading strategy. The combination of CVD and VWAP provides a more comprehensive view of both price and volume dynamics:
VWAP helps traders understand whether the price is trading above or below its volume-weighted average.
CVD highlights buying or selling pressure through cumulative volume analysis.
Customization:
Anchor Periods: The user can customize the anchor period to suit different timeframes and trading styles.
Custom Alerts: The alert conditions can be easily modified to integrate into any trader’s strategy.
This script can be adapted for both short-term and long-term trading strategies and is especially useful in high-volume markets.
How to Use:
Add the script to your TradingView chart.
Customize the timeframe and anchor period, if needed, to match your preferred trading style.
Watch for Buy/Sell signals based on price crossing the VWAP.
Set up alerts to receive notifications when Buy or Sell signals are triggered.
This script is designed to help traders make informed decisions based on both price action relative to volume and Cumulative Delta volume trends, giving a more comprehensive view of the market dynamics.
Dynamic Trend Indicator (DTI) - VWAP FilterThe Dynamic Trend Indicator (DTI) with VWAP Filter is a trend-following indicator.
It aims to identify and follow market trends while minimizing false signals in choppy or ranging markets.
The DTI combines a dynamically adjusted Exponential Moving Average (EMA) with a daily Volume Weighted Average Price (VWAP) confirmation filter and a cooldown mechanism to enhance signal reliability. This indicator is particularly useful for traders on intraday timeframes (e.g., 4-hour charts) who want to align their trades with the broader daily trend while avoiding whipsaws.
Key Features:
Dynamic Trend Line:
The core of the DTI is a trend line calculated using a custom EMA that adjusts its period dynamically based on market conditions.
The period of the EMA is determined by a combination of volatility (measured via ATR) and trend strength (measured via price momentum). In strong trends, the period shortens for faster responsiveness; in weak or ranging markets, it lengthens to reduce noise.
An optional smoothing EMA can be applied to the dynamic trend line to further reduce noise, with a user-defined smoothing length.
Daily VWAP Confirmation Filter:
A daily VWAP is calculated to provide a higher-timeframe trend bias. VWAP represents the average price paid for an asset during the day, weighted by volume, and is often used as a benchmark by institutional traders.
Buy signals are only generated when the price is above the daily VWAP (indicating a bullish daily bias), and sell signals are only generated when the price is below the VWAP (indicating a bearish daily bias).
The VWAP resets at the start of each day, ensuring it reflects the current day’s trading activity.
Cooldown Mechanism:
To prevent rapid signal reversals (whipsaws), the indicator includes a cooldown period between signals. After a buy or sell signal is generated, no new signals can be generated for a user-defined number of bars (default: 5 bars).
This helps filter out noise in choppy markets, ensuring signals are spaced out and more likely to align with significant trend changes.
Visual Elements:
Trend Line: Plotted on the chart, colored green when the price is above (uptrend) and red when below (downtrend). A gray color indicates a neutral trend.
Buy/Sell Signals: Displayed as green triangles below the bar for buy signals and red triangles above the bar for sell signals.
Background Coloring: The chart background is shaded green during uptrends and red during downtrends, providing a quick visual cue of the trend direction.
Daily VWAP Line: Optionally plotted as a purple step line, allowing traders to see the VWAP level and its relationship to the price.
Alerts:
The indicator includes built-in alerts for buy and sell signals, triggered when the price crosses the trend line and satisfies the VWAP filter and cooldown conditions.
Alert messages specify whether the signal is a buy or sell and confirm that the VWAP condition was met (e.g., "DTI Buy Signal: Price crossed above trend line and VWAP").
Input Parameters
Base Length (default: 14): The base period for calculating volatility and trend strength, used to adjust the dynamic EMA period.
Volatility Multiplier (default: 1.5): Adjusts the sensitivity of the dynamic period to market volatility (via ATR).
Trend Threshold (default: 0.5): Controls the sensitivity of the dynamic period to trend strength (via price momentum).
Use Smoothing (default: true): Enables/disables smoothing of the trend line with an additional EMA.
Smoothing Length (default: 3): The period for the smoothing EMA, if enabled.
Cooldown Bars (default: 5): The minimum number of bars between consecutive signals, reducing signal frequency in choppy markets.
Show Daily VWAP (default: true): Toggles the display of the daily VWAP line on the chart.
How It Works
Dynamic Trend Line Calculation:
Volatility is measured using the Average True Range (ATR) over the base length, scaled by the volatility multiplier.
Trend strength is calculated as the absolute price momentum (change in price over the base length) divided by the volatility factor.
The dynamic EMA period is adjusted based on the trend strength: stronger trends result in a shorter period (faster response), while weaker trends result in a longer period (more stability). The period is constrained between 5 and 50 to avoid extreme values.
A custom EMA function is used to handle the dynamic period, as Pine Script’s built-in ta.ema() requires a fixed length. The trend line is optionally smoothed with a secondary EMA.
Signal Generation:
A buy signal is generated when the price crosses above the trend line, the price is above the daily VWAP, and the cooldown period has elapsed.
A sell signal is generated when the price crosses below the trend line, the price is below the daily VWAP, and the cooldown period has elapsed.
The cooldown mechanism ensures that signals are not generated too frequently, reducing false signals in ranging markets.
Daily VWAP Calculation:
The VWAP is calculated by accumulating the price-volume product (close * volume) and total volume for the day, resetting at the start of each new day.
The VWAP is then computed as the cumulative price-volume divided by the cumulative volume, providing a volume-weighted average price for the day.
Usage
Timeframe: Best suited for intraday timeframes (e.g., 1-hour, 4-hour) where the daily VWAP provides a higher-timeframe trend bias. It can also be used on daily charts with adjustments to the cooldown period.
Markets: Works well in trending markets (e.g., forex, crypto, stocks) where the dynamic trend line can capture sustained price movements. The VWAP filter helps align signals with the daily trend, making it effective for assets with clear daily biases.
Trading Strategy:
Buy: Enter a long position when a green triangle (buy signal) appears, indicating the price has crossed above the trend line and is above the daily VWAP.
Sell: Enter a short position (or exit a long) when a red triangle (sell signal) appears, indicating the price has crossed below the trend line and is below the daily VWAP.
Use the trend line and VWAP as dynamic support/resistance levels to set stop-losses or take-profit targets.
Backtesting: Use TradingView’s strategy tester to evaluate the indicator’s performance on your chosen market and timeframe, adjusting parameters like cooldown_bars and volatility_mult to optimize for profitability.
Example
On a 4-hour SOLUSDT chart, the DTI with VWAP Filter might show:
An uptrend with the price above the green trend line and above the daily VWAP, generating buy signals as the price continues to rise.
A downtrend where the price falls below the red trend line and the daily VWAP, generating sell signals that align with the bearish daily bias.
During choppy periods, the cooldown mechanism and VWAP filter reduce false signals, ensuring trades are taken only when the price aligns with the daily trend.
Limitations
Lagging Nature: Like all trend-following indicators, the DTI may lag during sharp price reversals, as the dynamic EMA needs time to adjust.
Ranging Markets: While the VWAP filter and cooldown mechanism reduce whipsaws, the indicator may still generate some false signals in strongly ranging markets. Combining it with a trend strength filter (e.g., ADX) can help.
VWAP Dependency: The effectiveness of the VWAP filter depends on the market’s respect for the daily VWAP as a support/resistance level. In markets with low volume or erratic price action, the VWAP may be less reliable.
Potential Improvements
VWAP Buffer: Add a percentage buffer around the VWAP (e.g., require the price to be 1% above/below) to further reduce noise.
Multi-Timeframe VWAP: Incorporate a weekly VWAP for additional trend confirmation on longer timeframes.
Trend Strength Filter: Add an ADX filter to ensure signals are generated only during strong trends (e.g., ADX > 25).

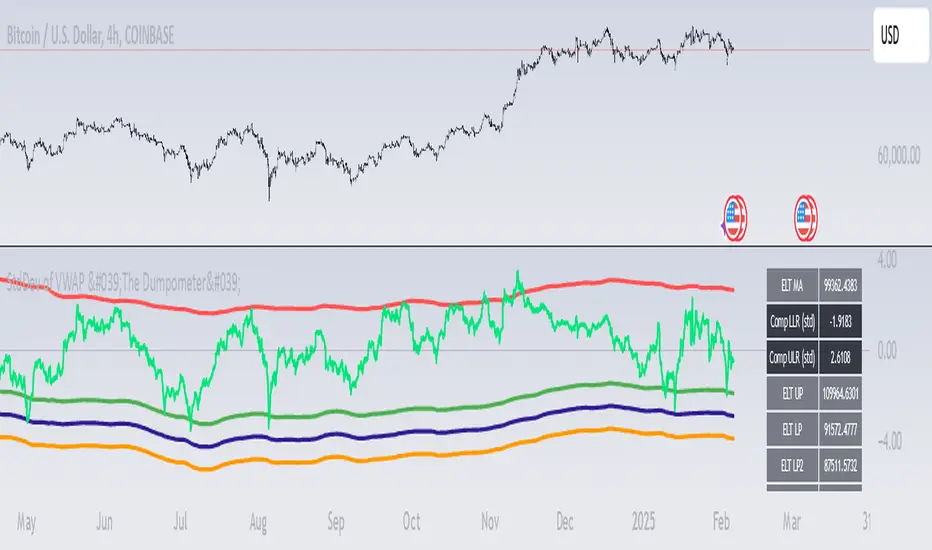
StdDev of VWAP/MAStdDev Indicator (MA, Smoothed VWAP & Rolling VWAP) v5
Overview: The StdDev Indicator is a comprehensive tool designed to provide traders with multi-term deviation analysis by integrating various Moving Averages (MA) and Volume Weighted Average Price (VWAP) methodologies. This indicator combines different MA types and VWAP calculations across multiple timeframes to offer a nuanced view of market volatility and trend strength.
Key Features:
Multiple Moving Average Types:
Simple Moving Average (SMA): Calculates the average price over a specified period, providing a straightforward trend indicator.
Exponential Moving Average (EMA): Gives more weight to recent prices, making it more responsive to new information.
Weighted Moving Average (WMA): Assigns different weights to each price point, emphasizing specific periods.
Smoothed VWAP: Enhances the traditional VWAP by applying additional smoothing techniques (SMA, EMA, WMA) to reduce volatility.
Rolling VWAP: Continuously recalculates VWAP over a rolling window, offering dynamic support and resistance levels.
Multi-Term Deviation Analysis:
Extra Short Term (30 periods)
Short Term (50 periods)
Medium Term (110 periods)
Long Term (125 periods)
Extra-Long Term (190 periods)
Extremely-Long Term (245 periods)
Each term calculates the deviation of the selected price source (default: Low) from its corresponding MA or VWAP, normalized by the standard deviation. This multi-term approach allows traders to assess volatility and trend consistency across different time horizons.
Composite Upper and Lower Bounds:
Aggregates the upper and lower deviations from all terms to form composite boundaries. These bounds serve as dynamic support and resistance levels, helping traders identify potential reversal points or breakout zones.
Timeframe Customization:
Visibility Settings: Customize which deviation terms are visible on specific timeframes (15m, 1h, 4h, 1d, 1w). This flexibility ensures that the indicator aligns with your trading strategy, whether you're a scalper, day trader, or long-term investor.
Bar Coloring (Optional):
Visual Cues: When enabled, bars are color-coded based on the deviation levels, providing immediate visual feedback on market conditions. For example, bars may turn red when short-term deviations exceed the upper bound, indicating potential overbought conditions.
How It Works:
Deviation Calculation:
For each selected MA or VWAP type and term length, the indicator calculates the deviation of the current price source from the MA/VWAP. This deviation is normalized by the standard deviation to account for volatility.
Channel Offset:
Applies a linear regression and standard deviation to the deviation series to establish upper and lower channels. These channels are adjustable via multipliers, allowing traders to set their sensitivity levels.
Composite Boundaries:
Averages the upper and lower channels across all deviation terms to form composite upper and lower bounds. These bounds provide a holistic view of market volatility and trend strength.
Visualization:
Plots individual deviation lines for each term, along with the composite bounds. Optional bar coloring enhances visual interpretation, making it easier to spot significant market movements.
Usage Instructions:
Setup:
Add the StdDev Indicator to your TradingView chart. By default, it uses the Low price as the source, but this can be customized.
Configuration:
Moving Average Type: Select your preferred MA or VWAP type from the dropdown menu.
Term Lengths: Adjust the lengths for each deviation term as per your trading strategy.
StdDev Multipliers: Set the multipliers for the upper and lower bounds to control sensitivity.
Timeframe Visibility: Choose which deviation terms are visible on specific timeframes to tailor the indicator to your trading style.
Bar Coloring: Enable or disable bar coloring based on deviation thresholds for enhanced visual cues.
Interpretation:
Deviations: Monitor the deviation lines to assess overbought or oversold conditions across different terms.
Composite Bounds: Use the upper and lower bounds as dynamic support and resistance levels.
Bar Colors: Quickly identify significant market movements through color-coded bars.
Why Choose StdDev Indicator?
Comprehensive Analysis: By integrating multiple MA and VWAP types across various terms, the indicator offers a multifaceted view of market conditions.
Customization: Highly configurable settings allow traders to adapt the indicator to their specific strategies and timeframes.
Visual Clarity: Clear plotting and optional bar coloring provide intuitive insights, reducing the need for complex analysis.
Conclusion: The StdDev Indicator (MA, Smoothed VWAP & Rolling VWAP) v5 is a versatile tool that combines advanced moving average and VWAP methodologies to deliver a robust deviation analysis framework. Whether you're looking to fine-tune your scalping strategy or gain a deeper understanding of long-term market trends, this indicator equips you with the necessary tools to make informed trading decisions.
Support & Feedback: If you have any questions or need assistance with the indicator, feel free to reach out through the TradingView community or contact the script author directly.
RD Key Levels (Weekly, Daily, Previous vWAP)The RexDog Key Levels indicator plots the weekly open, daily open, and the previous day vWAP close.
These are all critical price levels (zones) to know when trading any market or instrument. These areas are also high probability reaction areas that you can trade using simple confirmation trading patterns.
First, I'll cover an overview of the indicator then I'll share general usage tips.
Weekly Open - default is white/orange. White is when price is above the weekly open. Orange is when price is below the weekly open.
Weekly High/Low - there are options to turn on the weekly high and lows. Default plot is circles. Green is the high. Red is the low.
Daily Open - default is green/red. Green is when price is above the daily open. Red is when price is below the daily open.
Previous vWAPs - aqua single lines. These are the closing price of the daily vWAPs.
Top Indicators - The triangles at the top of the chart signify is price is currently above or below the weekly open. This is helpful on lower timeframe charts (5m, 15m) to get a quick indication when price is far extended beyond the weekly open. Green triangle = above weekly open. Red triangle = below weekly open.
General Usage
Each one of these levels are important levels markets look use for continuation or failure of momentum and bias. I also find it extremely helpful to think of these levels as magnets, dual magnets. They both attract and repel price at the same time. Now you might say, how is that helpful to have opposing views at the same time? Be indifferent to direction, create your own rules on when these price zones repel or attract price, I have my own.
Here's the easiest way to use these price levels.
As price approaches one of these levels to expect a reaction. A reaction is price is going in one direction and price hits a price level zone and reacts in the opposite direction.
These are price zones, sometimes you will see a reaction right at the price but visualize these areas as zones of reaction.
A high percentage of the time when price approaches these level zones there will be a reaction. So trade the reaction .
How do you do that?
Simple. Trade patterns that repeat. I have 3 solid patterns I trade around these key levels:
The first pattern is early entry with precise scale in rules and a very effective protective stop loss placement.
The second pattern is wait for confirmation that the level holds. This requires more patience and for you to fully trust the chart. The benefit of this pattern is with confirmation you have even more precise stop placement.
There is a bonus third pattern I trade around these levels. I call this the confirmation and bluff entry. It's a combination of both of the patterns above. You wait for confirmation but on any pull back you call the bluff on the market and enter on key test. Trade management here is critical. In addition to the pattern you trade you should have a series of failure patterns that tell you to get out of the trade, I use 2 primary failure patterns.
I trade all markets, same system, same rules, so I'll show a few examples.
Usually I start with Bitcoin but let's start with equities:
BA - Boeing - 8 Trades
Here we see weekly low patterns, previous week low test, vwAP hold patterns, day magnets and day holding. Then 2 week failures and a double hold pattern.
These are all straightforward trades to execute following really simple patterns.
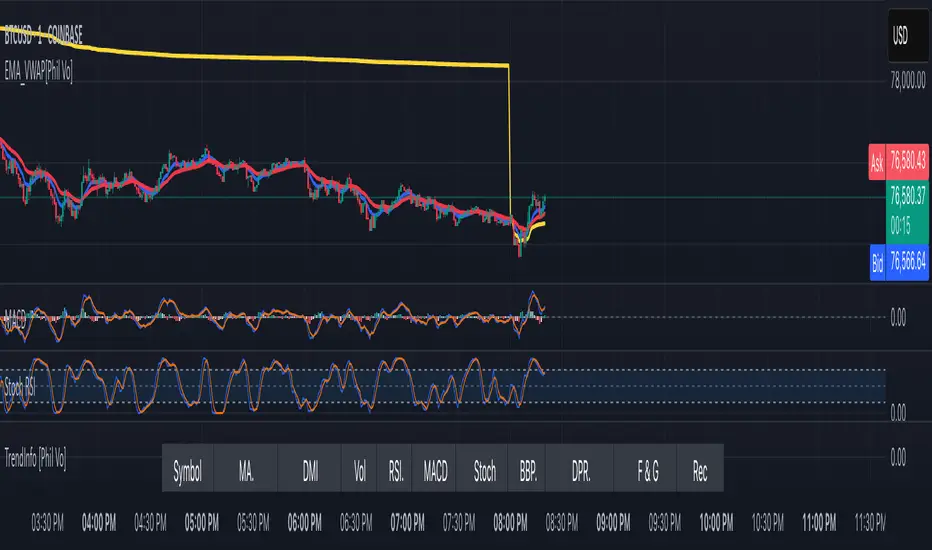
BTCUSD Previous vWAP and Day Open Trades
We see here on the circle areas both daily open and previous day vWAP zone tests. Within this chart are all 3 highly effective patterns I trade.
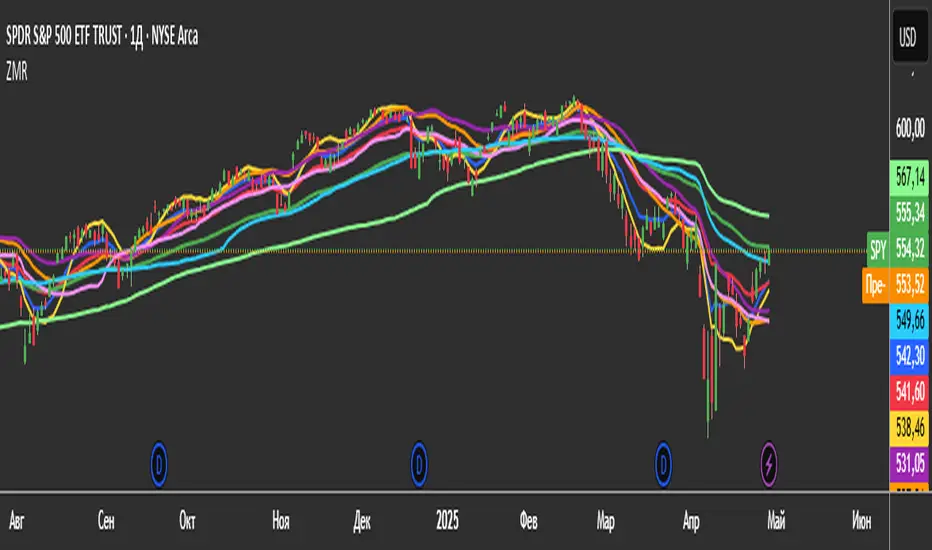
SPY - 7 High Probability Trades
Here we see a pDay vWAP mixed with a daily failure. Next a daily retest, then a pDay vWAP failure, then a vWAP capture and test. Then a double weekly failure test (great trade there) and finally a daily test.
I could provide more examples but most are just derivatives of the above examples.

DIN: Dynamic Trend NavigatorDIN: Dynamic Trend Navigator
Overview
The Dynamic Trend Navigator script is designed to help traders identify and capitalize on market trends using a combination of Weighted Moving Averages (WMA), Volume Weighted Average Price (VWAP), and Anchored VWAP (AVWAP). The script provides customizable settings and flexible alerts for various crossover conditions, enhancing its utility for different trading strategies.
Key Features
- **1st and 2nd WMA**: Allows users to set and visualize two Weighted Moving Averages. These can be customized to any period, providing flexibility in trend identification.
- **VWAP and AVWAP**: Incorporates both VWAP and AVWAP, offering insights into price levels adjusted by volume.
- **ATR and ADX Indicators**: Includes the Average True Range (ATR) and Average Directional Index (ADX) to help assess market volatility and trend strength.
- **Flexible Alerts**: Configurable buy and sell alerts for any crossover condition, making it versatile for various trading strategies.
How to Use the Script
1. **Set the WMA Periods**: Customize the periods for the 1st and 2nd WMAs to suit your trading strategy.
2. **Enable VWAP and AVWAP**: Choose whether to include VWAP and AVWAP in your analysis by enabling the respective settings.
3. **Configure Alerts**: Set up alerts for the desired crossover conditions (WMA, VWAP, AVWAP) to receive notifications for potential trading opportunities.
4. **Monitor Signals**: Watch for buy and sell signals indicated by triangle shapes on the chart, which appear at the selected crossover points.
When to Use
- **Best Time to Use**: The script is most effective in trending markets where price movements are well-defined. It helps traders stay on the right side of the trend and avoid false signals during periods of low volatility.
- **When Not to Use**: Avoid using the script in choppy or sideways markets where price action lacks direction. The script may generate false signals in such conditions, leading to potential losses.
Benefits of VWAP and AVWAP
- **VWAP**: The Volume Weighted Average Price provides a price benchmark that adjusts for volume, helping traders identify fair value levels. It is particularly useful for intraday trading and gauging market sentiment.
- **AVWAP**: The Anchored VWAP allows traders to set a starting point for VWAP calculations, providing flexibility in analyzing price levels over specific periods or events. This helps in identifying key support and resistance levels based on volume.
Unique Aspects
- **Customizability**: The script offers extensive customization options for WMA periods, VWAP, AVWAP, and alert conditions, making it adaptable to various trading strategies.
- **Combining Indicators**: By integrating WMAs, VWAP, AVWAP, ATR, and ADX, the script provides a comprehensive view of market conditions, enhancing decision-making.
- **Real-Time Alerts**: The flexible alert system ensures traders receive timely notifications for potential trade setups, improving responsiveness to market changes.
Examples
- **Example 1**: A trader sets the 1st WMA to 8 and the 2nd WMA to 100, enabling the VWAP. When the 1st WMA crosses above the 2nd WMA or VWAP, a buy signal is triggered, indicating a potential long entry.
- **Example 2**: A trader sets the AVWAP to start 30 bars ago and monitors for crossovers with the 1st WMA. When the 1st WMA crosses below the AVWAP, a sell signal is triggered, suggesting a potential short entry.
Final Notes
The Dynamic Trend Navigator script is a powerful tool for traders looking to enhance their market analysis and trading decisions. Its unique combination of customizable indicators and flexible alert system sets it apart from other scripts, making it a valuable addition to any trader's toolkit.
Disclaimer: Never any financial advice. Just ThisGirl loving experimenting with indicators to help myself, as well as others.

CVD VWAP (1m CVD, Daily/Weekly + EMA + WMA)🟠 CVD VWAP (1m CVD, Daily/Weekly + EMA + WMA)
This custom indicator combines Cumulative Volume Delta (CVD) with a VWAP-style calculation, built on 1-minute resolution data, and includes smoothed trend analysis via EMA and WMA.
🔍 Key Features:
1-Minute CVD Calculation:
Captures buying vs. selling pressure by comparing close vs. open price per minute.
CVD-Based VWAP:
A custom VWAP that uses CVD instead of price, reset Daily or Weekly (user-selectable). This helps identify volume-weighted mean "pressure" rather than price-weighted mean value.
Smoothed Trend Lines:
EMA (Exponential Moving Average): Applied to the CVD to show short-term momentum shifts.
WMA (Weighted Moving Average): Highlights trend strength and sensitivity with adjustable period, thickness, and color.
Flexible Visuals:
Adjustable thickness for each line.
Displayed in a separate pane for clear analysis, independent of price action.
⚙️ Inputs:
VWAP Reset Mode: Choose between Daily or Weekly reset.
EMA Period & Thickness
WMA Period, Color & Thickness
🧠 Use Cases:
Detect divergence between price and CVD-based VWAP.
Monitor trend alignment via CVD, EMA, and WMA.
Evaluate volume-driven moves, especially during session opens or key volume spikes.
💡 Ideal for traders focused on volume-based analysis, order flow insights, or those looking to enhance VWAP strategies using a more nuanced approach with CVD.

BooBee Digital - Enhanced Buy & Sell Alerts Suite
BooBee Digital - Enhanced Buy & Sell Alerts Suite
Introduction:
The “BooBee Digital - Enhanced Buy & Sell Alerts Suite” is a comprehensive trading tool designed to provide traders with precise buy and sell signals by integrating the Average True Range (ATR) trailing stop technique and the Volume Weighted Average Price (VWAP) indicator. This script is tailored to help traders make informed decisions by considering both market volatility and trading volume.
How It Works:
1. ATR Calculation:
• Purpose: Measures market volatility to set dynamic stop levels.
• Details: The Average True Range (ATR) is calculated over a user-defined period. The ATR value reflects the average range of price movements over the specified period, which is crucial for assessing market volatility.
2. ATR Trailing Stop:
• Purpose: Identifies potential trend reversals by setting trailing stops based on market volatility.
• Details: The ATR trailing stop is dynamically adjusted using the ATR value and a user-defined sensitivity factor. This trailing stop level helps identify trend reversals by moving in accordance with price fluctuations.
3. VWAP Calculation:
• Purpose: Provides a volume-weighted average price to benchmark fair value.
• Details: The VWAP is calculated by taking the sum of the product of price and volume, divided by the total volume. This indicator gives traders a reference point for the average price at which the asset has traded throughout the day, considering trading volume.
4. EMA Crossover:
• Purpose: Adds a confirmation layer for buy and sell signals.
• Details: A 1-period Exponential Moving Average (EMA) is used to identify short-term price movements. Buy and sell signals are generated based on the crossover of the EMA and the ATR trailing stop, adding an extra layer of confirmation for trade entries and exits.
Signal Generation:
Buy Signal:
• Generated when the price is above the ATR trailing stop and there is a bullish crossover of the EMA and ATR trailing stop.
• Indicator: Green label below the bar with “Buy” text.
Sell Signal:
• Generated when the price is below the ATR trailing stop and there is a bearish crossover of the EMA and ATR trailing stop.
• Indicator: Red label above the bar with “Sell” text.
VWAP Line:
• The VWAP line is plotted on the chart to help traders identify significant price levels based on trading volume.
• Indicator: Blue line representing the VWAP.
How to Use:
• Chart Type: The script is designed for use on standard chart types such as Candlestick and OHLC. It does not support non-standard chart types like Heikin Ashi, Renko, Kagi, Point & Figure, and Range, as they may produce unrealistic results.
• Clean Chart: Ensure your chart is clean and free of other indicators to avoid confusion. The signals and colors plotted by the script should be easily identifiable.
• Trade Confirmation: Use the buy and sell signals generated by the script in conjunction with other analysis methods to confirm trades.
Key Concepts:
• ATR Trailing Stop: This technique sets dynamic stop levels based on market volatility, helping to identify trend reversals.
• VWAP: This indicator provides a benchmark for the average price considering trading volume, helping traders identify fair value.
• EMA Crossover: This adds a layer of confirmation for buy and sell signals, improving the accuracy of trade entries and exits.

Anchored VWAP by Time (Math by Thomas)📄 Description
This tool lets you plot an Anchored Volume Weighted Average Price (VWAP) starting from any specific date and time you choose. Unlike standard VWAPs that reset daily or weekly, this version gives you full control to track institutional pricing zones from precise anchor points—such as key swing highs/lows, market open, or news-driven candles.
It’s especially useful for price action and Smart Money Concepts (SMC) traders who track liquidity, fair value gaps (FVGs), and institutional zones.
🇮🇳 For NSE India Traders
You can anchor VWAP to Indian market open (e.g., 9:15 AM IST) or major events like RBI policy, earnings, or breakout candles.
The time input uses UTC by default, so for Indian Standard Time (IST), remember:
9:15 AM IST = 3:45 AM UTC
3:30 PM IST = 10:00 AM UTC
⚙️ How to Use
Add the indicator to your chart.
Open the settings panel.
Under “Anchor Start Time”, choose the date & time to begin the VWAP.
Use UTC format (adjust from IST if needed).
Customize the line color and thickness to suit your chart style.
The VWAP will begin plotting from that time forward.
🔎 Best Use Cases
Track VWAP from intraday range breakouts
Anchor from swing highs/lows to identify mean reversion zones
Combine with your FVGs, Order Blocks, or CHoCHs
Monitor VWAP reactions during key macro events or expiry days
🔧 Clean Design
No labels are used, keeping your chart clean.
Works on all timeframes (1min to Daily).
Designed for serious intraday & positional traders.

Multi-Timeframe VWAP DashboardMulti-Timeframe VWAP Dashboard with Advanced Customization**
Unlock the power of **Volume-Weighted Average Price (VWAP)** across multiple timeframes with this highly customizable and feature-rich Pine Script. Designed for traders who demand precision and flexibility, this script provides a **comprehensive VWAP dashboard** that adapts to your trading style and strategy. Whether you're a day trader, swing trader, or long-term investor, this tool offers unparalleled insights into market trends and price levels.
---
### **Key Features:**
1. **Multi-Timeframe VWAP Calculation:**
- Calculate VWAP across **12-minute, 48-minute, 96-minute, 192-minute, daily, weekly, monthly, and even yearly timeframes**.
- Supports **custom timeframes** for tailored analysis.
2. **Price Source Selection:**
- Choose from multiple price sources for VWAP calculation, including **Open, High, Low, Close, HL2, HLC3, HLCC4, and All**.
- Optimize VWAP for **uptrends and downtrends** by selecting the most relevant price source.
3. **Customizable Labels:**
- Add **dynamic labels** to each VWAP line for quick reference.
- Customize label **colors, sizes, and offsets** to suit your chart setup.
- Display **price values** and **session types** (e.g., "12 Min", "Daily", "Weekly") directly on the chart.
4. **Advanced Session Detection:**
- Automatically detect new sessions for **intraday, daily, weekly, monthly, and yearly timeframes**.
- Ensures accurate VWAP calculations for each session.
5. **Plot Visibility Control:**
- Toggle the visibility of individual VWAP plots to **reduce clutter** and focus on the most relevant timeframes.
- Includes options for **short-term, medium-term, and long-term VWAPs**.
6. **Comprehensive Timeframe Coverage:**
- From **12-minute intervals** to **12-month intervals**, this script covers all major timeframes.
- Perfect for traders who analyze markets across multiple horizons.
7. **User-Friendly Inputs:**
- Intuitive input options for **timeframes, colors, labels, and offsets**.
- Easily customize the script to match your trading preferences.
8. **Dynamic Label Positioning:**
- Labels adjust automatically based on price movements and session changes.
- Choose from **multiple offset options** to position labels precisely.
9. **Miscellaneous Customization:**
- Adjust **text color, label size, and price display settings**.
- Enable or disable **price values** and **session type labels** for a cleaner chart.
---
### **Why Use This Script?**
- **Versatility:** Suitable for all trading styles, including scalping, day trading, swing trading, and long-term investing.
- **Precision:** Accurate VWAP calculations across multiple timeframes ensure you never miss key price levels.
- **Customization:** Tailor the script to your specific needs with a wide range of input options.
- **Clarity:** Dynamic labels and customizable plots make it easy to interpret market trends at a glance.
---
### **How It Works:**
1. **Select Your Price Source:**
- Choose the price source (e.g., Open, Close, HL2) for VWAP calculation based on your trading strategy.
2. **Choose Timeframes:**
- Define the timeframes for VWAP calculation, from intraday to yearly intervals.
3. **Customize Labels and Plots:**
- Enable or disable labels and plots for each timeframe.
- Adjust colors, sizes, and offsets to match your chart setup.
4. **Analyze Market Trends:**
- Use the VWAP lines and labels to identify **support/resistance levels**, **trend direction**, and **potential reversal points**.
5. **Adapt to Market Conditions:**
- Switch between timeframes and price sources to adapt to changing market conditions.
---
### **Ideal For:**
- **Day Traders:** Use short-term VWAPs (e.g., 12-minute, 48-minute) to identify intraday trends and key levels.
- **Swing Traders:** Leverage medium-term VWAPs (e.g., 96-minute, daily) to spot swing opportunities.
- **Long-Term Investors:** Analyze long-term VWAPs (e.g., weekly, monthly) to gauge overall market direction.
---
### **How to Get Started:**
1. Add the script to your TradingView chart.
2. Customize the inputs to match your trading preferences.
3. Analyze the VWAP lines and labels to make informed trading decisions.
---
### **Pro Tip:**
Combine this script with other technical indicators (e.g., moving averages, RSI) for a **holistic view** of the market. Use the VWAP lines as dynamic support/resistance levels to enhance your entry and exit strategies.
This script is a must-have tool for traders who value precision, flexibility, and clarity. Share it with your audience to help them elevate their trading game. Whether they're beginners or seasoned professionals, this **Multi-Timeframe VWAP Dashboard** will become an essential part of their toolkit.

Rumpy's Multi Interval Extended VWAPsExperiment with various intervals of VWAPs and extending them 1 & 2 extra intervals. Uses base intervals from the standard 1 day to half yearly intervals (day/month/quarterly/half yearly).
VWAPs are calculated by the sum of typical price x volume divided by sum volume over the interval. With the 1 D (standard vwap ) the sums reset to zero at the end of the day.
The extensions instead of resetting to zero continues the calculation. Extending the interval an additional interval length.
Technically this means in the case of the standard VWAP that the 1st extension is actually the 2nd day of a 2 Day interval VWAP and the 2nd extension is the 3rd day of a 3 Day interval VWAP .
Same goes for the other intervals eg.
1 Month VWAP =>
1st extension : 2nd Month of a 2 Month interval VWAP
2nd extension : 3rd Month of a 3 Month interval VWAP
2nd extensions are disabled by default as there is usually often overlap, however there can be notable exceptions (such as the current 2nd Monthly extension on BTCUSD )
--------------------------------------
If you find it useful please consider a tip/donation :
BTC - 3BMEXEDyWJ58eXUEALYPadbn1wwWKmf6sA
--------------------------------------

3 Zero Lag + 3 Moving Averages + 3 RVWAPThe "3 Zero Lag + 3 Moving Averages + 3 RVWAP" (ZMR) indicator combines three groups of tools for technical analysis.
1. Three Customizable Moving Averages (MAs):
Configuration for Each MA:
Choice of 7 types (SMA, EMA, WMA, HMA, VWMA, LSMA, SMMA).
Independent periods and price sources for each line.
Visualization:
MA1 (Blue), MA2 (Red), MA3 (Green).
2. Three Zero Lag EMAs (ZLEMA) with Individual Settings:
Lag Reduction: Corrects traditional EMA lag using:
Adjusted Price = 2 * Current Price - Price .
Flexibility:
Unique lengths (20, 50, 70) and individual price sources for each ZLEMA (HLC3, HL2, Close, etc.).
Colors:
ZLEMA1 (Yellow), ZLEMA2 (Orange), ZLEMA3 (Purple).
3. Three Rolling VWAPs with Custom Parameters:
Volume-Weighted Average Price (VWAP):
Calculated for three periods (20, 50, 100) with dedicated price sources for each VWAP.
Colors:
VWAP1 (Pink), VWAP2 (Light Blue), VWAP3 (Neon Green).
MVSF 6.0[ELPANO]The "MVSF 6.0 " indicator, which stands for Multi-Variable Strategy Framework, overlays on price charts to aid in trading decisions. It combines various moving averages and volume data to generate buy and sell signals based on predefined conditions.
Key features of the indicator include:
Moving Averages: It uses three exponential moving averages (EMAs) with lengths of 200, 100, and 50, and two simple moving averages (SMAs) with lengths of 14 and 9. These averages are combined into a single average line to detect trends.
Volume Analysis: The volume is assessed over a specified period (default is 2 bars) to determine its trend relative to its average, influencing the color and interpretation of signals.
Price Source and VWAP: Users can select the price (close, low, or high) used for calculations. The volume-weighted average price (VWAP) serves as a potential benchmark or condition in signal generation.
Signal Generation: Buy and sell signals are based on the relationship of the price to the average line and VWAP, the direction of the last candle, and the trend direction of the average line. These signals are visually represented on the chart.
Customization: Traders can toggle the visibility of signals, entry points, the average line, and even use these elements as conditions for filtering signals.
This script is designed to be flexible, allowing traders to modify settings according to their strategy needs. The description and implementation aim to provide clarity on how each component works together to assist in trading decisions, adhering to best practices for creating and publishing trading scripts.
*************************************
Der Indikator "MVSF 6.0 ", der für Multi-Variable Strategy Framework steht, wird über Preisdiagramme gelegt, um bei Handelsentscheidungen zu helfen. Er kombiniert verschiedene gleitende Durchschnitte und Volumendaten, um Kauf- und Verkaufssignale basierend auf vordefinierten Bedingungen zu generieren.
Wesentliche Merkmale des Indikators umfassen:
Gleitende Durchschnitte: Es werden drei exponentielle gleitende Durchschnitte (EMAs) mit Längen von 200, 100 und 50 sowie zwei einfache gleitende Durchschnitte (SMAs) mit Längen von 14 und 9 verwendet. Diese Durchschnitte werden zu einer einzelnen Durchschnittslinie kombiniert, um Trends zu erkennen.
Volumenanalyse: Das Volumen wird über einen festgelegten Zeitraum (standardmäßig 2 Balken) bewertet, um seinen Trend im Vergleich zum Durchschnitt zu bestimmen, was die Farbe und Interpretation der Signale beeinflusst.
Preisquelle und VWAP: Benutzer können den für Berechnungen verwendeten Preis (Schluss-, Tief- oder Hochkurs) auswählen. Der volumengewichtete Durchschnittspreis (VWAP) dient als mögliche Benchmark oder Bedingung bei der Generierung von Signalen.
Signalgenerierung: Kauf- und Verkaufssignale basieren auf dem Verhältnis des Preises zur Durchschnittslinie und zum VWAP, der Richtung der letzten Kerze und der Trendrichtung der Durchschnittslinie. Diese Signale werden visuell auf dem Diagramm dargestellt.
Anpassung: Händler können die Sichtbarkeit von Signalen, Einstiegspunkten, der Durchschnittslinie und sogar deren Verwendung als Bedingungen für die Filterung von Signalen ein- und ausschalten.
Dieses Skript ist so konzipiert, dass es flexibel ist und Händlern erlaubt, die Einstellungen gemäß ihren Strategiebedürfnissen zu modifizieren. Die Beschreibung und Implementierung zielen darauf ab, Klarheit darüber zu schaffen, wie jede Komponente zusammenarbeitet, um bei Handelsentscheidungen zu helfen, und halten sich an die besten Praktiken für die Erstellung und Veröffentlichung von Handelsskripten.

Smoothed SuperTrend with VWAP Confirmation [CHE] Smoothed SuperTrend with Automated Optimization and VWAP Confirmation
Overview
The "Smoothed SuperTrend with VWAP Confirmation" is an advanced technical analysis indicator designed for precise trend identification and trading signal generation. This script integrates a smoothed version of the popular SuperTrend indicator with an additional layer of confirmation using the Volume-Weighted Average Price (VWAP). The combination of these two elements offers traders a powerful tool for identifying optimal entry and exit points in the market.
Key Features
1. Smoothed SuperTrend
- Super Smoother Algorithm: The SuperTrend in this script is not just a regular one; it is enhanced by the Super Smoother filter, which reduces market noise and provides more reliable trend signals.
- Customizable Parameters: Traders can adjust three different sets of SuperTrend parameters (factor and ATR length), allowing them to tailor the indicator to their specific trading strategies.
- Automatic Optimization: The script automatically evaluates the performance of each SuperTrend parameter set and selects the one with the best cumulative performance. This selection process can be set to pick either the best or the worst performing parameter set, depending on the trader's preference.
2. VWAP Confirmation
- Precise Trend Confirmation: Once the best-performing SuperTrend is identified, the script further refines the signals by using VWAP as a confirmation tool. VWAP is a highly respected indicator in the trading community, often used to assess the true average price of an asset.
- Long and Short Signal Generation: The script generates Long and Short signals only when the price action is confirmed by both the SuperTrend and VWAP. For a Long signal, the price must be above the VWAP, and for a Short signal, it must be below the VWAP. This dual confirmation ensures higher accuracy and reduces the likelihood of false signals.
3. Visual and Informative Labels
- Signal Labels: Upon confirmation of a trend reversal by both the SuperTrend and VWAP, the script plots clear labels on the chart, indicating confirmed Long or Short signals. These labels are customizable in terms of color, text, and size, ensuring they fit seamlessly into any chart setup.
- Best Parameters Display: At the close of the most recent bar, the script displays a label that provides detailed information about the best-performing SuperTrend parameters and their cumulative performance. This feature keeps traders informed about which settings are currently most effective.
Input Customization Options
1. Super Smoother Length
- Traders can define the length of the Super Smoother filter, which is used to smooth both price data and ATR (Average True Range) values. This input allows traders to control the sensitivity of the indicator, with shorter lengths providing faster responses and longer lengths offering smoother trends.
2. SuperTrend Parameters
- Factor: For each of the three SuperTrends, traders can set a unique factor that determines the distance of the SuperTrend bands from the average price. A higher factor results in wider bands and fewer signals, while a lower factor results in narrower bands and more signals.
- ATR Length: Traders can also specify the length of the ATR used in each SuperTrend calculation. A longer ATR period captures broader market volatility, while a shorter period focuses on more immediate price movements.
3. Label Settings
- Label Colors: The script allows full customization of label colors for Long and Short signals, ensuring that they match the trader’s chart aesthetics.
- Label Text Colors and Sizes: Traders can adjust the text color and size of the labels for Long, Short, and information labels, allowing them to prioritize visibility and readability on their charts.
4. Performance Selection Mode
- Best or Worst Performer: This input allows traders to select whether the script should optimize for the best or worst performing SuperTrend parameter set. This flexibility is useful in different market conditions, where a trader might want to analyze either the strongest trend or focus on a contrarian strategy.
5. VWAP Calculation
- The script automatically recalculates the VWAP based on trend changes, ensuring that the confirmation signals are as accurate and relevant as possible to the current market context.
Important Note
This script is designed to provide more accurate trend signals and confirmations, but like all technical indicators, it should not be used in isolation. It is recommended to use this tool as part of a broader trading strategy, including proper risk management and consideration of fundamental market conditions.
Conclusion
The "Smoothed SuperTrend with VWAP Confirmation" script is an innovative trading tool that combines the strengths of the SuperTrend and VWAP indicators. By integrating smoothing techniques and automatic parameter optimization, this indicator provides traders with more accurate and reliable trend signals. The added confirmation by VWAP further enhances the precision of the entry and exit points, making it an excellent choice for traders looking to improve their technical analysis and trading outcomes. This tool is especially valuable for those who prefer customizable inputs and a systematic approach to trading, ensuring that the indicator adapts to various market conditions and individual trading styles.
Best regards
Chervolino

True Moving VWAPHaven't found any moving VWAPs that calculate correctly (were weighted by time rather than volume) - this is correctly weighted VWAP.

EMA and VWAP by Phil VoEMA and VWAP by Phil Vo
Description
This indicator combines two powerful technical analysis tools: Exponential Moving Averages (EMAs) and Volume Weighted Average Price (VWAP). Designed to assist traders in identifying trends and key price levels, this script overlays two customizable EMAs and a daily VWAP on your chart.
* EMA 1 (Blue): A fast-moving EMA with a default period of 9, ideal for short-term trend analysis.
* EMA 2 (Red): A slower EMA with a default period of 21, useful for confirming longer-term trends.
* VWAP (Yellow): The Volume Weighted Average Price, calculated using the typical price (HLC3) and volume, resetting daily. It serves as a dynamic support/resistance level and reflects the average price weighted by volume.
Features
* Customizable EMAs: Adjust the periods of both EMAs via the settings (minimum period: 1).
* Visual Clarity: Each line is plotted in a distinct color (Blue for EMA 1, Red for EMA 2, Yellow for VWAP) with a linewidth of 2 for easy identification.
* Daily VWAP: The VWAP resets at the start of each trading day, providing a reliable intraday reference point.
* Tooltips: Hover over the input settings to see descriptions of each EMA period.
How to Use
1. Add the indicator to your chart.
2. Customize the EMA periods in the settings if desired (defaults are 9 and 21).
3. Use the EMAs to spot trends:
* When EMA 1 crosses above EMA 2, it may signal a bullish trend.
* When EMA 1 crosses below EMA 2, it may indicate a bearish trend.
4. Use the VWAP as a dynamic support/resistance level:
* Prices above VWAP might suggest bullish momentum.
* Prices below VWAP might indicate bearish pressure.
Settings
* EMA 1 Length: Set the period for the fast EMA (default: 9).
* EMA 2 Length: Set the period for the slow EMA (default: 21).
Notes
* The VWAP resets daily by default, making it most suitable for intraday trading.
* This script is open-source under the Mozilla Public License 2.0, so feel free to study or modify it!
Author
Created by Phil Vo. Happy trading!
How to Add This to TradingView
When you publish the script:
1. Paste the description above into the "Description" field in the "Publish Script" dialog.
2. Set the title as "EMA and VWAP by Phil Vo".
3. Choose "Public" visibility and "Open" access to share it with the community.
4. Add tags like "EMA", "VWAP", "Moving Average", "Trend", and "Volume" to help users find it.
This description provides a clear explanation of the indicator’s purpose, usage instructions, and customization options, making it accessible and helpful for TradingView users. Let me know if you’d like to adjust anything!
EMA with VWAPThis indicator combines two popular technical analysis tools: the Exponential Moving Average (EMA) and the Volume Weighted Average Price (VWAP), into a single, powerful overlay on your chart. It allows you to analyze both trend direction using the EMA and institutional interest and fair value using the VWAP, all while saving valuable indicator slots on your TradingView layout.
Key Features:
- Exponential Moving Average (EMA):
- Calculates the EMA based on a user-defined Length and Source (e.g., close, open, hl2).
- Includes an optional Offset to shift the EMA line forward or backward on the chart.
- Offers a Smoothing Line feature, allowing you to further smooth the EMA using various moving average types (SMA, EMA, SMMA (RMA), WMA, VWMA) with a customizable Smoothing Length.
- EMA and Smoothing Line can be toggled on or off.
- EMA and Smoothing Line have independent offset capabilities.
Volume Weighted Average Price (VWAP):
-Calculates the VWAP, a crucial indicator that reflects the average price weighted by volume.
- Offers a wide range of Anchor Periods for resetting the VWAP calculation, including: Session, Week, Month, Quarter, Year, Decade, Century, Earnings, Dividends, and Splits.
- Includes an optional Offset to shift the VWAP line.
- Option to Hide VWAP on 1D or Above timeframes to focus on intraday analysis.
- Provides up to three customizable Standard Deviation Bands above and below the VWAP, visually representing volatility and potential support/resistance levels.
- Bands can be calculated using either "Standard Deviation" or "Percentage" methods.
- Bands can be turned on or off independently.
How to Use:
- EMA: Use the EMA to identify the overall trend direction. An upward-sloping EMA suggests an uptrend, while a downward-sloping EMA suggests a downtrend. The Smoothing Line can help confirm the EMA's trend.
- VWAP: The VWAP acts as a benchmark for the "fair" price of an asset during the selected anchor period. Prices above the VWAP may indicate bullish sentiment, while prices below may indicate bearish sentiment.
- Bands: The Standard Deviation Bands can help identify potential overbought and oversold conditions. Price reaching the upper bands might suggest overbought levels, while price reaching the lower bands might suggest oversold levels.
Customization:
- The indicator offers extensive customization through its settings:
- EMA Settings: Adjust the EMA length, source, offset, smoothing method, and smoothing length.
- VWAP Settings: Choose the VWAP anchor period, source, offset, and whether to hide it on daily or higher timeframes.
- VWAP Bands Settings: Control the visibility, multiplier, and calculation method for each of the three standard deviation bands.
Benefits:
- Consolidated Analysis: Combines two essential indicators into one, providing a comprehensive view of price action and volume.
- Saves Indicator Slots: Frees up valuable indicator slots on your TradingView chart.
- Highly Customizable: Offers a wide range of settings to tailor the indicator to your specific trading style and preferences.
- Visual Clarity: Clearly displays the EMA, VWAP, and optional bands on the chart, facilitating quick and easy analysis.
This combined EMA and VWAP indicator is a valuable tool for traders of all levels, offering a powerful and flexible way to analyze market trends and identify potential trading opportunities.
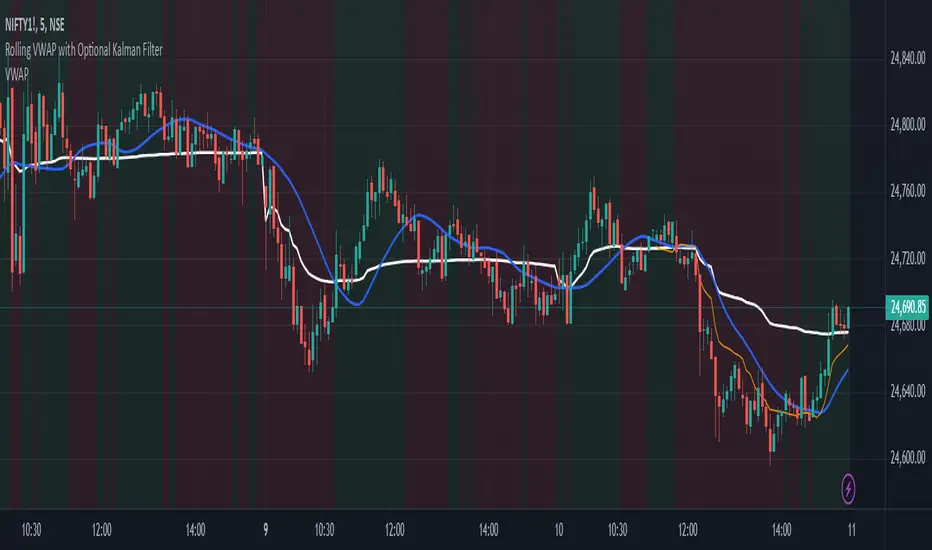
Rolling VWAP with Optional Kalman FilterThis script provides an advanced and customizable Rolling VWAP (Volume-Weighted Average Price) indicator, designed for traders who want to refine their trend analysis and improve decision-making. With a unique option to apply a Kalman Filter, you can smooth out VWAP values to reduce noise in volatile markets, making it easier to identify actionable trends.
Key Features:
Dynamic Rolling VWAP:
Choose the rolling window size (number of bars) to match your trading style, whether you’re an intraday scalper or a swing trader.
Kalman Filter Toggle:
Enable the Kalman filter to smooth VWAP values and eliminate market noise.
Adjustable Kalman Gain to control the level of smoothing, making it suitable for both fast and slow markets.
Price Source Flexibility:
Use the Typical Price ((H+L+C)/3) or the Close Price as the basis for VWAP calculation.
Visual Enhancements:
Background shading highlights whether the price is above (bullish) or below (bearish) the VWAP, helping traders make quick visual assessments.
A legend dynamically updates the current VWAP value.
Dual View Option:
Compare the raw Rolling VWAP and the Kalman-filtered VWAP when the filter is enabled, giving you deeper insight into market trends.
Use Cases:
Intraday Traders: Identify key price levels for re-entry or exits using a short rolling window and responsive filtering.
Swing Traders: Analyze broader trends with a longer rolling window and smoother VWAP output.
Volatile Markets: Use the Kalman filter to reduce noise and avoid false signals during high market volatility.
How to Use:
Adjust the Rolling Window to set the number of bars for VWAP calculation.
Toggle Kalman Filter on/off depending on your preference for raw or smoothed VWAP values.
Fine-tune the Kalman Gain for the desired level of smoothing.
Use the shading to quickly assess whether the price is trading above or below the VWAP for potential entry/exit signals.
Eze Profit - VWAP + MACD Combined SignalThe Eze Profit - VWAP + MACD Combined Signal is an advanced trading tool designed to help traders align price trends with momentum confirmation for better decision-making. By combining Volume-Weighted Average Price (VWAP) and Moving Average Convergence Divergence (MACD), this indicator provides clear entry and exit signals, allowing traders to follow trends and take advantage of momentum shifts.
How It Works:
VWAP:
VWAP represents the average price of an asset, weighted by volume, over a specific period.
It acts as a dynamic support/resistance level and trend filter. Price above VWAP indicates bullish conditions, while price below VWAP suggests bearish conditions.
MACD:
MACD measures momentum through the difference between fast and slow exponential moving averages (EMAs).
Signals are generated when the MACD line crosses its signal line:
Bullish Crossover: Indicates increasing upward momentum.
Bearish Crossunder: Indicates increasing downward momentum.
Combined Logic:
Long Signal: Triggered when price is above VWAP, and MACD exhibits a bullish crossover.
Short Signal: Triggered when price is below VWAP, and MACD exhibits a bearish crossunder.
The script tracks the trader's "in-position" state to prevent redundant signals and ensure clarity.
How to Use:
Use this script to identify potential long and short trading opportunities:
Buy Signal: Enter a long position when the price moves above VWAP and MACD confirms bullish momentum.
Sell Signal: Exit or short when the price drops below VWAP and MACD confirms bearish momentum.
Combine with additional tools like support/resistance, volume analysis, or candlestick patterns for confirmation.
Features:
VWAP Trend Filter: Dynamically adjusts to the trading session to identify overall trend direction.
MACD Momentum Confirmation: Detects key momentum shifts with configurable settings for fast, slow, and signal lengths.
Position State Tracking: Avoids signal redundancy by monitoring open positions.
Buy/Sell Visualizations: Plots Buy/Sell signals directly on the chart for ease of use.
Alerts: Notifies traders in real-time when a long or short signal is triggered.
Customizable Settings:
MACD Fast Length, Slow Length, and Signal Smoothing parameters.
VWAP timeframe resolution to adapt to different trading styles (e.g., intraday or daily).
Credits:
This script is based on standard VWAP and MACD calculations provided by TradingView’s library and has been enhanced with unique logic for combined signal generation.
Notes:
This indicator is intended for educational purposes and should not be considered financial advice. Use it as part of a broader trading strategy alongside other tools for optimal results.

TrendWave EMA/VWAP IndicatorThe TrendWave EMA/VWAP Indicator is a powerful technical analysis tool designed for traders seeking to enhance their market strategies. By combining the dynamic Exponential Moving Average (EMA) and the Volume Weighted Average Price (VWAP), this indicator provides valuable insights into price trends and potential trading signals, allowing for informed decision-making in various market conditions.
Key Features:
Exponential Moving Average (EMA):
The EMA component helps traders identify the direction of the prevailing trend by giving more weight to recent price action. This responsiveness makes the EMA an essential tool for trend-following strategies.
Customizable Length: Users can adjust the EMA length (default set to 50 periods) to align with their specific trading style and preferences.
Volume Weighted Average Price (VWAP):
The VWAP is crucial for evaluating the average price of a security throughout the trading day, factoring in volume. It serves as a benchmark for price action and can help traders identify significant support and resistance levels.
Real-time Benchmarking: The VWAP enables traders to assess current prices against historical averages, improving their entry and exit strategies.
Signal Generation:
The TrendWave EMA/VWAP Indicator generates clear buy and sell signals based on the interaction between the price and the VWAP:
Bullish Signal: Triggered when the price crosses above the VWAP, indicating a potential upward movement.
Bearish Signal: Triggered when the price crosses below the VWAP, suggesting a potential downward movement.
These signals are visually represented with intuitive arrows on the chart, facilitating quick recognition of trading opportunities.
User-Friendly Interface:
The indicator allows traders to enable or disable components (EMA and VWAP) based on their preferences, ensuring a personalized trading experience.
Clear color coding enhances visual clarity: the EMA is displayed in blue, while the VWAP is shown in orange.
Use Cases:
Trend Following: Use the EMA to confirm the direction of the trend and make trades that align with that trend.
Price Action Analysis: Employ the VWAP to determine the average trading price and identify key support/resistance levels.
Signal Confirmation: Combine signals from both the EMA and VWAP to enhance trading strategies and decision-making.
The TrendWave EMA/VWAP Indicator is an essential addition to any trader's toolkit. By leveraging the strengths of both the EMA and VWAP, this indicator empowers traders to make informed, data-driven decisions and capitalize on market movements with confidence.
