OG Volume PowerDescription:
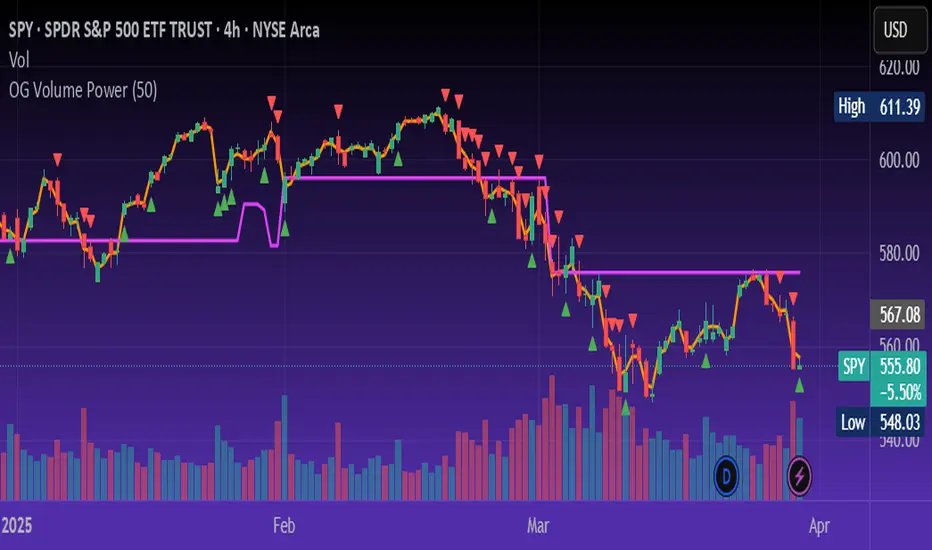
The OG Volume Power is an elite-level volume analysis suite built for identifying momentum surges, trend continuation, and buyer/seller imbalances at critical price levels. It combines real-time VWAP tracking, a dynamic Point of Control (POC), and volume delta clusters to give traders a complete picture of price and volume interaction.
🔍 Key Features:
Real-Time VWAP:
Tracks volume-weighted average price to identify mean reversion and intraday fair value zones. Ideal for institutional-level entries and exits.
Dynamic POC (Point of Control):
Automatically finds the price level with the highest volume over the last N candles (default 50), helping traders pinpoint where market participants are most committed.
Buyer/Seller Volume Delta Clusters:
Highlights imbalances between buying and selling pressure using bullish and bearish volume deltas that exceed the 20-bar volume average — excellent for momentum detection and early trend recognition.
⚙️ How It Works:
Green triangle: Buyer surge (bullish delta + above average volume)
Red triangle: Seller surge (bearish delta + above average volume)
Magenta line: Dynamic POC (highest volume price over recent candles)
Orange line: VWAP (acts as a magnetic force for price)
📈 Best For:
Intraday scalping or swing trading on SPY, QQQ, BTC, or Forex
Volume flow confirmation before breakout entries
Filtering false breakouts with delta strength signals
🧠 Pro Tip:
Use OG Volume Power alongside your trend indicators (like OG EMA Stack or OG Supertrend) to confirm that volume is backing the move. Look for surges near VWAP or POC zones for sniper-level entries.
Komut dosyalarını "vwap" için ara
Optimus trader Optimus Trader
Indicator Description:
The Optimus Trader indicator is designed for technical traders looking for entry and exit points in financial markets. It combines signals based on volume, moving averages, VWAP (Volume Weighted Average Price), as well as the recognition of candlestick patterns such as Pin Bar and Inside Bars. This indicator helps identify opportune moments to buy or sell based on trends, volumes, and recent liquidity zones.
Parameters and Features:
1. Simple Moving Average (MA) and VWAP:
- Optimus Trader uses a 50-period simple moving average to determine the underlying trend. It also includes VWAP for precise price analysis based on traded volumes.
- These two indicators help identify whether the market is in an uptrend or downtrend, enhancing the reliability of buy and sell signals.
2. Volume :
- To avoid false signals, a volume threshold is set using a 20-period moving average, adjusted to 1.2 times the average volume. This filters signals by considering only high-volume periods, indicating heightened market interest.
3. Candlestick Pattern Recognition:
- Pin Bar: This sought-after candlestick pattern is detected for both bullish and bearish setups. A bullish or bearish *Pin Bar* often signals a possible reversal or continuation.
- *Inside Bar*: This price compression pattern is also detected, indicating a zone of indecision before a potential movement.
4. Trend:
- An uptrend is confirmed when the price is above the MA and VWAP, while a downtrend is identified when the price is below both indicators.
5. Liquidity Zones:
- Optimus Trader includes an approximate liquidity zone detection feature. By identifying recent support and resistance levels, the indicator detects if the price is near these zones. This feature strengthens the relevance of buy or sell signals.
6. Buy and Sell Signals:
- Buy: A buy signal is generated when the indicator detects a bullish *Pin Bar* or *Inside Bar* in an uptrend with high volume, and the price is close to a liquidity zone.
- Sell: A sell signal is generated when a bearish *Pin Bar* or *Inside Bar* is detected in a downtrend with high volume, and the price is near a liquidity zone.
Signal Display:
The signals are visible directly on the chart:
- A "BUY" label in green is displayed below the bar for buy signals.
- A "SELL" label in red is displayed above the bar for sell signals.
Summary:
This indicator is intended for traders seeking precise entry and exit points by integrating trend analysis, volume, and candlestick patterns. With liquidity zones, *Optimus Trader* helps minimize false signals, providing clear and accurate alerts.
---
This description can be directly added to TradingView to help users quickly understand the features and logic of this indicator.

Elite By Ashu4750Inside Bar Detection:
The script identifies inside bars, which are candles where the high is lower and the low is higher than the previous bar. It tracks the high and low of the mother candle (the candle preceding the inside bars) and plots the ranges on the chart using lines and labels.
Exponential Moving Averages (EMA):
Three EMAs are calculated and plotted (with default periods of 9, 21, and 50). This is a classic trend-following technique used to smooth price data and identify the direction of the market.
Bollinger Bands (BB):
The script includes a Bollinger Band calculation using the simple moving average (SMA) with a standard deviation multiplier. The bands help visualize volatility and potential overbought or oversold conditions.
The user can configure settings like the length of the SMA and the multiplier for the upper and lower bands.
Volume Weighted Average Price (VWAP):
The VWAP is plotted on the chart and reset based on user-defined timeframes (e.g., session, week, month). VWAP is a popular indicator for institutional trading, as it shows the average price weighted by volume and can act as support or resistance.
Crossover Signals (Buy/Sell):
A combination of crossovers between VWAP, EMAs, and Bollinger Bands triggers buy and sell signals. Specifically:
Buy signal is generated when VWAP crosses over the 9 EMA, the close crosses over the Bollinger Band line, and VWAP crosses over the Bollinger Band.
Sell signal is triggered when VWAP crosses under the 9 EMA, and similar conditions exist for the other indicators.
These signals are plotted with a green "Buy" or red "Sell" marker below the bars, and alerts are set up for both buying and selling.
Additional Bollinger Band Configuration:
The script provides more flexibility in Bollinger Bands by allowing the user to select between SMA, EMA, or SMMA for the moving average.
The user can also choose the standard deviation multiplier and whether to display the bands.
Alerts:
Buy and sell conditions are linked to alert conditions, allowing the user to be notified when a signal is triggered, based on the defined crossover logic.
Technical Breakdown:
Inside Bar Logic: Tracks inside bars and plots lines representing the high and low of the mother candle. The line and label functions are used to draw these on the chart, which provides a visual representation of the range.
EMA and VWAP Crossovers:
The 9, 21, and 50-period EMAs are calculated and used in crossover logic with VWAP. Crossovers between VWAP and EMAs are a common method for identifying potential trend changes.
Bollinger Bands:
The Bollinger Band component allows for volatility analysis by calculating the upper and lower bands based on the moving average's standard deviation.
Alert System:
Alerts are set for crossover signals, allowing for real-time notifications of potential buy and sell opportunities.
Visualization:
The script plots the EMAs, VWAP, and Bollinger Bands on the price chart. It highlights inside bar patterns and displays buy/sell markers on the chart when the specified conditions are met. These visual cues make it easier to follow the market’s movements and spot trading opportunities.
Customizability:
The script is highly customizable with inputs for:
EMA periods.
VWAP settings.
Bollinger Band parameters (moving average type, length, standard deviation).
Candle color options for inside bars.
In this traders looking for multiple indicators to analyze market trends, volatility, and price action.

Smart Market Matrix Smart Market Matrix
This indicator is designed for intraday, scalping, providing automated detection of price pivots, liquidity traps, and breakout confirmations, along with a context dashboard featuring volatility, trend, and volume.
## Summary Description
### Menu Settings & Their Roles
- **Swing Pivot Strength**: Controls the sensitivity for detecting High/Low pivots.
- **Show Pivot Points**: Toggles the display of HH/LL markers on the chart.
- **VWMA Length for Trap Volume** & **Volume Spike Multiplier**: Identify concentrated volume spikes for liquidity traps.
- **Wick Ratio Threshold** & **Max Body Size Ratio**: Detect candles with disproportionate wicks and small bodies (doji-ish) for traps.
- **ATR Length for Trap**: Measures volatility specific to trap detection.
- **VWMA Length for Breakout Volume**, **ATR Multiplier for Breakout**, **ATR Length for Breakout**, **Min Body/Range Ratio**: Set adaptive breakout thresholds based on volatility and volume.
- **OBV Smooth Length**: Smooths OBV momentum for breakout confirmation.
- **Enable VWAP Filter for Confirmations**: Optionally validate breakouts against the VWAP.
- **Enable Higher-TF Trend Filter** & **Trend Filter Timeframe**: Align breakout signals with the 1h/4h/Daily trend.
- **ADX Length**, **EMA Fast/Slow Length for Context**: Parameters for the context dashboard (Volatility, Trend, Volume).
- **Show Intraday VWAP Line**, **VWAP Line Color/Width**: Display the intraday VWAP line with custom style.
### Signal Interpretation Map
| Signal | Description | Recommended Action |
|--------------------------------|-----------------------------------------------------------|-------------------------------------------|
| 📌 **HH / LL (pivot)** | Market structure (support/resistance) | Note key levels |
| **Bull Trap(green diamond)** | Sweep down + volume spike + wick + rejection | Go long with trend filter
| **Bear Trap(red diamond)** | Sweep up + volume spike + wick + rejection | Go short with trend filter
| 🔵⬆️ **Breakout Confirmed Up** | Close > ATR‑scaled high + volume + OBV↑ | Go long with trend filter |
| 🔵⬇️ **Breakout Confirmed Down** | Close < ATR‑scaled low + volume + OBV↓ | Go short with trend filter |
| 📊 **VWAP Line** | Intraday reference to guide price | Use as dynamic support/resistance |
| ⚡ **Volatility** | ATR ratio High/Med/Low | Adjust position size |
| 📈 **Trend Context** | ADX+EMA Strong/Moderate/Weak | Confirm trend direction |
| 🔍 **Volume Context** | Breakout / Rising / Falling / Calm | Check volume momentum |
*This summary gives you a quick overview of the key settings and how to interpret signals for efficient intraday scalping.*
### Suggested Settings
- **Intraday Scalping (5m–15m)**
- `Swing Pivot Strength = 5`
- `VWMA Length for Trap Volume = 10`, `Volume Spike Multiplier = 1.6`
- `ATR Length for Trap = 7`
- `VWMA Length for Breakout Volume = 12`, `ATR Length for Breakout = 9`, `ATR Multiplier for Breakout = 0.5`
- `Min Body/Range Ratio for Breakout = 0.5`, `OBV Smooth Length = 7`
- `Enable Higher-TF Trend Filter = true` (TF = 60)
- `Show Intraday VWAP Line = true` (Color = orange, Width = 2)
- **Swing Trading (4h–Daily)**
- `Swing Pivot Strength = 10`
- `VWMA Length for Trap Volume = 20`, `Volume Spike Multiplier = 2.0`
- `ATR Length for Trap = 14`
- `VWMA Length for Breakout Volume = 30`, `ATR Length for Breakout = 14`, `ATR Multiplier for Breakout = 0.8`
- `Min Body/Range Ratio for Breakout = 0.7`, `OBV Smooth Length = 14`
- `Enable Higher-TF Trend Filter = true` (TF = D)
- `Show Intraday VWAP Line = false`
*Adjust these values based on the symbol and market volatility for optimal performance.*

Daily Directional Bias Indicator (S&P 500)This indicator is designed to help you be on the right side of the trade.
Most traders who struggle to know which way price may move are only looking at part of the picture. This Directional Bias Indicator uses both the Accumulation/Distribution Line and VIX for directional confirmation.
The Accumulation/Distribution Line
The Accumulation/Distribution (ACC) line helps us gauge market momentum by showing the cumulative flow of money into or out of an asset. When the ACC line is rising, it suggests that buying pressure is dominating, indicating a bullish market. Conversely, when the ACC line is falling, it suggests that selling pressure is stronger, indicating a bearish market. By comparing the ACC line with the VWAP, traders can see if the price is moving in line with the overall market sentiment. If the ACC line is above the VWAP, it suggests the market is in a bullish phase; if it's below, it indicates a bearish phase.
The VIX
The VIX (Volatility Index) is often referred to as the "fear gauge" of the market. When the VIX is rising, it typically signals increased market fear and higher volatility, which can be a sign of bearish market conditions. Conversely, when the VIX is falling, it suggests lower volatility and a more stable, bullish market. Using the VIX with the VWAP helps us confirm market direction, particularly in relation to the S&P 500.
VWAP
For both the ACC Line and VIX, we use a VWAP line to gauge whether the ACC line or the VIX is above or below the average. When the ACC line is above the VWAP, we view it as a sign that price will go up. However, because the VIX has an inverse relationship, when the VIX falls below the VWAP, we take that as a sign to go long.
How to use
The yellow line represents the ACC Line.
The red line represents the VWAP based on the ACC line.
The triangles at the bottom simply show when the ACC line is above or below the VWAP.
The triangles at the top show whether the VIX is bullish or bearish.
If both triangles (top or bottom) are bullish, this confirms that the price of an asset like the S&P 500 will likely go up. If both triangles are pointing down, it suggests that price will fall.
As always, test for yourself.
Happy trading!

Supertrend (Buy/Sell) With TP & SLSupertrend (Buy/Sell) with TP & SL: An Enhanced Trading Tool
This Pine Script indicator combines the popular Supertrend indicator with multiple take-profit (TP) and stop-loss (SL) levels, providing traders with a comprehensive visual aid for potential entries, exits, and risk management.
Originality
Buffer Zones for Precision: Instead of relying solely on the Supertrend line, this script incorporates buffer zones around it. This helps filter out false signals, especially in volatile markets, leading to more accurate buy/sell signals.
Flexible Stop-Loss: Offers the choice between a fixed or trailing stop-loss, allowing traders to tailor their risk management approach based on their preferences and market conditions.
Multiple Take-Profit Levels: Provides three potential take-profit levels, giving traders the flexibility to secure profits at different stages of a trend.
Heikin Ashi Candles & VWAP: Incorporates Heikin Ashi candles for smoother trend visualization and adds a VWAP line for potential support/resistance levels.
Clear Table Display: Presents key information like Stop Loss and Take Profit levels in a user-friendly table, making it easier to track trade targets.
How It Works
Supertrend Calculation: The Supertrend is calculated using ATR (Average True Range) to gauge market volatility. The script then creates buffer zones around the Supertrend line for refined signal generation.
Buy/Sell Signals:
Buy: When the close price crosses above the upper buffer zone, indicating a potential uptrend.
Sell: When the close price crosses below the lower buffer zone, suggesting a potential downtrend.
Take Profit & Stop Loss:
Take Profits: Three TP levels are calculated based on ATR and a customizable profit factor.
Stop Loss: The stop-loss can be set as either a fixed value based on ATR or as a trailing stop-loss that dynamically adjusts to lock in profits.
How To Use
Add the Indicator: Search for "Supertrend (Buy/Sell) With TP & SL" in the TradingView indicators list and add it to your chart.
Customize Inputs: Adjust parameters like ATR Period, Factor, Take Profit Factor, Stop Loss Factor, Stop Loss Type, etc., based on your trading style and preferences.
Interpret Signals: Look for buy signals when the price crosses above the upper buffer and sell signals when it crosses below the lower buffer.
Manage Risk: Use the plotted Take Profit and Stop Loss levels to manage your risk and potential rewards.
Concepts
Supertrend: A trend-following indicator that helps identify the direction of the prevailing trend.
ATR (Average True Range): A measure of market volatility.
Buffer Zones: Used to filter out false signals by creating a zone around the Supertrend line.
Trailing Stop Loss: A dynamic stop-loss that moves with the price to protect profits.
Heikin Ashi: A type of candlestick chart designed to filter out market noise and make trends easier to identify.
VWAP (Volume Weighted Average Price): An indicator that shows the average price at which a security has traded throughout the day, based on both volume and price.
Important Note: This script is for educational and informational purposes only. Backtest thoroughly and use with caution in live trading. Always manage your risk appropriately.

[blackcat] L2 Gradient RSIVWAPOVERVIEW
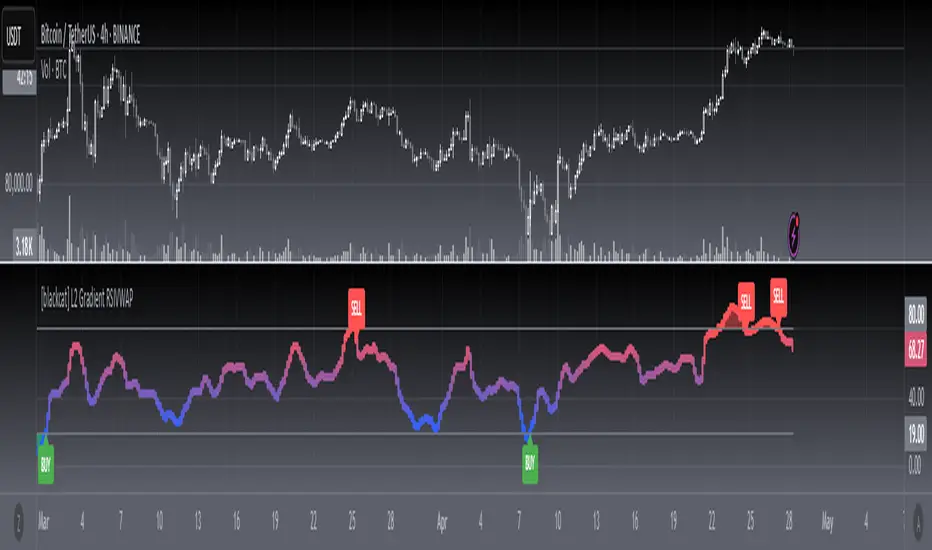
The L2 Gradient RSIVWAP indicator offers traders a powerful tool for assessing market conditions by combining Relative Strength Index (RSI) with Volume Weighted Average Price (VWAP). It features dynamic coloring and clear buy/sell signals to enhance decision-making.
Customizable Inputs: Adjust key parameters such as RSI-VWAP length, oversold/overbought levels, and smoothing period.
Gradient Color Visualization: Provides intuitive gradient coloring to represent RSI-VWAP values.
Buy/Sell Indicators: On-chart labels highlight potential buying and selling opportunities.
Transparent Fills: Visually distinguishes overbought and oversold zones without obscuring other data.
Access the TradingView platform and select the chart where you wish to implement the indicator.
Go to “Indicators” in the toolbar and search for “ L2 Gradient RSIVWAP.”
Click “Add to Chart” to integrate the indicator into your chart.
Customize settings via the input options:
Toggle between standard RSI and RSI-based VWAP.
Set preferred lengths and thresholds for RSI-VWAP calculations.
Configure the smoothing period for ALMA.
Performance can vary based on asset characteristics like liquidity and volatility.
Historical backtests do not predict future market behavior accurately.
The ALMA function, developed by Arnaud Legoux, enhances response times relative to simple moving averages.
Buy and sell signals are derived from RSI-VWAP crossovers; consider additional factors before making trades.
Special thanks to Arnaud Legoux for creating the ALMA function.
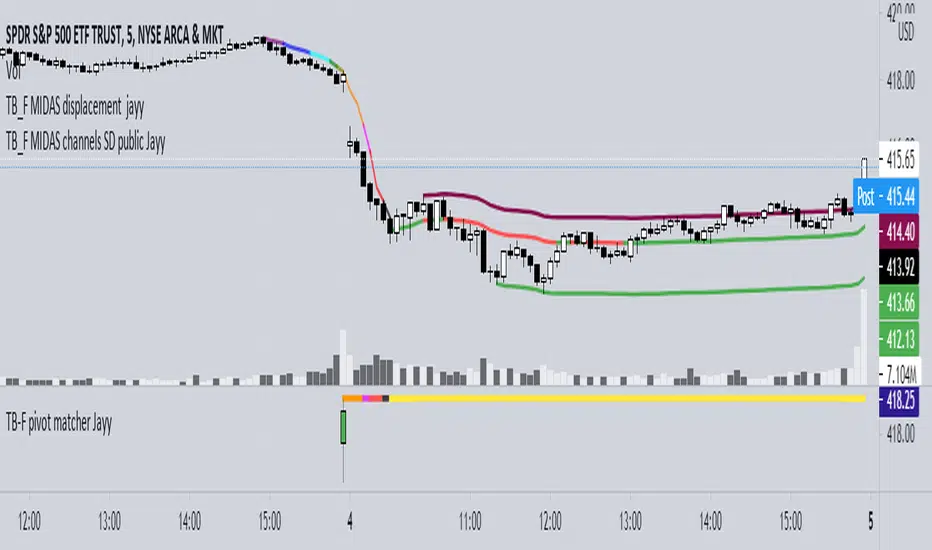
Top Bottom Finder Public version- Jayy This script plots a 6 algos from the Coles/Hawkins "Midas Technical Analysis" book:
Top finder / Bottom Finder (Levine Algo by Bob English)* - onlinelibrary.wiley.com
MIDAS VWAP Gen-1) -
MIDAS VWAP average and deltas
VWAP (Gen-1) using a date or a bar n number can be initiated at bar 0 - useful for a new IPO
Standard Deviation of MIDAS VWAP
MIDAS Displacement Channels (Coles) - edmond.mires.co
An%20Anchored%20VWAP%20Channel%20For%20Congested%20Markets.pdf
* for better results with topfinder and bottomfinder use the companion TB-F Matcher script.
See wiki for a synopsis: en.wikipedia.org
Relevant info can be found in: Midas Technical Analysis: A VWAP Approach to Trading and Investing in Today’s Markets by
Andrew Coles, David G. Hawkins Copyright © 2011 by Andrew Coles and David G. Hawkins.
Appendix C: TradeStation Code for the MIDAS Topfinder/Bottomfinder Curves ported to Tradingview
This script requires a working understanding of "Midas Technical Analysis" Google "Midas Technical Analysis" and a variety of information will appear.
To find fit the curve as described in the Midas book a companion script is required that will after a few manual iterative inputs guide you to the appropriate D value for the for input into this program ( see the TB-F Matcher script). You might also try the Midas average and Deltas as described in the book. I have added the 2nd, 3rd and 4th multiples of Delta.
The advantage is that there is no curve fitting. You still need to select a starting point for Midas or the topfinder bottomfinder (TB_F)
or the VWAP.
////////////////////////////////////////////////////////////////////////////////////////////////////////////////////////////
See the notes in the script below
Cheers Jayy
Snipe 1-Minute IntradayPurpose
This script demonstrates a simple intraday approach using RSI, EMAs, VWAP, and an optional volume filter. It plots visual buy (bullish) and sell (bearish) signals on the chart under certain conditions. You can use it as a starting point to explore or develop your own intraday strategies.
Key Features
1. VWAP (Volume Weighted Average Price)
Plots the built-in VWAP for additional context on intraday price action.
2. EMA Crossover
Uses two EMAs (fast and slow). A bullish signal triggers when the fast EMA is above the slow EMA, and a bearish signal triggers when the fast EMA is below the slow EMA.
3. RSI Momentum Filter
An RSI reading above 50 indicates bullish momentum; below 50 indicates bearish momentum.
4. Volume Filter (Optional)
Compares the current bar’s volume against the average volume (over a user-defined period). When enabled, signals only appear if the current volume exceeds the average.
5. Time Window (Optional)
Allows you to define a specific time window (e.g., the first hour of trading) for valid signals. You can enable or disable this filter and set your preferred time zone.
How the Signals Are Generated
• Bullish Signal
o Occurs when:
1. Price is above VWAP.
2. Fast EMA is above Slow EMA.
3. RSI is above 50.
4. (Optional) Current volume exceeds the average volume if the volume filter is enabled.
5. (Optional) The chart’s timestamp is within the specified session if the time filter is enabled.
A green triangle is plotted below the bar, and an optional background highlight is shown.
• Bearish Signal
Occurs when the conditions are inverted (price below VWAP, fast EMA below slow EMA, RSI below 50, volume filter and time window—if enabled—are satisfied).
A red triangle is plotted above the bar, and an optional background highlight is shown.
How to Use
1. Load on a 1-Minute Chart (Recommended)
This script is intended for intraday timeframes (specifically 1-minute). Feel free to experiment with other timeframes.
2. Adjust Inputs
You can modify the RSI length, EMA lengths, and volume lookback to suit your preferences or trading style.
If you prefer signals outside the default session hours, turn off “Use Time Filter for Signals?” or change the session window and time zone.
3. Enable or Disable Volume Filter
Turn this on if you only want signals during higher-than-average volume bars.
4. Combine with Other Analysis
This script can be used as a visual tool; however, it is not a complete trading system by itself. Consider additional technical or fundamental analysis to validate your trading decisions.
5. Risk Management
Always practice sound risk management. Setting appropriate stop-losses or using position sizing techniques can help manage potential losses.
Important Notes and Disclaimers
• Educational Only: This script is for demonstration and educational purposes and does not guarantee future results.
• No Financial Advice: Nothing here should be construed as financial or investment advice. Always do your own research and consider consulting a qualified financial professional.
• Test Before Using Live: If you plan to incorporate this script into a strategy, backtest it on historical data and consider forward-testing on a demo account.
• License: This code is subject to the Mozilla Public License 2.0.

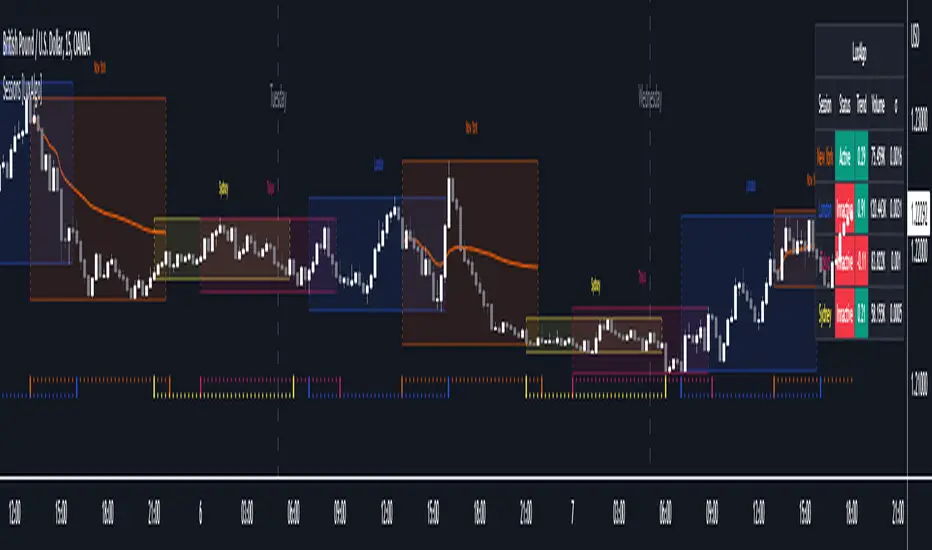
Sessions [LuxAlgo]This indicator shows when user set sessions are active and returns various tools + metrics using the closing price within active sessions as an input. Users have the option to change up to 4 session times.
The indicator will increasingly lack accuracy when the chart timeframe is higher than 1 hour.
Settings
Sessions
Enable Session: Allows to enable or disable all associated elements with a specific user set session.
Session Time: Opening and closing times of the user set session in the hh:mm format.
Range: Highlights the associated session range on the chart.
Trendline: Returns the associated session trendline on the chart.
Mean: Returns the associated session mean average on the chart.
VWAP: Returns the associated session volume weighted average price on the chart.
Ranges Settings
Range Area Transparency: Transparency of the area highlighting sessions ranges.
Range Outline: Highlights the borders of the session range area.
Range Label: Shows the session label at the mid-point of the session interval.
Dashboard
Show Dashboard: Enables sessions dashboard on the chart.
Advanced Dashboard: Returns more information regarding user set sessions on the dashboard.
Dividers
Show Session Divider: Highlights active sessions using intervals on the bottom of the chart (this can lead to less responsive charts)
Show Daily Divider: Highlights days on the chart.
Usage
This tool is versatile and allows the user to perform a wide variety of tasks all focusing on highlighting and analyzing price movements within a specific user set session in a periodic fashion.
Significant forex trading sessions are used by default, but the users are free to choose the opening and closing time of their choices.
Using ranges can indicate which sessions returned the most volatile price movements.
Trendlines can be useful to estimate the underlying trend of a specific session, but they can also offer a quick way to see which session started a trend reversal.
The session Mean highlights the equilibrium level within a session, extrapolating these levels can provide potential support and resistances levels of interest.
Finally, users can use the sessions VWAP's for real time applications, using them as trailing supports and resistances.
Using The Advanced Dashboard
The advanced dashboard returns useful information regarding the user set sessions. Each dashboard elements are described below:
Status: Highlights whether the user set session is active (open) of inactive (closed).
Trend: Shows correlation coefficient between the session prices and a linear sequence of values. Values above 0 indicates an up-trending session, while values under 0 indicates a down-trending session. Values closer to (1, -1) indicates a more trending session.
Volume: Shows accumulated volume within the session
σ (Standard Deviation): Shows standard deviation of the session, while this value is not bounded it can be useful to compare it with the other ones to see which session was the most volatile.
Note that when a session becomes inactive the value on the dashboard will hold until the specific session becomes active again.
Previous Day ValuesSay hello to the Previous Day Values Indicator, your new best friend in the world of trading. This script, written in the powerful Pine Script version 5, is designed to keep you informed about essential price levels from the previous day's trading session, right on your TradingView chart.
Here's how it works:
The script creates horizontal lines on your chart to represent the previous day's high, low, close, and VWAP (Volume Weighted Average Price) levels. Each level is color-coded for easy identification – red for the high, green for the low, blue for the close, and yellow for the VWAP. The lines extend to the right edge of the chart, allowing you to gauge where the current price stands in relation to these crucial levels.
But what makes this script unique is its ability to update dynamically with each new trading day. At the start of a new day, the script clears the lines from the previous day and draws new ones based on the latest data. It uses the request.security function to fetch the previous day's data for the current symbol, so you can rest assured that your information is always up-to-date.
There's also an added layer of customization built into this script. We understand that different traders might want to focus on different things, which is why we've included toggle options for each value. You can choose whether to display the previous day's high, low, close, or VWAP values, or any combination thereof. Just head to the settings and switch on/off the values you want to see.
The labels for these lines are placed further to the right of the screen for easy reading, without cluttering your chart. And if you're worried about distinguishing between them, don't be! Each label is color-matched to its corresponding line, so you'll know at a glance which is which.
In summary, the Previous Day Values Indicator is a versatile tool that can help you keep track of key price levels from the past trading day. Whether you're a seasoned trader or a beginner, this script is sure to be a valuable addition to your toolkit. Happy Trading!

[DisDev] D-I-Y Gridbot🟩 This script is a “do-it-yourself” Grid Bot Simulator, used for visualizing support and resistance levels. Prices are divided into grids, or trade zones, that will trigger signals each time a new zone is entered. During ranging markets, each transaction is followed by a “take profit.” As the market starts to trend, transactions are stacked (compare to DCA ), until the market consolidates. No signals are triggered above the upper gridline or below the lower gridline. Unlike the previous version, all grids may be adjusted in real-time by dragging the gridlines up and down to the desired support and resistance levels.
When adding the indicator to a new chart, you must choose six grid levels by clicking on the desired support or resistance price. You can change all of these levels at any time directly on the chart.
⚡ OVERVIEW ⚡
The D-I-Y Gridbot is an interactive tool designed for visualizing support and resistance levels. As a continuation of the original Gridbot Simulator , which has received significant recognition on TradingView, earning over 4000 boosts and an Editor's Pick status. This tool serves not only as an evolved version of its predecessor, but also as an open-source template for developing future gridbots. It aims to foster discussions and facilitate innovations around grid-trading strategies.
One of the new features of this gridbot is the real-time adjustability of all gridlines. Users can move these lines up and down to set their desired support and resistance levels in response to changing market conditions. Additionally, the D-I-Y Gridbot is compatible with multiple timeframes and can be used on most TradingView charts.
Drag gridlines up or down to desired price level.
Key Features 🔑
All gridlines are adjustable in real-time, directly on the chart
Signals can be filtered by a customizable moving average or by VWAP
Customizable support and resistance levels
Potentially increases profitability in ranging markets
Benefits 💸
Customizable Support and Resistance Levels : The D-I-Y Gridbot allows users to set their preferred support and resistance levels, which can be changed at any time directly on the chart. This provides users with the ability to customize their trading parameters based on their strategy and risk tolerance.
Various Trading Strategies : The D-I-Y Gridbot supports various trading strategies, including Mean Reversion, Ranging Markets, and Dollar-cost averaging (DCA). This allows users to capitalize on price reversals, execute buy and sell orders at predetermined levels, and buy more of an asset as the price falls, respectively.
Multi-Timeframe and Versatility : The D-I-Y Gridbot is compatible with multiple timeframes and can be used on any TradingView chart.
Experimental and Educational : The D-I-Y Gridbot is considered a proof-of-concept tool that is both experimental and educational. This can provide traders with a deeper understanding of grid trading strategies and the ability to experiment with different trading parameters and strategies.
⚙️ CONFIGURATION & SETTINGS ⚙️
Inputs 🔧
Trigger : Candle location to trigger the signal. "Wick" will use either high or low, depending on the signal direction. "Close" will use the close price. “MA” will use the selected moving average or VWAP.
Confirmation : Market direction to confirm the candle trigger. "Reverse" will confirm the signal when the price crosses back over the trigger. "Breakout" will confirm when the price breaks out of the trigger.
Number of Support/Resistance zones : 1 = Only Top Grid is Support/Only Bottom Grid is Resistance. 2 = Top two grids are Resistance/Bottom two grids are Support. 3 = Top three grids are Resistance/Bottom three grids are Support
MA Type : Exponential Moving Average (EMA), Hull Moving Average (HMA), Simple Moving Average (SMA), Triple Exponential Moving Average (TEMA), Volume Weighted Moving Average (VWMA), Volume Weighted Average Price (VWAP)
MA Filter : Use Moving Average as a reversion filter for signals. When enabled, no buys when above MA, no sells when below. Use in conjunction with S/R zones to reduce false signals.
Allow Repeat Signals . When enabled, signals will reset when nearest gridline is triggered. When disabled, only one signal will be triggered per gridline.
Line/Fill colors
Gridlines . Adjusts gridline prices manually.
Left : Trigger = Wick. Confirm = Breakout. Buys are signaled when LOW breaks below gridline. Sells are triggered when HIGH breaks above gridline.
Right : Trigger = Close. Confirm = Breakout. Buys are signaled when the candle CLOSES below the gridline. Sells are triggered when the candle CLOSES above the gridline.
Left : Confirm=Breakout. Signals on breaking through the next gridline.
Right : Confirm=Reverse. Signals only when crossing back from the gridline.
S/R Zones=1. Upper gridline is Resistance / Lower is Support. Middle 4 are neutral.
S/R Zones = 3. Upper three gridlines are Resistance / Lower three are Support
Notes:
If gridlines are dragged out of order on a live chart, they will auto-sort into the correct order.
Price levels may be entered in settings, or adjusted in real-time directly on the chart.
When changing symbols, remember to adjust the gridlines to accommodate the new symbol.
Alerts 🔔
Users can set alerts based on their chosen parameters for triggers, confirmations, number of support/resistance zones, and smoothing type, enabling precise control over alert conditions.
💡 USAGE & STRATEGY 💡
Trading Strategies 📈
Mean Reversion: The script can be used to capitalize on price reversals back to the mean.
Ranging Markets: The script excels in ranging markets, executing buy and sell orders at predetermined levels.
Dollar-cost averaging (DCA): The script can be used to execute DCA orders, buying more of an asset as the price falls, and lowering the average cost per unit.
Timeframes and Symbols ⌚
Multi-Timeframe: The indicator is compatible with multiple timeframes.
Versatile: Can be used on any crypto trading pair on TradingView.
🤖 DETAILS & METHODOLOGY 🤖
Algorithm and Calculation 🛡️
Grids are set and adjusted when loading the indicator on the chart and may be customized anytime afterward by clicking and dragging the gridlines on the chart.
Gridlines are updated, sorted, and stored in a float array.
Signals are calculated based on candle trigger, market direction, and previous price level.
📚 ADDITIONAL RESOURCES 📚
Chart Examples 📊
S/R Zones = 3: Three Support and Three Resistance. Filter = 50-period Triple Exponential Moving Average (TEMA)
S/R Zones = 1: One Support, One Resistance, and Four Neutral Zones. Support Zones: Buys only. Resistance Zones: Sells only. Neutral Zones: Grid-dependent
When MA filter is enabled, Buys are only triggered below Moving Average, and Sells are only triggered above.
Trigger = Wick. Confirmation = Breakout. Buys are signaled when Low breaks above the next grid level. Sells are signaled when High breaks below the next grid level.
🚀 CONCLUSION 🚀
The D-I-Y Gridbot is a proof-of-concept, emphasizing its experimental and educational nature. In future versions, we will aim to incorporate concepts such as auto-adjusting grids and angled grids for trending markets. The script is designed to evolve through user feedback and suggestions, shaping its future iterations.
Credit: This is a continuation of the Gridbot series by xxattaxx-DisDev . Explicit permission was granted by user xxattaxx-disdev to re-use all Gridbot code and all materials without restrictions.
⚠️ DISCLAIMER ⚠️
This indicator is a proof-of-concept and is considered experimental and educational. When gridlines are drawn in hindsight, signals appear to be predictive and valid. Future results may always vary when the trend direction changes. Comments and suggestions are encouraged.
This indicator is provided as a tool for traders and should not be used as the sole basis for making trading decisions. Always conduct your own research and consider your risk tolerance before entering any trades.

SPY to ES or QQQ to NQThis indicator is used to automatically map SPY VWAP and 10 levels of your choice to ES / MES or map QQQ VWAP and 10 levels of your choice to NQ / MNQ . Since SPY and QQQ have the same price action as their futures iteration, there seems to a direct correlation between their levels and VWAP. This indicator is made to easily map the key levels of your choice to the appropriate futures instrument.

HDT CloudsHDT Clouds combines custom clouds such as the 200EMA/MA cloud indicator to create high confluence bounce zones when combined with VWAP. The HDT indicator combines various clouds with the Volume Weighted Average Price indicator and Standard Deviations which allow users to identify areas on the chart where the stock may reverse.
On smaller time frames, like the 5/15/30minute, the 200ema/ma cloud and VWAP (when sitting in the same relative area) creates pockets of supply or demand.
In addition, the various moving average clouds, such as the 8/9ema cloud and the 34/50ema cloud, create areas of supply and demand depending on the overall trend. If the stock is trending very strongly to the upside, the 8/9ema can be used as a potential bounce area. Whereas, if the stock is trending, but not quite as strong, the stock may have demand at the 34-50ema where the stock could see a potential bounce to the upside. What sets this indicator apart from other moving average clouds is the incorporation of VWAP/Standard Deviation and the combining of a 200EMA/MA indicator which creates a strong pocket of demand even on lower time frames such as the 5 or 15 minute time frame.

.srb suiteThe essential suite Indicator.
that are well integrated to ensure visibility of essential items for trading.
it is very cumbersome to put symbol in the Tradingview chart and combine essential individual indicators one by one.
Moreover even with such a combination, the chart is messy and visibility is not good.
This is because each indicator is not designed with the others in mind.
This suite was developed as a composite-solution to that situation, and will make you happy.
designed to work in the same pane with open-source indicator by default.
Recommended visual order ; Back = .srb suite, Front = .srb suite vol & info
individually turn on/off only what you need on the screen.
BTC-agg. Volume
4 BTC-spot & 4 BTC-PERP volume aggregated.
It might helps you don't miss out on important volume flows.
Weighted to spot trading volume when using PERP+spot volume .
If enabled, BTC-agg.Vol automatically applied when selecting BTC-pair.
--> This is used in calculations involving volumes, such as VWAP.
Moving Average
1 x JMA trend ribbon ; Accurately follow short-term trend changes.
3 x EMA ribbon ; zone , not the line.
MA extension line ; It provide high visibility to recognize the direction of the MA.
SPECIAL TOOLS
VWAP with Standard Deviation Bands
VWAP ruler
BB regular (Dev. 2.0, 2.5)
BB Extented (Dev. 2.5, 3.0, 3.5)
Fixed Range Volume Profile ; steamlined one, performace tuned & update.
SPECIAL TOOLS - Auto Fibonacci Retracement - New GUI
'built-in auto FBR ' has been re-born
It shows - retracement Max top/ min bottom ; for higher visibility
It shows - current retracement position ; for higher visibility
The display of the Fib position that exceeds the regular range is auto-determined according to the price.
tradingview | chart setting > Appearance > Top margin 0%, Bottom margin 0% for optimized screen usage
tradingview | chart setting > Appearance > Right margin 57
.srb suite vol & info --> Visual Order > Bring to Front
.srb suite vol & info --> Pin to scale > No scale (Full-screen)
Visual order ; Back = .srb suite, Front = .srb suite vol & info
1. Fib.Retracement core is from tradingview built-in FBR ---> upgrade new-type GUI, and performance tuned.
2. Fixed-range volume-profile core is from the open-source one ---> some update & perf.tuned.
---------------------------------------------------------------------------------------------------------------------------------------
if you have any questions freely contact to me by message on tradingview.
but please understand that responses may be quite late.
Special thanks to all of contributors of community.
The script may be freely distributed under the MIT license.

scalping2sahilnarkarThis is the a bit edited to the previous script. As per regulations i have kept this as an open script.
The only Difference to confirm your support resistance levels is an addition of simple moving average 21.
Rules are the Same-
- Trade long when above vwap and 21EMA
- Trade Short when below the VWAP.
EMA21 and EMA50 acts as support where as SMA 21 will show the Trend.
Even though This script is purely based on EMA's, i tend to find the SMA21 as a good Support resistance/support while taking a trade as it avoids the wipsaws while taking an entry.
Please Note-
-This is a scalping Script so book profits and keep stoplosses accordingly.
-When you put this script on the screen, remove everything except EMA9,EMA21,EMA50,EMA200 and the SMA21(keep the arrows and edit the arrows as you want)
-This is not a plug and play script so tune it as you want on the settings.
-Please consider using a VWAP always.
-I have made this script after putting it into many indian stocks you have to tune it as per your stock exchange.
Gold IBH/IBL with IBM, Overnight Levels, OVM, and ONVPOCThe Initial Balance (IB) indicator for gold trading is a valuable tool for identifying key price levels and potential trade setups. Here's an overview of how it works:
Initial Balance Calculation
The Initial Balance for gold is calculated from 8:20 AM to 9:20 AM EST, coinciding with the COMEX open. This one-hour period establishes crucial reference points for the trading day.
Key Levels
The indicator displays several important price levels:
IB High: The highest price reached during the Initial Balance period
IB Low: The lowest price reached during the Initial Balance period
IB Midpoint: The average of the IB High and IB Low
These levels often serve as significant support and resistance areas, with many traders placing stop-losses around them.
Overnight Levels
In addition to the IB levels, the indicator shows overnight price action:
ONH: Overnight High
ONL: Overnight Low
ONM: Overnight Midpoint
Overnight VWAP: Volume Weighted Average Price from the overnight session
These overnight levels have a high probability of being tested during the COMEX trading session, making them valuable reference points for traders.
Trading Applications
Traders can use the IB and overnight levels for various purposes:
Setting profit targets
Identifying potential trade entry points
Managing risk by placing stop-losses at key levels
Gauging overall market sentiment and volatility
The levels established during both the Initial Balance and overnight sessions are likely to be touched during the COMEX trading session. This insight allows traders to make more informed decisions and enhances their trading strategies.
If you have more questions about the trading strategy, please DM me, and I can explain further. I also have probabilities of all these levels being broken during the COMEX trading hours, which gives us confidence to hold our trades to targets.
Understanding and utilizing these levels can provide traders with a competitive edge in gold trading, helping them make more informed decisions based on early market dynamics and overnight price action.
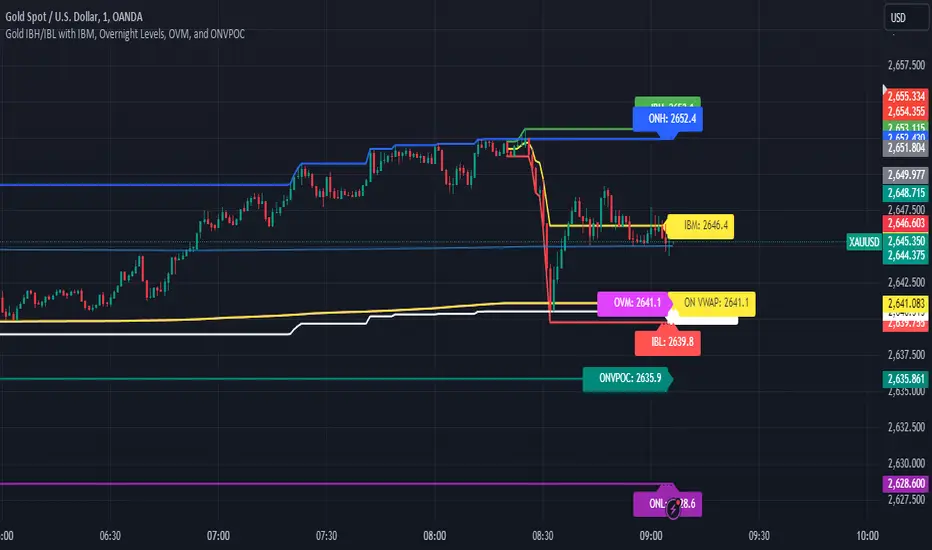
Chart Champions - Part 3 - SessionsThank you for sparing you time to read my indicator.
This indicator has been created as a suite of 3. This was to ensure that those with only the Free Trading View account could benefit (with their restriction to 3 indicators). Please ensure you install each indicator and read each indicator write up to fully understand what has tried to achieved.
Chart Champions – Part 1 –Lvls nPOC VWAPS
This indicator is broken down into:
• Levels
• VWAPS
• Naked Point of Control
Levels
It displays the levels to the right of the price Axis to enable the user to have a cleaner chart.
The below levels will automatically appear:
dOpen – pdHigh – pdLow – pdEQ – pwEQ
Optional Levels include:
mOpen – pmOpen – pdOpen – dbyOpen – wOpen – pwOpen
VWAPs
Optional VWAPs
Daily (including pdVWAP close) – Weekly – Monthly
Naked Points of Control (nPOC)
To view the nPOC move the chart back in time to pick up the nPOCs.
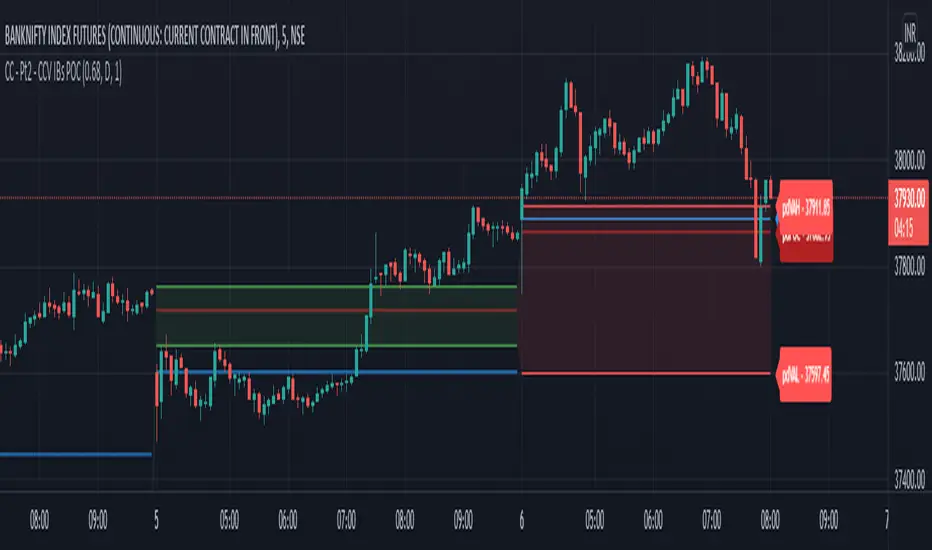
Chart Champions – Part 2 – CCV IBs POC
This indicator is broken down into:
• Chart Champions Value
• Initial Balance
• Points of Control
Chart Champions Value (CCV)
CCV is based on the 80% rule of the dOpen opening outside of the pdVAH/pdVAL. Please do you own research to fully understand how this trading strategy works (readily avaliable online).
Initial Balance (IB)
IB is based on the first 60 minutes of the market opening. It captures the highest and lowest points within that 60 minutes. Please do you own research to fully understand how this trading strategy works (readily avaliable online).
Points of Control (POCs)
POC are the price levels where the most volume was traded.
Developing POC (dPOC) will constantly move with volume/price action through out the day.
Optional POCs
Previous Day POC (pdPOC) – Day Before Yesterday POC (dbyPOC)
Chart Champions – Part 3 – Sessions - Manual Input
This indicator is broken down into:
• Manual Inputs (daily, weekly, monthly)
• IGOR SessionsTtimes
• Pre + Market Openings
Manual Input
Daily x3
Weekly x 3
Monthly x 3
This allows the trader to put in specific levels.
IGOR Session Times
This is a user specific requirement to highlight cetain times during the day, displayed at the bottom of the chart in the colour strip.
Pre + Market Openings
This allows the user to see when pre market trading has started and with the live maket has started, displayed at the top of the chart in colours.
A huge thank you goes out to:
Stackoverflow users AnyDozer and Bjorn.
TV user ahancock for allow me use of this code.
Disclaimer the lower the timeframe the more information it processes.

Chart Champions - Part 2 - CCV IBs POCsThank you for sparing you time to read my indicator.
This indicator has been created as a suite of 3. This was to ensure that those with only the Free Trading View account could benefit (with their restriction to 3 indicators). Please ensure you install each indicator and read each indicator write up to fully understand what has tried to achieved.
Chart Champions – Part 1 –Lvls nPOC VWAPS
This indicator is broken down into:
• Levels
• VWAPS
• Naked Point of Control
Levels
It displays the levels to the right of the price Axis to enable the user to have a cleaner chart.
The below levels will automatically appear:
dOpen – pdHigh – pdLow – pdEQ – pwEQ
Optional Levels include:
mOpen – pmOpen – pdOpen – dbyOpen – wOpen – pwOpen
VWAPs
Optional VWAPs
Daily (including pdVWAP close) – Weekly – Monthly
Naked Points of Control (nPOC)
To view the nPOC move the chart back in time to pick up the nPOCs.
Chart Champions – Part 2 – CCV IBs POC
This indicator is broken down into:
• Chart Champions Value
• Initial Balance
• Points of Control
Chart Champions Value (CCV)
CCV is based on the 80% rule of the dOpen opening outside of the pdVAH/pdVAL. Please do you own research to fully understand how this trading strategy works (readily avaliable online).
Initial Balance (IB)
IB is based on the first 60 minutes of the market opening. It captures the highest and lowest points within that 60 minutes. Please do you own research to fully understand how this trading strategy works (readily avaliable online).
Points of Control (POCs)
POC are the price levels where the most volume was traded.
Developing POC (dPOC) will constantly move with volume/price action through out the day.
Optional POCs
Previous Day POC (pdPOC) – Day Before Yesterday POC (dbyPOC)
Chart Champions – Part 3 – Sessions - Manual Input
This indicator is broken down into:
• Manual Inputs (daily, weekly, monthly)
• IGOR SessionsTtimes
• Pre + Market Openings
Manual Input
Daily x3
Weekly x 3
Monthly x 3
This allows the trader to put in specific levels.
IGOR Session Times
This is a user specific requirement to highlight cetain times during the day, displayed at the bottom of the chart in the colour strip.
Pre + Market Openings
This allows the user to see when pre market trading has started and with the live maket has started, displayed at the top of the chart in colours.
A huge thank you goes out to:
Stackoverflow users AnyDozer and Bjorn.
TV user ahancock for allow me use of this code.
Disclaimer the lower the timeframe the more information it processes.
OHLC/4 Daily vs Quarterly CrossOHLC/4 Daily vs Quarterly Cross
The "OHLC/4 Daily vs Quarterly Cross" indicator is a powerful tool designed to provide traders with insights into trend alignment and potential market turning points. By calculating the average of the open, high, low, and close prices (OHLC/4), this script compares the daily average price action with the quarterly average to identify significant crossover events.
This indicator features two distinct lines: the Daily OHLC/4 and the Quarterly OHLC/4, each plotted in different colors for easy differentiation. A crossover occurs when the daily OHLC/4 moves above the quarterly average, potentially signaling bullish momentum or a shift in market direction. Conversely, a crossunder marks the daily OHLC/4 moving below the quarterly level, indicating potential bearish sentiment or a reversal.
With real-time plotting and built-in alert conditions, this script enables traders to stay ahead of critical market movements by setting automated notifications for crossover events. Whether you're seeking to confirm trends or identify new opportunities, the "OHLC/4 Daily vs Quarterly Cross" delivers clarity and actionable insights for more informed decision-making.

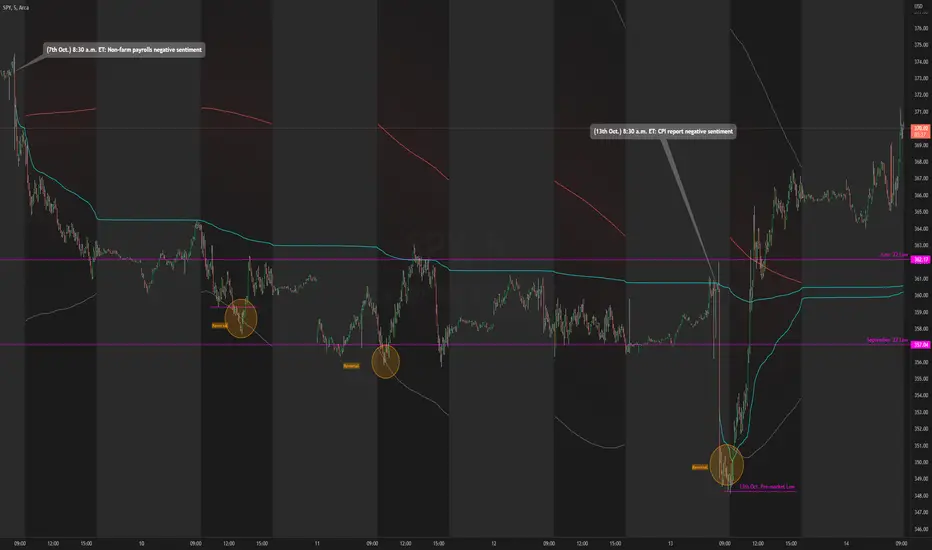
Daily RTH Moving Average On Intraday Timeframes [vnhilton]This indicator is intended for intraday use from the daily timeframe down to the 1 minute. Outside this range, the indicator won't work as intended.
Higher timeframe moving averages are step-lines as they use values from higher timeframes to calculate the moving average. To have a smoother moving average from higher timeframes plotted on lower timeframes, this indicator uses the chart timeframe's candles, allowing for a smooth higher timeframe moving average. This indicator also includes Bollinger Bands. Note that the indicator only uses values from regular trading hours, as to not give weighting to values from extended trading hours.
In the chart above, at October 7th, pre-market price action is bearish due to fundamentals around US employment data. This day led to an all-day-fader, stopping above the June low after attempting to break down the level again (previous breakdown attempts led to the September low). Note that the price is within the Bollinger bands of the 5 day moving average. We can see in the following days that $SPY trended downwards, staying below the anchored VWAP when the October 7th news released, & pay attention to October 10th, where price attempts to make a new low-of-day but ends up outside the 5 day period ma, leading to a reversal. Look at October 13th, where pre-market price action again shows bearish sentiment, but due to fundamentals around CPI data. $SPY opens below the September low, but also ends up outside the daily 5 period MA bands, meaning that the downside extension has extended too far, signalling for a reversion to the mean. This is why October 13th didn't lead to another all-day-fader, & instead trapped sellers trying to short the pre-market low, helping to fuel the relief rally to cause the upsides the June & September lows, & the anchored VWAPs from both significant pre-market events, to be reclaimed, where price pauses at the confluence of the 5 day moving average & the June low.
MTF EMASMulti time frame EMA
This script will plot the configured EMAS on the current time frame (CTF) and also the same EMAS on a higher time frame (HTF).
Hard coded according:
* 5m EMAS will be plotted on TF bellow 5m
* Daily EMA will be plotted on TF above 5m and bellow 1D
* Weekly EMA will be plotted on daily TF
* Monthly EMA will be plotted on weekly TF
This configuration give us the opportunity to watch EMA support/resistance from HTF on the CTF

Key Recent Highs and LowsKey Recent Highs & Lows — Session‐Aware Market Structure
TL;DR
This tool plots the most important intraday price extremes for every U.S.‑equity trading segment—Early Premarket • Western Premarket • Regular Hours • Post‑Market Hours • Yesterday’s Range—and labels them so you can trade break‑outs, retests and mean‑reversion with instant context.
📐 Theory & Why These Levels Matter
Liquidity Pools
Visible session extremes attract resting orders (stop‑losses, take‑profits, opening prints). Price often accelerates into them and reacts at them.
Market Memory
The previous day’s high/low is a widely‑watched pivot for gap fills, overnight inventory corrections and multi‑day breakouts.
Mean‑Reversion Windows
Statistically, pre‑ and post‑market ranges are thin; an aggressive spike outside those bands often retraces when full liquidity returns.
Break‑Out Confirmation
A true breakout isn’t just a tick above RTH‑high—it usually closes or at least consolidates above the prior extreme. Seeing all bands lets you gauge whether a push is “real” or just probing thinner sessions.
Put simply, these levels help you decide:
Break‑out ➜ trade in the direction of expansion past a session extreme with follow‑through.
Fade/Mean‑Revert ➜ fade a spike that tags an extreme without commitment (e.g., hits Western‑Premkt‑High then stalls before RTH).
🔍 What the Script Draws
Session (UTC‑4 EST) Default Color / Style Typical Use‑Case
Early Premarket 4 – 7 AM Thick semi‑transparent orange line detect overnight retail spikes / fade plays
Western Premarket 7 – 9 : 30 AM Dashed orange‑red breakout watch as U.S. brokers open
Regular Session (RTH) 9 : 30 – 16 : 00 Bold teal dotted line core intraday structure; classic highs/lows
Post‑Market 16 – 23 : 59 Soft indigo band after‑hours news moves, earnings fades
Previous‑Day RTH Solid teal gap‑fill targets, trend continuation filters
(All colors, thicknesses and transparencies are editable in the settings.)
✨ Features
Real‑Time Updates
Levels refresh tick‑by‑tick inside their own session—no repainting later.
One‑Click Visibility Toggles
Show or hide any session extreme independently.
Clean Auto‑Labels
Optional right‑edge tags (“RTH High”, “Premkt Low”, etc.) keep your chart readable even when lines overlap.
Automatic Daily Reset
At midnight Eastern, buffers clear and yesterday’s extremes roll into the “Prev‑Day” pair.
Zero‑Noise Design
Transparencies and line styles are tuned so you can overlay on any symbol / timeframe without drowning candles.
📈 How to Trade with It
Intraday Breakout Strategy
Mark confluence (e.g., price pushes through Western Premkt High and Yesterday’s High).
Wait for a pullback that holds above the reclaimed band.
Enter with stop under that session line; target next band or measured‑move.
Fade / Mean‑Reversion
Pre‑market headline sends price 5 % above Early Premkt High.
Volume dries up before RTH open.
Short into exhaustion; cover near Western Premkt High or VWAP.
Gap‑Fill & Trend Days
Cash open gaps above Prev‑Day High.
If first 15‑min candle closes back inside yesterday’s range, bias shifts to downside fade.
If it holds above, treat gap as breakout and track RTH High extensions.
Pair it with volume‑profile, VWAP, or momentum oscillators for even higher‑confidence setups.
⚙️ Settings Cheat‑Sheet
Setting Effect
Show Regular / Premarket / Post‑market High/Low Master visibility per session
Show Previous Day High/Low Toggle yesterday’s anchor range
Show Session Labels Turn the right‑edge tags on/off
Style Panel Change each line’s color, width, transparency, dash/dot
🛠️ Best Practices
Works on any intraday timeframe (1‑min to 1‑hour).
Crypto or 24 h markets: adjust session times to match your exchange.
Combine with alerts (e.g., “price crossing RTH High”) for hands‑free monitoring.
Put KRHL on your chart and you’ll never wonder which high matters most again—because they’re all right there, clearly labeled and color‑coded. Trade breakouts or fades with confidence, armed with the exact market structure everyone else is watching.
