VWAP + 2 Moving Averages + RSI + Buy and SellIndicator: VWAP + 2 Moving Averages + RSI + Buy and Sell
Buy and Sell Arrows (Great for use alone or in conjunction with other scripts on the chart)
This indicator displays BUY (BUY) and SELL (SELL) arrows on the chart based on a combination of moving averages, VWAP and RSI. Arrows are a visual way to identify trading opportunities and can be useful for traders who want to follow a strategy based on these conditions.
The indicator uses two moving averages (20 and 50 periods) to identify upward crosses (buy) and downward crosses (sell). In addition, it takes into account VWAP (Volume Weighted Average Price) and RSI (Relative Strength Index) as additional filters to confirm buy and sell signals.
This script is great for use both independently and in conjunction with other indicators and strategies. You can combine it with other indicators and customize it to your preferences to create a more comprehensive trading strategy.
Please remember that this indicator is provided for educational purposes only and does not constitute financial advice. It is always recommended to carry out a thorough analysis before making any trading decisions.
Give this indicator a try and enjoy clear visualization of buy and sell arrows on your chart. Happy trading!
Komut dosyalarını "vwap" için ara

VWAP 3x Session Reset- This VWAP aims to be used with futures and forex.
- The VWAP is reset at the beginning of each session.
- 3 different sessions can be specified.
- The lines are not drawn when there is no active session.
- The upper and lower bands with standard deviation 2 are also drawn.
Info: The time zone of the picture is Europe/Berlin

Rolling Multiday VWAPCouldn't find a VWAP script that worked the way I needed so I created this one. Basically, it provides a multiday rolling VWAP. I made the rolling period configurable, but I primarily use it to add a 2 day VWAP to my chart alongside the standard VWAP indicator. This unique thing that this indicator does is dynamically anchor to the configured period, but starting from today backwards.
Basically, this indicator ensures VWAP never anchors to the current day, but instead always shows a 2 day VWAP on today's charts. The problem I had with other indicators is that every other day my 2 day VWAP indicator would anchor to the current day and essentially become a redundant standard VWAP indicator.
Hope to update in the future to dynamically update based the chart day you have in focus, but will need some time to figure out if that's even possible.

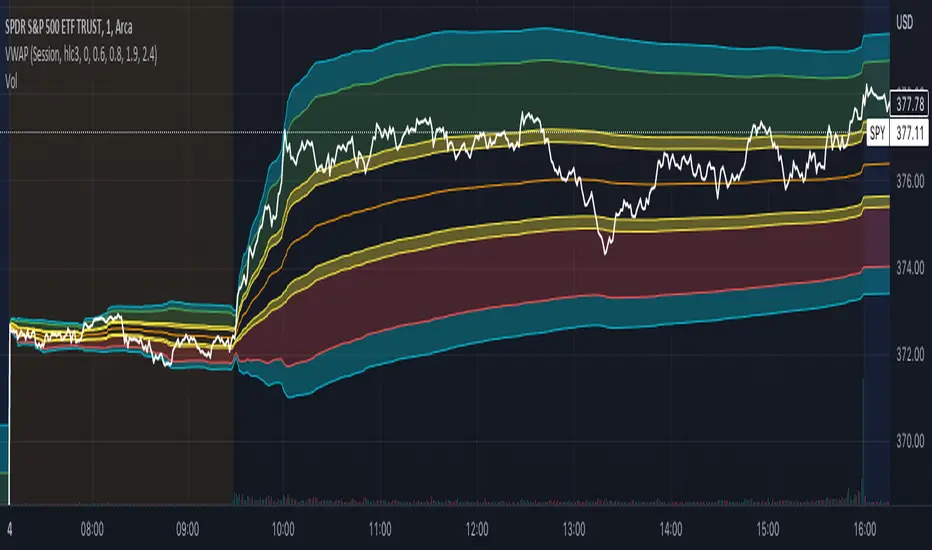
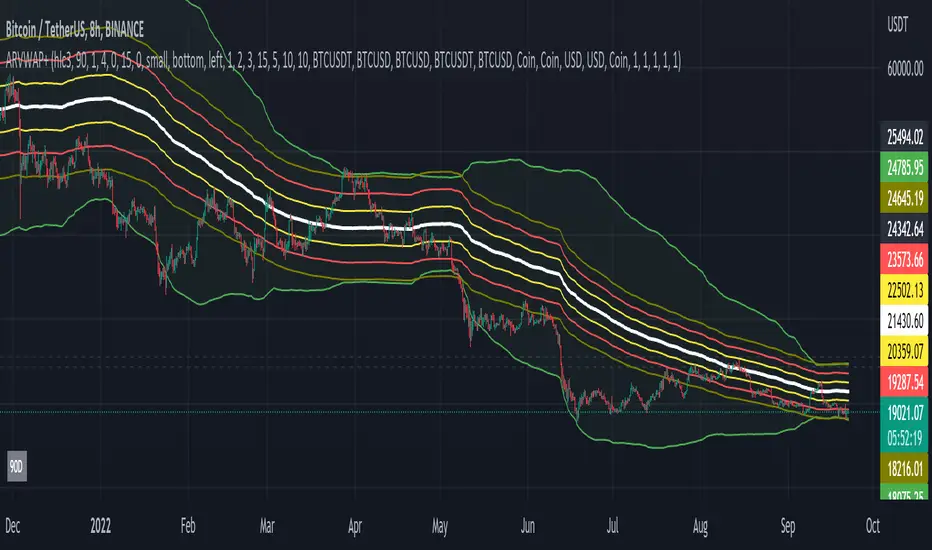
Aggregated Rolling VWAP +Edit of TradingView's original Rolling VWAP
Edit log:
Added Volume Aggregation Capabilities to the Script
- Price Action is impacted by volume executed in all exchanges. Even though a single exchange RVWAP can be useful, using aggregated data makes it more accurate and saves time in symbol switching.
- Aggregation is preset to be done for Bitcoin Spot Pairs. However this can be changed to Aggregate Volume from any other symbol at the bottom of the setup menu.
Added Symmetrical Deviations to the Script
- Symmetrical deviations create range of "tolerance" around the RVWAP at a fixed % distance. This helps in situations when price does not respect the exact RVWAP level and goes slightly above/under.
- Adding multiple Symmetrical Deviations at different percentage values can give relevant levels for scalping, entries and range trading.
Switched default option to manual TF instead of automatic TF
Added TF Presets for quick switching between different settings. (Feature intended for mobile charting)
Added ON/OFF Switch to all individual deviations to make it easier, faster and cleaner to display different data. (Feature intended for mobile charting)
Multiple Non-Anchored VWAPA lot of VWAP scripts are anchored and only allow single VWAP additions. This script allows up to 5 simultaneous VWAPs, for example monthly, quarterly, yearly, 3 years, etc. Can also be used on smaller timeframes. The non-anchored part of the script allows it to be constantly rolling, with no resets.
I do not endorse this script, it was created at my request :)
Donchian Anchored Vwap + HandoffsIn this script I try to incorporate Brian Shannon's Anchored VWAP hand off system into an automated initial anchoring system using Donchian Highs and Lows.
I have also added an average of all the hand-off vwaps.
Higher values in "Donchain Lookback" will display longer term sentiment and vice versa.
*Credit to trader dysrupt for their 'Anchored VWAP Hand-off' script
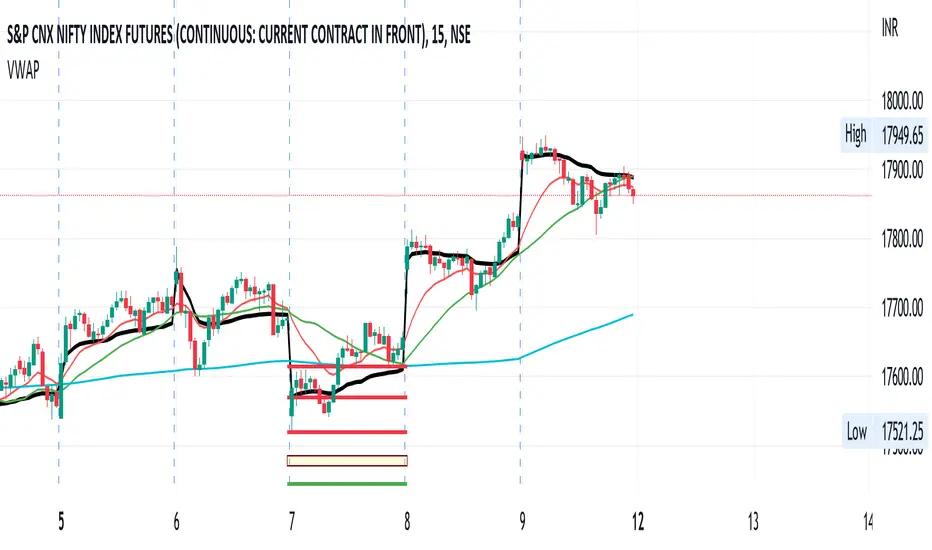
VWAP - Standard + 3 multi periodThis script combines the standard VWAP with 3 additional period-dependent VWAPs (originally coded by Neolao).

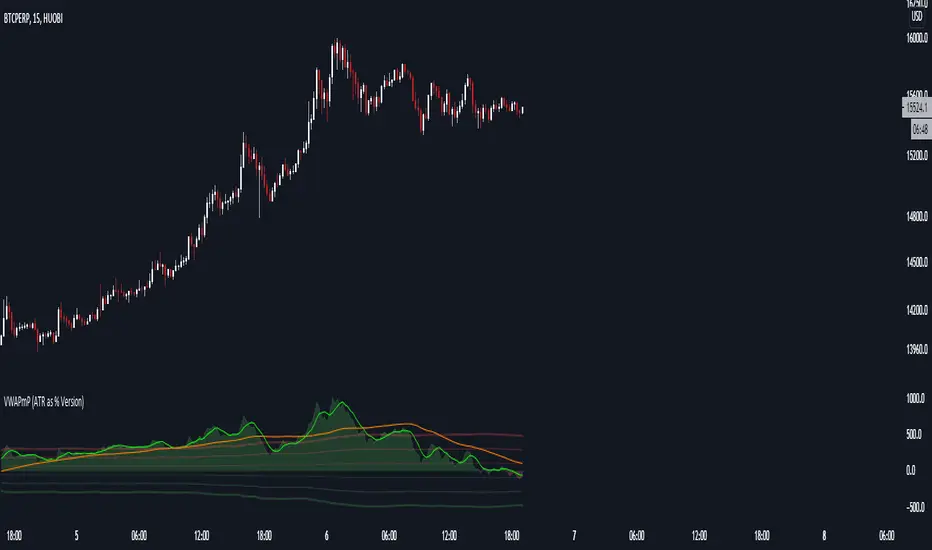
VWAPmP (ATR as % Version)This indicator displays a histogram for the distance of closing price from a VWAP value. The VWAP length is rolling and its value is user defined. Additionally, there are 3 bands which are based on the %-value of the underlying ATR. The ATR's length can be chosen by the user, and the distance multipliers may also be chosen. Lastly, there are two simple moving averages which have user-defined lengths and are based on the histograms value.
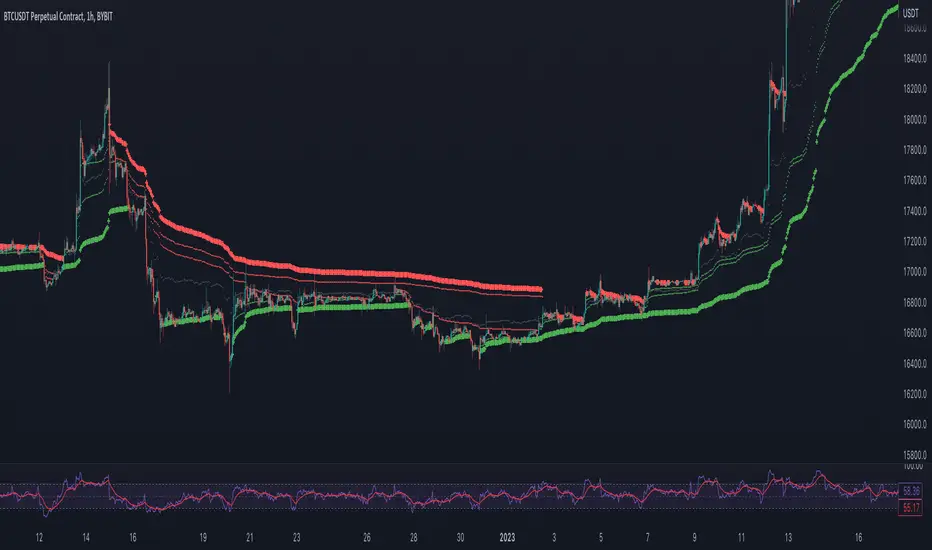
Rumpy's Donchian Anchored VWAPUses donchian points to anchor VWAPs (start a new VWAP interval). The defaults are set up for a 1H chart, with lookback periods of 1 day, 2 days, 1 week, 2 weeks and 4 weeks for the anchor points.
Green : upper donchian AVWAPs, Red : lower donchian AVWAPS, thin/1day to thickest/4 week.
Option to test whether a new point should be formed from a high or low exceeding the historical high/low over a lookback length or using a closes that exceed the historical high/low.
--------------------------------------
If you find it useful please consider a tip/donation :
BTC - 3BMEXEDyWJ58eXUEALYPadbn1wwWKmf6sA

VWAP+SMA+EMAThis is the only indicator combing the results of VWAP + 2 SMAs + 2 EMAs.
This is a free indicator. Enjoy using it.
Kunal Jain
rth vwap and midMidpoint and VWAP are often important inflection points in daytrading. I managed to find a script providing me with a 24 hour session midline by NorthStarDayTrading and a RTH VWAP script by LDBC. So I decided to merge those two to get a RTH mid and vwap.

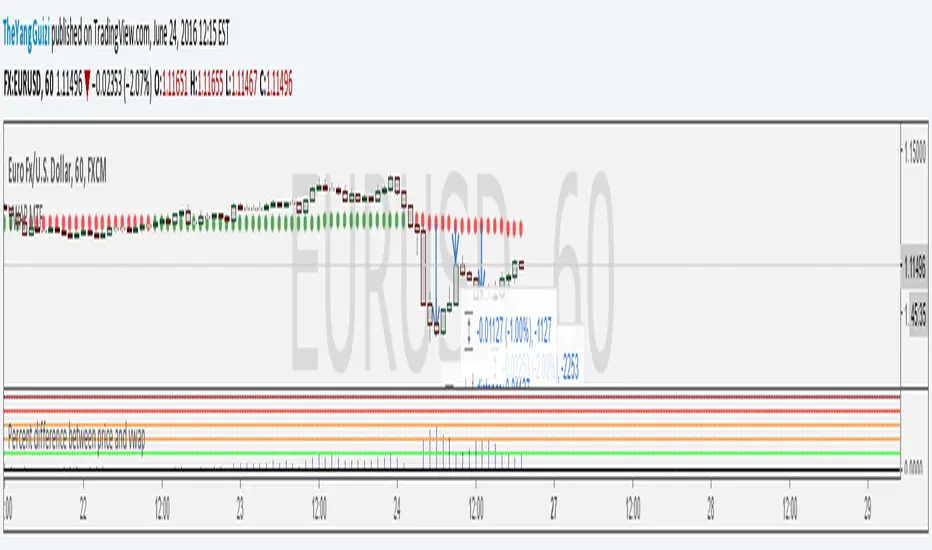
Percent Difference Between VWAP and Price MTFShows the difference between vwap and price in percent.
You can can choose between multiple timeframe vwap. Default is normal daily.
The levels on the indicator can be changed to whatever you want to.
In the chart above we can see eurusd reverting up at 3% below monthly vwap, after the brexit dip, It then turns down again at 1% from monthly and lastly it turns up again at 2% from monthly.
Script is a small modification of this:
Nic's Anchored VWAP 4Poor mans anchored vwap. Allows you to identified the volume weighted average price from 4 specific points in time.
Best used on key pivot point high's and lows'
Difference % between PRICE and VWAP V2Shows difference between price and daily/weekly/monthly/hourly/whatever VWAP.
In v2:
option to color bars
average percentual difference of custom period
histogram changes color depending on which levels it's at
Levels/period/color etc can be customized.
Use these inputs in the timeframe box:
M - month
W - week
D - day
2D (or 3W or 2M or whatever) = 2 Days (or three week or 2 months and so on)
60= 1 H
240= 4 H
5 = 5 min
and so on.
btw, vaguely remembering reading somewhere that the big players like to make their entry at 4% difference.

VWAP Periodic Close [LuxAlgo]The VWAP Periodic Close script offers an advanced tool for analyzing the Volume Weighted Average Price (VWAP) across various timeframes.
This tool enables traders to visualize VWAP close levels for daily, weekly, monthly, quarterly, and yearly periods, offering a comprehensive view of price behavior across different time frames. It helps in identifying key levels where the VWAP closes at the end of each specified period.
🔶 USAGE
This script is designed to enhance your trading strategy by plotting VWAP close levels on your chart for different time periods. This helps traders easily identify historical VWAP levels and analyze price action relative to these levels, particularly useful for identifying key support and resistance levels providing insights into potential future price behavior.
Supports VWAP closes for multiple timeframes, including historical periods (e.g., 3 months back, 3 quarters back, 3 years back). The labels provide context and detailed information about the VWAP close at a specific point in time and enhance the clarity and usefulness of the VWAP data presented on the chart.
Users can toggle the display of VWAP lines for different periods and customize the colors for each timeframe (e.g., distinct colors for monthly, quarterly, and yearly closes).
🔶 SETTINGS
The script offers a range of customizable settings to tailor the analysis to your trading needs.
🔹 Volume Weighted Average Price (VWAP)
VWAP Close Level: Toggle the display of VWAP levels at the end of each period (daily, weekly, monthly, quarterly, yearly).
VWAP Origin: Toggle the display of the VWAP line for each period.
VWAP Source: Choose the data source for VWAP calculations (default is HLC3).
Historical Closes: Define the number of historical VWAP levels to plot.
Line/Label Offset: Adjust the offset for positioning lines and labels on the chart.
🔹 Themes
Theme Selection: Choose between "Day," "Night," or "Custom" themes to adjust the color scheme of VWAP lines and labels.

Neural Adaptive VWAPNeural Adaptive VWAP with ML Features is an advanced trading indicator that enhances traditional Volume Weighted Average Price (VWAP) calculations through machine learning-inspired adaptive algorithms and predictive volume modeling.
🌟 Key Features:
🧠 Machine Learning-Inspired Adaptation
Dynamic weight adjustment system that learns from prediction errors
Multi-feature volume prediction using time-of-day patterns, price momentum, and volatility
Adaptive learning mechanism that improves accuracy over time
📊 Enhanced VWAP Calculation
Combines actual and predicted volume for forward-looking VWAP computation
Session-based reset with proper daily anchoring
Confidence bands based on rolling standard deviation for dynamic support/resistance
🎯 Advanced Signal Generation
Volume-confirmed crossover signals to reduce false entries
Color-coded candle visualization based on VWAP position
Multi-level strength indicators (strong/weak bullish/bearish zones)
⚙️ Intelligent Feature Engineering
Normalized volume analysis with statistical z-score
Time-series pattern recognition for intraday volume cycles
Price momentum and volatility integration
Sigmoid activation functions for realistic predictions
📈 How It Works:
The indicator employs a sophisticated feature engineering approach that extracts meaningful patterns from:
Volume Patterns: Normalized volume analysis and historical comparisons
Temporal Features: Time-of-day and minute-based cyclical patterns
Market Dynamics: Price momentum, volatility, and rate of change
Adaptive Learning: Error-based weight adjustment similar to neural network training
Unlike static VWAP indicators, this system continuously adapts its calculation methodology based on real-time market feedback, making it more responsive to changing market conditions while maintaining the reliability of traditional VWAP analysis.
🔧 Customizable Parameters:
VWAP Length (1-200 bars)
Volume Pattern Lookback (5-50 periods)
Learning Rate (0.001-0.1) for adaptation speed
Prediction Horizon (1-10 bars ahead)
Adaptation Period for weight updates
📊 Visual Elements:
Blue Line: Adaptive VWAP with predictive elements
Red/Green Bands: Dynamic confidence zones
Colored Candles: Position-based strength visualization
Signal Arrows: Volume-confirmed entry points
Info Table: Real-time performance metrics and weight distribution
🎯 Best Use Cases:
Intraday Trading: Enhanced execution timing with volume prediction
Institutional-Style Execution: Improved VWAP-based order placement
Trend Following: Adaptive trend identification with confidence zones
Support/Resistance Trading: Dynamic levels that adjust to market conditions

VWAP Direction HistogramThe ** VWAP Direction Histogram ** indicator is a powerful tool for traders looking to gauge the directional bias of the Volume Weighted Average Price (VWAP). VWAP is a critical metric that combines price and volume to provide a weighted average price, often used to identify institutional trading activity and support/resistance levels. This indicator builds upon the traditional VWAP by calculating its directional changes over a customizable lookback period, providing clear visual cues to traders through a color-coded histogram.
By identifying whether VWAP is rising or falling over the specified lookback period, this indicator helps traders determine the prevailing trend bias in the market. A positive VWAP direction suggests upward momentum and a bullish trend bias, while a negative direction indicates downward momentum and bearish sentiment. This information is further reinforced by coloring the chart candles based on the VWAP trend, enabling quick visual analysis and enhancing decision-making for trend-following strategies. Whether you're trading intraday or longer-term, the ** VWAP Direction Histogram ** offers an intuitive and effective way to align your trades with market trends.

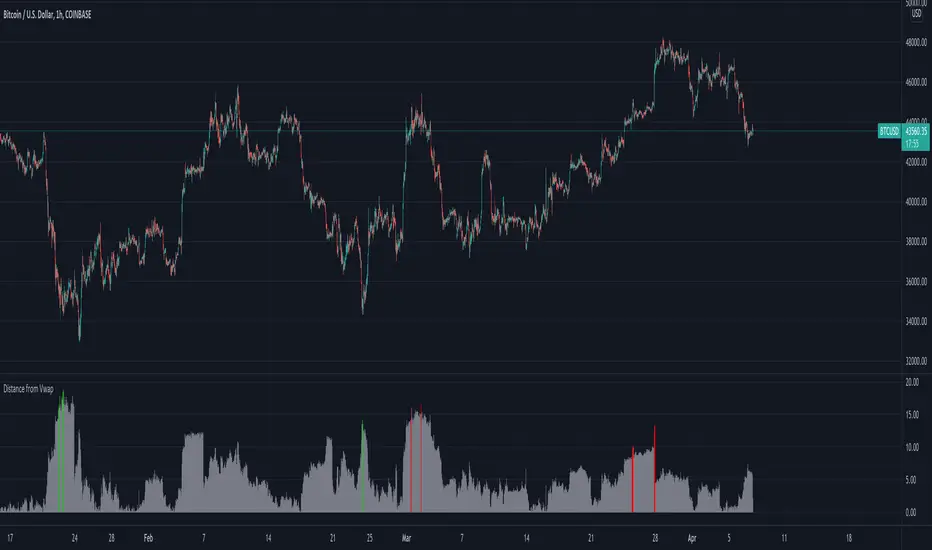
Distance from Vwap// How it Works \\
Measuring the distance of the close price from a higher timeframe VWAP - Volume Weighted Average Price
There is a threshold which is calculated by looking back at the previous x amount of bars and storing the highest/lowest values
If the distance from the vwap stretches above that threshold, the histogram will go green if price is above VWAP and red if its below the vwap
If the distance from the vwap reaches below the low threshold you will see the histogram flashes orange
// Settings \\
In the settings you have the ability to change what timeframe the indicator is calculated on, as well as this you can change the timeframe the VWAP is calculated on.
I always recommend using a higher timeframe vwap as they tend to me more respected
e.g on the hourly timeframe, I use the weekly VWAP, on 1 minute timeframe you may want to use 4 hour timeframe but obviously feel free to experiment
// Use Case \\
When histogram is flashing green, prices is pulling far away from the vwap, obviously you don't want to be buying a falling knife but if you have levels of confluence this can help spot reversals.
I personally wait until the first candle after its been green to get confirmation of the fall weakening. Vica versa for reds and shorts/sells.
When you see orange flashes, this shows that price has been consolidating and the price is very close to the higher time frame VWAP which could be considered a safe entry point as they tend to lead to a big move to follow
// Suggestions \\
Happy for anyone to make any suggestions on changes which could improve the script,
// Terms \\
Feel free to use the script, If you do use the script could you please just tag me as I am interested to see how people are using it. Good Luck!
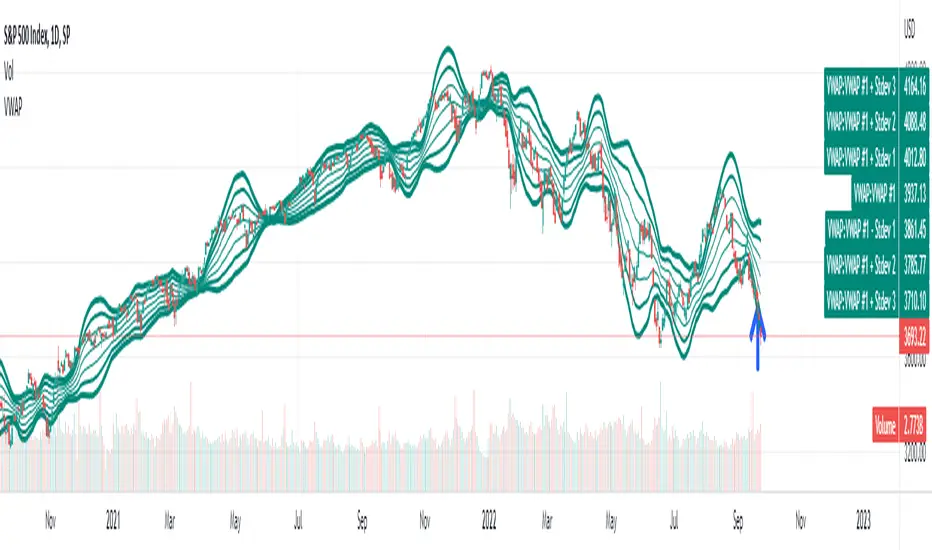
VWAP Multiple [Huntersull]This is a VWAP/Price multiple analysis, in the same vein as something like the Mayer multiple.
It finds the VWAP of price and volume starting at the bar you choose when initiating the script (You can also drag the starting point line on the chart to change it later), and calculates the running VWAP total for every following bar until the current bar.
It then takes the hlc3 of price for each bar and divides it by the VWAP value of that bar, giving a multiple over VWAP price.
This is then charted with your choice of an SMA, EMA, or WMA using VWAP as the source, and a default length of 200, which is also modifiable.
When VWAP is over the moving average, it is filled green. When VWAP is below the moving average, it is filled red.
--------------------------------------------
This is not meant to be a trading indicator, but a tool for general bull/bear market and trend analysis. Use at your own risk.

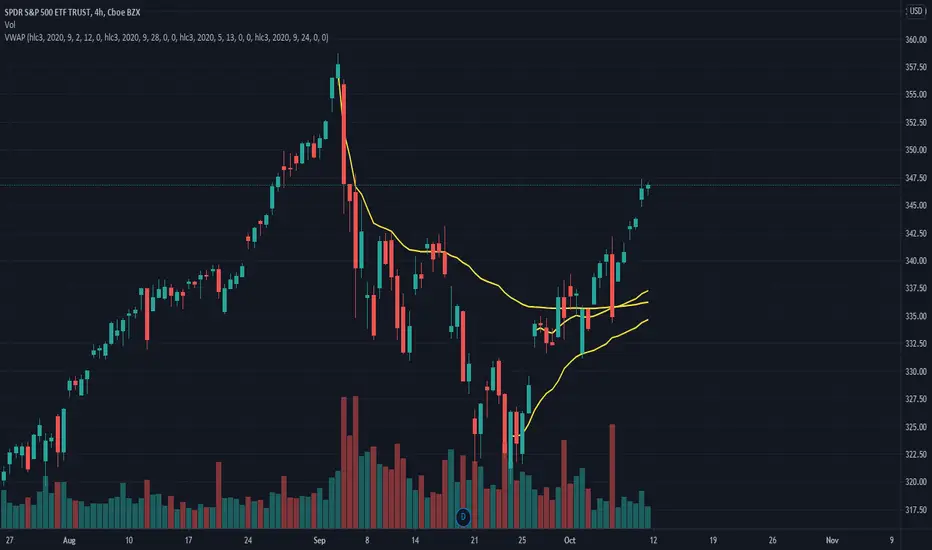
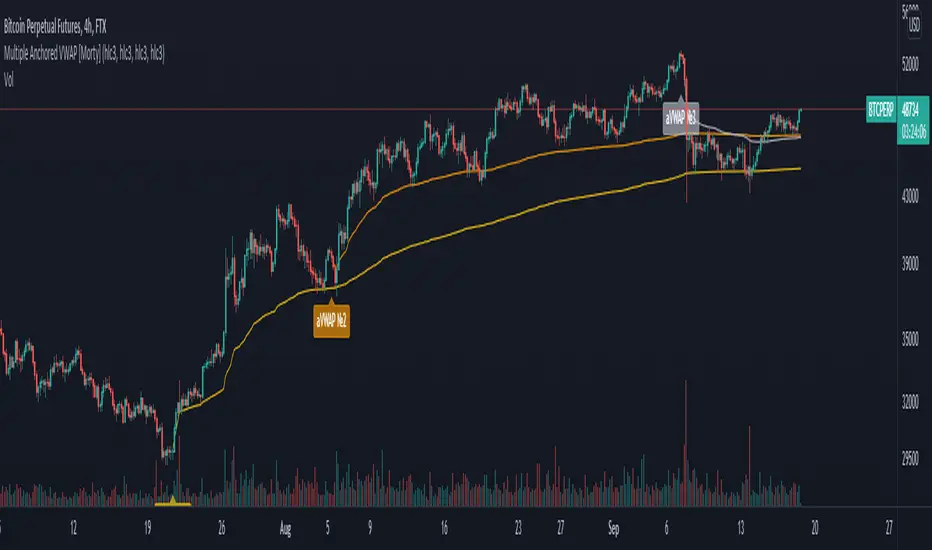
Multiple Anchored VWAP [Morty]The Anchored VWAP (aVWAP) indicator ties VWAP calculations to a specific price bar chosen by the trader. Anchored VWAP allows you to specify the price bar where calculations begin, making it easy to see whether the bulls or bears have been in charge since a very specific point in time. The starting price bar that is chosen generally marks a shift in market psychology, such as a significant high or low, earnings, news, or other announcements. The Anchored VWAP line is charted using price and volume data from that significant event onward.
This indicator plots up to 4 aVWAP lines in the chart.
Features:
- plot up to 4 aVWAP lines
- custom start date of aVWAP
- custom line color
- optional label of starting price bar
- optional custom resolution
----------------------------------------------------
锚定VWAP(aVWAP)指标将VWAP的计算与交易者选择的特定价格柱联系起来。锚定VWAP允许你指定计算开始的价格柱,使你很容易看到自一个非常具体的时间点以来,是牛市还是熊市在起作用。所选择的起始价格条通常标志着市场心理的转变,如一个重要的高点或低点、收益、新闻或其他公告。锚定VWAP线是使用从该重大事件开始的价格和成交量数据绘制的。
该指标在图表中最多绘制了4条aVWAP线。
特色:
- 绘制多达4条aVWAP线
- 自定义aVWAP的开始日期
- 自定义线的颜色
- 可选的起始价格条的标签
- 可选的自定义分辨率
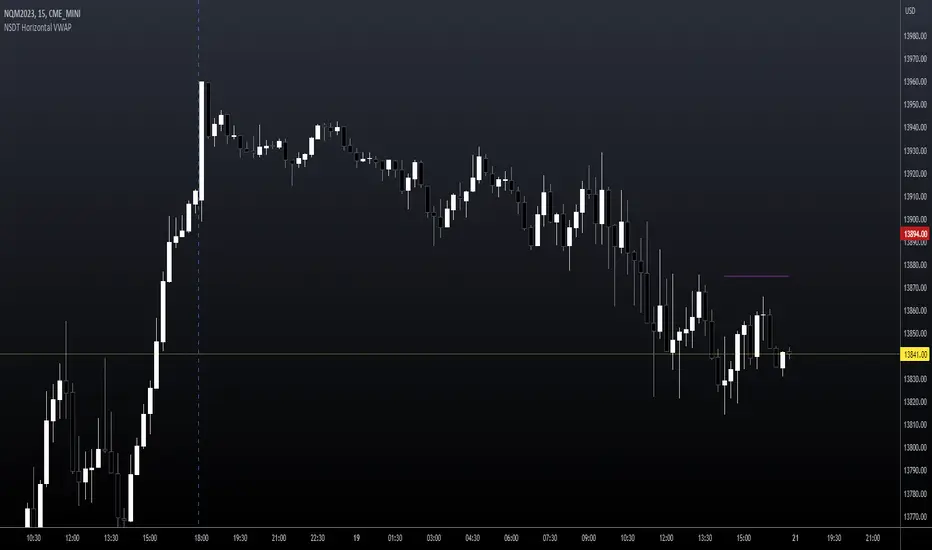
NSDT Horizontal VWAPThis script plots VWAP as a horizontal line starting at the most recent candle and extending backwards for a period of 10 to make it easier to see. (default is 10 but can be changed to fit your needs)
You may only want to see where VWAP is currently and not need to see the entire day. Helps keep the chart clean.
Colors and line settings can all be modified.
You can show the original VWAP plot as well for reference.
What Is the Volume-Weighted Average Price (VWAP)?
The volume-weighted average price (VWAP) is a technical analysis indicator used on intraday charts that resets at the start of every new trading session.
It's a trading benchmark that represents the average price a security has traded at throughout the day, based on both volume and price.
VWAP is important because it provides traders with pricing insight into both the trend and value of a security.
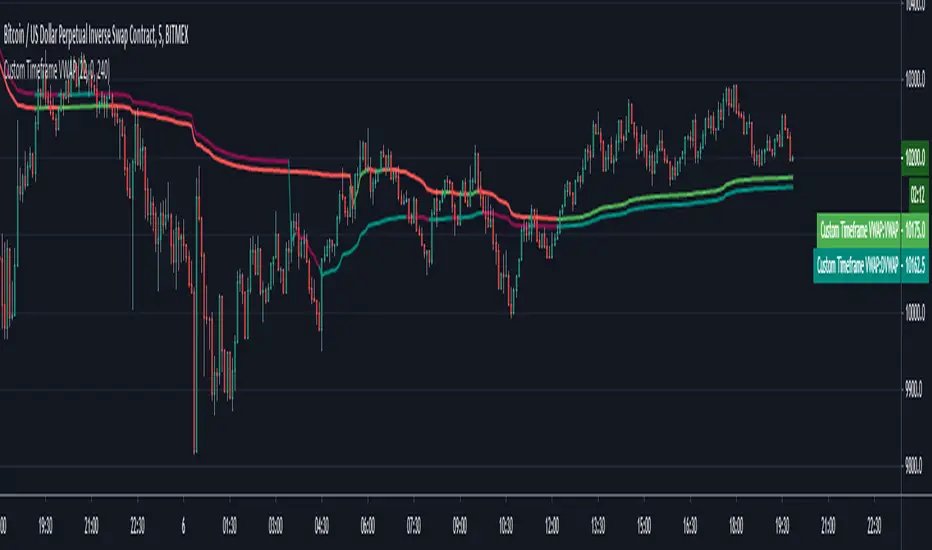
Custom Timeframe VWAPThis script calculates the daily VWAP from any specified starting point intraday. Also colors the VWAP based on whether price is above or below it.
Standard vwap starts at day open 0 GMT, however there are some exchanges for eg. Deribit that have seen they use a different time period to begin VWAP calculations. This is useful in such cases.
You need to specify the hours & minutes of the VWAP that want to use. VWAP will be hidden on any timeframe higher than specified "Highest Visible Timeframe".
Also a big thanks to u/mortdiggiddy as he helped with this script.