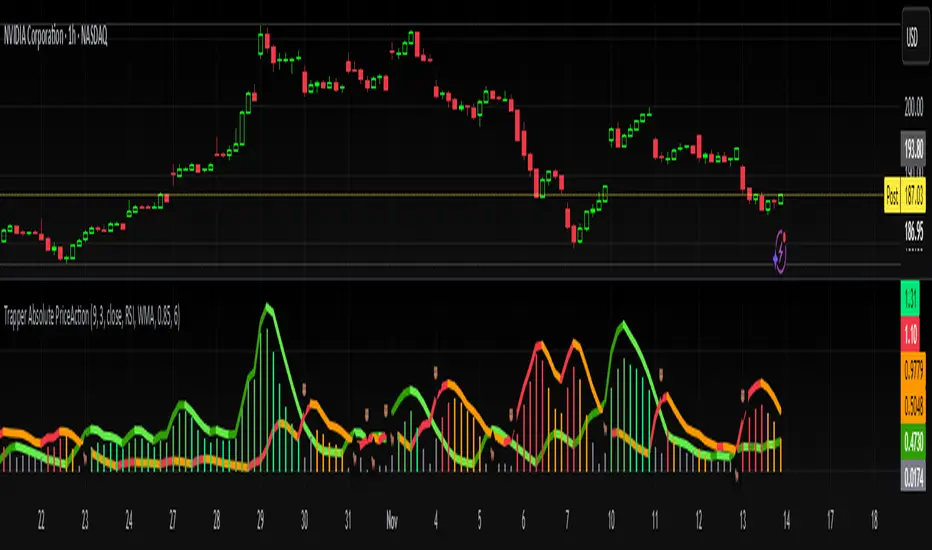
Trapper Absolute PriceActionThe Trapper Absolute PriceAction (TAPA) indicator is a custom, momentum-based oscillator designed to help traders visually read shifts in bullish and bearish price strength — with no reliance on volume or external data.
TAPA calculates and smooths both bullish and bearish momentum using multiple methods (RSI, Stochastic, or ADX) and compares their relative strength in real time. The result is a clean dual-line oscillator with color-coded histograms that highlight which side of the market currently has control.
It was built to give traders a sniper-level precision tool for detecting early momentum shifts before they appear clearly on price charts, allowing confirmation or invalidation of setups faster than with lagging indicators.
How It Works
Momentum Strength Calculation
The script measures directional price movement across the chosen mode (RSI, Stochastic, or ADX).
These values are smoothed twice using a selectable moving average type (WMA, EMA, SMA, ALMA, HMA, etc.).
Bullish & Bearish Curves
The green line represents smoothed bullish momentum (SmthBulls).
The orange/red line represents smoothed bearish momentum (SmthBears).
Histogram Strength Visualization
The distance between the two curves forms a color-coded histogram.
Green/Lime bars indicate growing bullish control, while Orange/Red bars show bearish dominance.
A gray neutral zone reflects indecision or range-bound conditions.
Signal Triggers
BUY 🐂 appears when the green line crosses up through the orange — signaling a bullish momentum flip.
SELL 🐻 appears when the green line crosses down through the orange — signaling bearish control.
Alerts can be enabled directly in TradingView through the BUY (🐂) or SELL (🐻) alert conditions for automated notifications or integrations.
How to Use
1. Confirm Early Momentum Shifts
When a crossover appears, check that the histogram color supports the move (green shades for bullish, red/orange for bearish).
Avoid signals when both lines are tangled and the histogram alternates gray, that usually indicates consolidation or low volatility.
2. Validate with Higher-Timeframe Structure
TAPA is most powerful when aligned with trend structure from higher timeframes.
Example: A bullish crossover on the 1-hour timeframe, while the daily TAPA shows the green line already rising, can confirm momentum alignment before entry.
3. Combine with Support/Resistance
Mark your key support and resistance zones (manual or using your “Trapper S&R PRO” indicator).
Look for a TAPA bullish crossover occurring at a major support zone, that’s often the start of a reversal move.
4. Multi-Mode Analysis
Experiment with “Indicator Method” in the inputs:
RSI Mode - smoother and responsive for swing trading.
Stochastic Mode - better for short-term entries and exits.
ADX Mode - captures trending momentum on strong breakouts.
Examples
Bullish Example:
Price forms a higher low on the chart while TAPA’s green line crosses up through orange with a lime/green histogram. That’s a strong early signal that momentum is reversing before price confirms on structure.
Bearish Example:
Price rallies into resistance, then TAPA shows a red histogram and a bearish cross (green dropping under orange). That’s typically a high-probability short signal once structure breaks.
What Makes TAPA Different
No Volume Dependency: Focuses purely on price behavior, not volume spikes or anomalies.
Multi-Mode Engine: Switch between RSI, Stochastic, or ADX-style momentum math instantly.
Customizable Visuals: Editable histogram color layers (weak/strong bull/bear, neutral) and line color control.
Sniper Labeling System: Clean, minimal BUY/SELL cues at each verified crossover.
Alert-Ready: Built-in conditions allow for TradingView alerts, webhooks, or bot automation.
Modernized Core: Rebuilt in Pine v6 with optimized performance and compliance to TradingView standards.
TAPA is designed to filter out the noise and show what truly drives a move — the shift in control between buyers and sellers.
Best Pairing Indicators
To get maximum clarity and confluence:
Trapper Support & Resistance PRO
Helps identify key zones where momentum flips from TAPA have the most impact. A bullish crossover at a defined support level often marks an early trend reversal.
Trapper Volume Trigger
While TAPA doesn’t use volume internally, pairing it with a volume-based trigger confirms that momentum shifts have institutional participation.
Simple Moving Averages (5, 20, or 50)
Overlay short and mid-term SMAs on your chart to confirm directional bias. A bullish TAPA cross that aligns with SMA-5 crossing above SMA-20 increases reliability.
Disclaimer
This indicator is provided for educational and analytical purposes only.
It does not constitute financial advice or a recommendation to buy or sell any security.
Always conduct your own due diligence and practice proper risk management before trading any strategy.
© 2025 RAMS-offthecharts | “Read • Analyze • Mark • Snipe.”
TAPA is part of the RAMS ecosystem of tactical market tools, designed for traders who focus on precision, discipline, and momentum awareness.
"bot" için komut dosyalarını ara
Current Session H/L — EvolvingTrack the current session high and low as it's formed. Lines are projected back to previous sessions and forward in time. Bot projections are adjustable.

Relative Performance Binary FilterDescription:
This indicator monitors the relative performance of 30 selected crypto assets and generates a binary signal for each: 1 if the asset’s price has increased above a user-defined threshold over a specified lookback period, 0 otherwise. The script produces a JSON-formatted output suitable for webhooks, allowing you to send the signals to external applications like Google Sheets.
Key Features:
Configurable lookback period, price source, and performance threshold.
Supports confirmed or real-time bar data.
Monitors 30 crypto assets simultaneously.
Produces a one-line JSON output with batch grouping for easy webhook integration.
Includes an optional visual sum plot showing how many assets are above the threshold at any time.
Use Cases:
Automate performance tracking across multiple crypto assets.
Feed binary signals into external dashboards, trading bots, or Google Sheets.
Quickly identify which assets are outperforming a set threshold.

Multi EMA + Indicators + Mini-Dashboard + Reversals v6📘 Multi EMA + Indicators + Mini-Dashboard + Reversals v6
🧩 Overview
This indicator is a multi-EMA setup that combines trend, momentum, and reversal analysis in a single visual framework.
It integrates four exponential moving averages (EMAs), key oscillators (RSI, MACD, Stochastic, CCI), volatility filtering (ATR), and a dynamic mini-dashboard that summarizes all signals in real time.
Its purpose is to help traders visually confirm trend alignment, filter valid entries, and identify possible trend continuation or reversal points.
It can display buy/sell arrows, detect reversal candles, and issue alerts when trading conditions are met.
⚙️ Core Components
1. Moving Averages (EMA Setup)
EMA1 (fast) and EMA2 (medium) define the short-term trend and trigger bias.
When the price is above both EMAs → bullish bias.
When below → bearish bias.
EMA3 and EMA4 act as trend filters. Their slopes (up or down) confirm overall momentum and help validate signals.
Each EMA has customizable lengths, sources, and colors for up/down trends.
This “EMA stack” is the foundation of the setup — a structured trend-following framework that adapts to market speed and volatility.
2. Momentum and Confirmation Filters
Each indicator can be individually enabled or disabled for flexibility.
RSI: confirms direction (above/below 50).
MACD: detects momentum crossover (MACD > Signal for bullish confirmation).
Stochastic: identifies trend continuation (K > D for longs, K < D for shorts).
CCI: adds trend bias above/below a threshold.
ATR Filter: filters out small, low-volatility candles to reduce noise.
You can activate only the filters that fit your trading plan — for instance, trend traders often use RSI and MACD, while scalpers may rely on Stochastic and ATR.
3. Reversal Detection
The indicator includes an optional Reversal Section that independently detects potential turning points.
It combines multiple configurable criteria:
Candlestick patterns (Bullish Hammer, Shooting Star).
Large Candle filter — detects unusually large bars (relative to close).
Price-to-EMA distance — identifies overextended moves that might revert.
RSI Divergence — detects potential momentum shifts.
RSI Overbought/Oversold zones (70/30 by default).
Doji Candles — sign of indecision.
A bullish or bearish reversal signal appears when enough selected criteria are met.
All sub-modules can be toggled on/off individually, giving you full control over sensitivity.
4. Signal Logic
Buy and sell signals are triggered when EMA alignment and the chosen confirmations agree:
Buy Signal
→ Price above EMA1 & EMA2
→ Confirmations (RSI/MACD/Stoch/CCI/ATR) pass
→ Trend filters (EMA3/EMA4) point upward
Sell Signal
→ Price below EMA1 & EMA2
→ Confirmations align bearishly
→ Trend filters (EMA3/EMA4) slope downward
Reversal signals can appear independently, even against the current EMA trend, depending on your settings.
5. Visual Dashboard
A mini-dashboard appears near the chart showing:
Current trade bias (LONG / SHORT / NEUTRAL)
EMA3 and EMA4 trend directions (↑ / ↓)
Quick visual bars (🟩 / 🟥) for each filter: RSI, MACD, Stoch, ATR, CCI, EMA filters
Reversal criteria status (Doji, RSI divergence, candle size, etc.)
This panel gives you a compact overview of all indicator states at a glance.
The color of the panel changes dynamically — green for bullish, red for bearish, gray for neutral.
6. Alerts
Built-in alerts allow automation or notifications:
Buy Alert
Sell Alert
Reversal Buy
Reversal Sell
You can connect these alerts to TradingView notifications or external bots for semi-automated execution.
💡 How to Use
✅ Trend-Following Setup
Focus on trades in the direction of EMA1 & EMA2.
Confirm with EMA3 & EMA4 trending in the same direction.
Use RSI/MACD/Stoch filters to ensure momentum supports the trade.
Avoid entries when ATR filter indicates low volatility.
🔄 Reversal Setup
Enable the Reversal section for potential tops/bottoms.
Look for reversal buy signals near support zones or after strong downtrends.
Use RSI divergence or Doji + Hammer signals as confirmation.
Combine with key chart areas (supply/demand or previous swing levels).
⚖️ Combination Approach
Trade continuation signals when all EMAs are aligned and filters are green.
Trade reversals only when at a key area (support/resistance) and confirmed by reversal conditions.
Always check higher-timeframe bias before entering a trade.
🧭 Practical Tips
Use different EMA sets for different timeframes:
9/21/50/100 for swing or trend trades.
5/13/34/89 for intraday scalping.
Turn off filters you don’t use to reduce lag.
Always validate signals with price structure, not just indicator alignment.
Practice in replay mode before live trading.
🗺️ Key Chart Confluence (Highly Recommended)
Although the indicator provides structured signals, its best use is in confluence with:
Support and resistance levels
Supply/demand zones
Trendlines and channels
Liquidity pools
Volume clusters
Signals aligned with strong key areas on the chart tend to have greater reliability than isolated indicator triggers.
I use EMA 1 - 20 Open ; EMA 2 - 20 Close ; EMA 3 - 50 ; EMA 4 - 200 or 100 , but that's me...
⚠️ Important Disclaimer
This indicator is a technical tool, not a guarantee of results.
Trading involves risk, and no signal is ever 100% accurate.
Every trader should develop a personal strategy, use proper risk management, and adapt settings to their instrument and timeframe.
Always combine indicator signals with key chart areas, higher-timeframe context, and your own analysis before taking a trade.

ZynAlgo TrendlinePurpose
ZynAlgo Trendline V2.0 is a trend-following indicator designed to help traders visually identify market direction, momentum alignment, and dynamic risk zones.
It combines multiple moving averages, multi-timeframe analysis, and slope validation to show when a market is trending, ranging, or reversing.
How It Works — Conceptual Breakdown
🔹 1. Trendline Framework (Three-Layer MA System)
The indicator plots three moving-average layers:
Type 1 Line – Fast MA for early trend detection
Type 2 Line – Medium MA as a stability filter
Trendline (200-period) – Long-term structural baseline
When all three are properly stacked and sloped, a directional bias is confirmed:
Bullish → Type 1 > Type 2 > Trendline
Bearish → Type 1 < Type 2 < Trendline
Sideways → Misaligned or flat
Users can select from SMA, EMA, WMA, RMA, SWMA, ALMA, VWAP, fully adjustable to match their style.
🔹 2. Touch-and-Confirm Entry Logic
Entries are visualized only when:
Price touches the selected confirmation line (Trendline, Type 1 or Type 2), and
The direction is re-confirmed within a given number of candles (confirmation window).
You can choose between:
Fixed Mode — confirmation only on the exact N-th candle after touch.
Interval Mode — confirmation allowed anytime within N candles after touch.
This method ensures signals only appear when structure and timing both align — reducing false momentum entries.
🔹 3. Multi-Timeframe Trend Filter (MTF Filter)
The indicator checks trend direction across up to 8 higher timeframes (5 min → Daily).
A signal is valid only if a chosen minimum number of those timeframes confirm the same direction.
This feature creates cross-timeframe confluence, helping users avoid counter-trend setups.
🔹 4. Slope-Based Market Filter
To prevent entries in sideways or choppy markets, the system verifies:
Each MA’s slope is above a user-defined threshold.
MAs are sufficiently spaced apart (using percentage-of-price separation).
When conditions are met, candles are color-coded:
🟩 Uptrend 🟥 Downtrend ⬜ Sideways/No-trade zone.
This gives immediate visual feedback about current market structure.
🔹 5. Dynamic Risk Management System
Choose among three Stop-Loss modes:
Structure-Based – Swing high/low referencing market structure.
MA-Based – Uses the selected moving-average line as a dynamic stop.
ATR-Based – Volatility-adaptive stop (default).
Each entry automatically projects up to three Take-Profit (TP1-TP3) levels using user-defined Risk-to-Reward ratios.
Lines and labels are plotted for Entry, SL, and each TP with optional persistence control (“keep old lines” setting).
🔹 6. Anti-Martingale / Cooldown Logic
A built-in cooldown timer ensures only one trade setup per cycle — new signals pause until the prior trade has reached either TP or SL.
This mechanism prevents overlapping trades and unwanted martingale-style stacking.
🔹 7. Compact On-Chart Dashboard
A small table (top-right corner) summarizes:
Current position (LONG / SHORT / FLAT)
SL mode in use
Confirmation source
Touch/confirmation mode
Cooldown state and remaining bars
This helps monitor settings without opening the menu.
🔹 8. Smart Alerts (Telegram / Discord / Both)
When a new BUY ↗ or SELL ↘ confirmation occurs, the script can send structured alerts containing:
Symbol
Entry price
TP1 – TP3 values
Stop Loss
Timestamp
You can select the preferred platform (Telegram / Discord / Both).
These alerts are optional and serve as notifications, not trade instructions.
Usage Guide
Trendline Length: Period of the main long-term moving average (default = 200). Higher = smoother, slower trendline.
Trendline Type / Type 1 / Type 2 Type: Choose from SMA, EMA, WMA, RMA, SWMA, ALMA, VWAP depending on your preference for responsiveness or smoothness.
Confirmation Source: Which MA must be touched by price to start a confirmation window (Trendline = conservative, Type 1 = frequent, Type 2 = balanced).
Confirmation Window: Number of bars allowed for price to confirm direction after touch.
Stop Loss Mode: Select ATR-based, structure-based, or MA-based stop visualization.
R:R Ratios (TP1-TP3) Adjust distances for visual target levels based on risk-to-reward multiples.
Enable MTF Filter: Require trend alignment across higher timeframes before showing a signal.
Enable Slope Filter: Prevents signals when MAs are flat or overlapping (sideways market).
Enable Candle Coloring: Colors candles by trend state for quick visual confirmation.
How to Use
Apply the indicator to a clean chart with no other overlays for clarity.
Check candle color:
Green → Uptrend; Red → Downtrend; Gray → Sideways.
Wait for a “BUY ↗” or “SELL ↘” label to appear after a valid touch + confirmation sequence.
Observe drawn lines: Entry = blue, SL = red, TP = green.
Use displayed levels as visual references only. You may combine them with your own entry rules or strategy.
Optional: enable the dashboard (top-right) to monitor trend filter states and settings in real time.
⛔ False-Signal Reduction
Combining slope validation with multi-timeframe agreement filters out low-probability entries — useful for traders who prefer quality over quantity.
🧩 Professional Execution Layer
Integrated Stop Loss / Take Profit projection, cooldown logic, and anti-martingale control give it a disciplined, rule-based behavior — a hallmark of algorithmic consistency.
📡 Automation-Ready Alerts
The built-in Telegram / Discord alert module (JSON-formatted payloads) allows direct bot integration for remote monitoring — no additional coding required.
Unlike public MA crossover scripts, ZynAlgo Trendline includes proprietary logic for slope-weighted alignment, MTF aggregation, and confirmation-window entry detection.
🔶 RISK DISCLAIMER
Trading is risky & most day traders lose money. All content, tools, scripts, articles, & education provided by ZynAlgo are purely for informational & educational purposes only. Past performance does not guarantee future results.

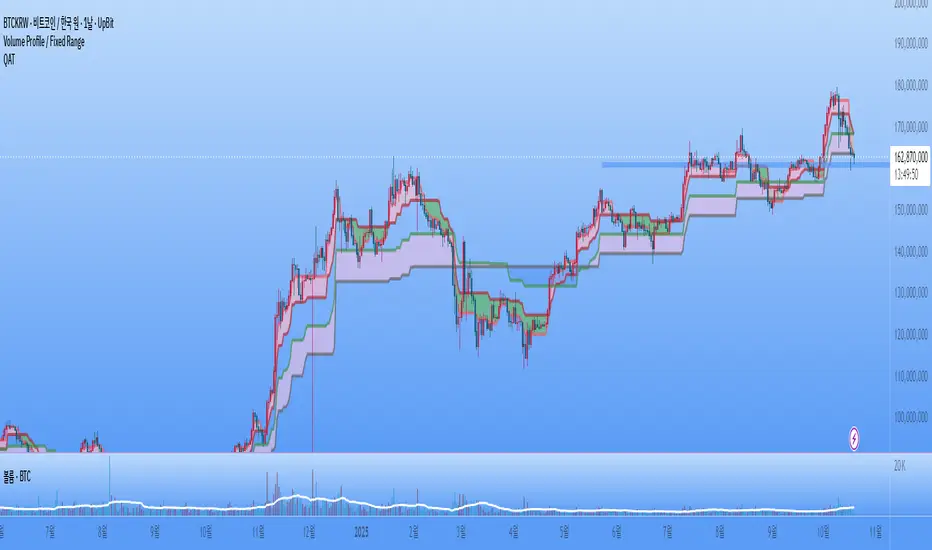
coinbot_mr_table이 스크립트는 **"MA 리본(Moving Average Ribbon) 기반 자동매매 전략"**입니다.
이름(coinbot_mr_table)에 모든 기능이 요약되어 있습니다.
coinbot: user_id, exchange, leverage 등 자동매매 봇과 연동하기 위한 웹훅(Webhook) 신호 전송 기능이 포함되어 있습니다.
mr (MA Ribbon): 18개(5~90)의 이동평균선(EMA 또는 SMA)이 100 이평선을 기준으로 정배열/역배열되는지를 색상(LIME/RUBI)으로 구분하여 추세를 판단합니다.
table: 전략의 백테스팅 성과(총 승률, 일일 수익률 등)를 차트 위에 '누적 통계'와 '일일 통계' 테이블로 시각화해 줍니다.
이 스크립트의 매매 로직과 자동매매 신호에 대한 자세한 설명을 한글과 영어로 각각 제공해 드립니다.
🇰🇷 한글 (Korean)
이 스크립트는 **"MA 리본(Moving Average Ribbon)"**을 핵심 엔진으로 사용하는 완전 자동매매(Autotrade) 전략 신호 생성기입니다.
이 지표의 목적은 차트에서 추세를 시각적으로 보여주는 것을 넘어, 구체적인 매매 신호(진입, 분할 익절, 손절)가 발생할 때마다 JSON 형식의 명령어를 자동매매 봇으로 전송하는 것입니다.
1. 📈 매매 전략: MA 리본 추세 추종
이 전략은 18개의 단기/중기 이동평균선(5~90)과 1개의 장기 이동평균선(100)을 사용하여 추세를 정의합니다.
100 이평선: 장기 추세를 가르는 기준선(강/약을 나누는 분수령)입니다.
18개 리본: 이 리본들이 100 이평선 위에서 모두 상승(LIME 색상)하면 '강세 추세', 아래에서 모두 하락(RUBI 색상)하면 '약세 추세'로 판단합니다.
2. 🚦 진입 및 청산 신호
이 전략은 '전환(Reversing)' 전략입니다. 즉, 롱 신호가 발생하면 숏 포지션을 종료하고 롱으로 진입하며, 그 반대도 마찬가지입니다. (항상 롱 또는 숏 포지션을 유지합니다.)
진입 신호 (Long):
추세 확정: 모든 리본이 100 이평선 위에서 '강세(LIME)'로 통일될 때.
재진입 (불타기): 강세 추세 중, 리본이 일시적으로 조정(GREEN)을 보이다가 다시 '강세(LIME)'로 복귀할 때.
진입 신호 (Short):
추세 확정: 모든 리본이 100 이평선 아래에서 '약세(RUBI)'로 통일될 때.
재진입 (물타기): 약세 추세 중, 리본이 일시적으로 반등(MAROON)하다가 다시 '약세(RUBI)'로 복귀할 때.
청산 신호 (자동매매):
진입 (ENTRY): 롱/숏 신호 발생 시, 설정한 user_id, exchange, leverage 등을 포함한 JSON 메시지를 전송합니다.
익절 (TAKE_PROFIT): 롱/숏 포지션이 사용자가 설정한 TP1, TP2, TP3 목표가에 도달하면, 설정된 물량(qty_percent)만큼 분할 익절하라는 JSON 메시지를 전송합니다.
손절 (CLOSE): 포지션이 설정한 sl_percent에 도달하면, 포지션을 즉시 종료하라는 JSON 메시지를 전송합니다.
3. 📊 핵심 기능: 통계 테이블
이 스크립트는 백테스팅 성과를 두 개의 테이블로 요약하여 차트에 실시간으로 표시합니다.
누적 통계 (Total Stats): 전체 기간의 총 진입 횟수, 승/패, 승률(Winrate), 총수익률(Total Profit) 등을 보여줍니다.
일일 통계 (Daily Stats): '오늘' 하루 동안 발생한 매매의 성과(승/패, 승률, 수익률)만 따로 집계하여 보여줍니다.
🇺🇸 영어 (English)
This script is an automated trading (Autotrade) strategy signal generator based on a "Moving Average (MA) Ribbon."
Its purpose extends beyond visual trend analysis; it is designed to generate specific JSON-formatted commands and send them to an automated trading bot whenever a trade signal (entry, take-profit, stop-loss) occurs.
1. 📈 Trading Strategy: MA Ribbon Trend Following
This strategy uses 18 short-to-mid-term Moving Averages (5 to 90) and one long-term Moving Average (100) to define the trend.
100-MA: This acts as the baseline filter, dividing the market into a long-term bull or bear state.
18-MA Ribbon: When all 18 ribbons are above the 100-MA and rising (LIME color), it defines a 'Strong Bull Trend'. When all are below the 100-MA and falling (RUBI color), it defines a 'Strong Bear Trend'.
2. 🚦 Entry and Exit Signals
This is a 'Reversing' strategy. This means when a long signal occurs, it closes any existing short position and enters long, and vice-versa. It is designed to hold a position (either long or short) at all times.
Long Entry Signals:
Trend Confirmation: When all ribbons unify into a 'Strong Bull' (LIME) state above the 100-MA.
Re-entry (Buy the Dip): During a bull trend, if the ribbon shows a temporary pullback (GREEN) and then flips back to 'Strong Bull' (LIME).
Short Entry Signals:
Trend Confirmation: When all ribbons unify into a 'Strong Bear' (RUBI) state below the 100-MA.
Re-entry (Sell the Rally): During a bear trend, if the ribbon shows a temporary rally (MAROON) and then flips back to 'Strong Bear' (RUBI).
Exit Signals (For Automation):
ENTRY: When a long/short signal occurs, it sends a JSON message with the user's user_id, exchange, leverage, etc.
TAKE_PROFIT: When a position reaches the user-defined TP1, TP2, or TP3 price targets, it sends a JSON message to take profit on the specified quantity (qty_percent) for that portion.
CLOSE (Stop-Loss): When a position hits the sl_percent threshold, it sends a JSON message to immediately close the entire position.
3. 📊 Key Feature: Statistics Tables
The script provides two real-time summary tables on the chart to visualize backtesting performance.
Cumulative Stats: Shows lifetime performance, including total trades, wins, losses, win rate, and total profit.
Daily Stats: Isolates and displays the performance metrics (wins, losses, win rate, profit) for "Today's" trading activity only.

coinbot_ICT_Unicorn(AUTOTRADE)1. 🎯 핵심 기능: 자동매매 신호 전송 (Webhook)
이 스크립트는 매매 신호가 발생할 때마다, 사용자가 '자동매매 설정(Autotrade Settings)'에 입력한 값들을 조합하여 구체적인 JSON 메시지를 생성하고 alert() 함수를 통해 웹훅으로 전송합니다.
입력 설정: user_id, exchange(거래소), leverage(레버리지), capital_percent(투입 시드 %), sl_percent(손절 %), 그리고 3단계 분할 익절(tp1_price_percent, tp1_qty_percent 등) 설정을 입력받습니다.
신호 종류:
ENTRY (진입): 매수(buy) 또는 매도(sell) 신호가 발생하면, 위 모든 설정값을 포함한 진입 명령을 보냅니다.
CLOSE (손절): 전략의 내부 로직에 의해 손절가에 도달하면(slAlertTick), 포지션을 종료하라는 신호를 보냅니다.
TAKE_PROFIT (익절): 목표가에 도달하면(tpAlertTick), 설정된 물량만큼 익절하라는 신호를 보냅니다.
2. 📈 작동 원리: "ICT 유니콘" 매매 전략
이 스크립트의 진입 로직은 ICT(Inner Circle Trader) 개념 중 하나인 **'유니콘 모델'**을 따릅니다.
구성 요소 식별:
Breaker Block (BB): '브레이커 블록'을 식별합니다. 이는 특정 고점/저점을 만든 후 그 방향으로 가지 못하고 반대 방향으로 돌파(Break)된 오더 블록(Order Block)입니다.
Fair Value Gap (FVG): '공정 가치 갭' (가격 불균형 영역)을 식별합니다.
핵심 진입 신호 (Unicorn): 이 전략의 핵심 진입 조건은 **Breaker Block(BB)과 Fair Value Gap(FVG)이 중첩(Overlap)**되는, 소위 '유니콘'이라 불리는 강력한 지지/저항 영역이 발생하는 것입니다.
Long (매수) 진입:
가격이 하락하며 **'하락형 브레이커 블록(Bearish Breaker Block)'**을 만듭니다.
이후 가격이 상승 돌파하며 이 브레이커 블록 영역과 중첩되는 **'상승형 FVG(Bullish FVG)'**를 생성합니다.
이 중첩 영역(FVG-BB Overlap)이 바로 매수 진입의 근거가 됩니다. (코드가 dbgRequireRetracement 설정에 따라 FVG로의 되돌림을 기다리거나 즉시 진입 신호를 보냅니다.)
Short (매도) 진입:
가격이 상승하며 **'상승형 브레이커 블록(Bullish Breaker Block)'**을 만듭니다.
이후 가격이 하락 돌파하며 이 브레이커 블록 영역과 중첩되는 **'하락형 FVG(Bearish FVG)'**를 생성합니다.
이 중첩 영역이 매도 진입의 근거가 됩니다.
3. 📊 부가 기능
시각화: 차트 상에 FVG 영역과 Breaker Block 영역을 박스로 그려주어(설정에 따라 표시/숨김 가능) 매매 근거를 시각적으로 확인할 수 있게 합니다.
백테스팅 대시보드: 차트 우측 상단(기본값)에 이 전략의 누적 성과(총 진입 횟수, 승/패, 승률, 총수익률)를 보여주는 대시보드를 표시합니다.
요약
이 스크립트는 **"Breaker Block과 FVG의 중첩(유니콘 모델)"**을 유일한 진입 조건으로 사용하는 매우 구체적인 ICT 전략입니다. 이 조건이 충족되면, 사용자가 미리 설정한 상세한 리스크 관리 값들을 담아 자동매매 봇으로 즉시 실행 가능한 주문 신호를 전송하는 '올인원(All-in-One)' 전략 스크립트입니다.
요청하신 대로, 해당 지표 요약본을 영어로 번역하여 제공합니다.
This script is an automated trading (Autotrade) strategy signal generator based on the ICT "Unicorn" trading model.
As the "AUTOTRADE" in its name implies, the core purpose of this indicator is to detect specific conditions on the chart and send JSON-formatted order signals (webhooks) to an external automated trading bot.
Here are the core mechanics and features of this script:
1. 🎯 Core Feature: Automated Signal Transmission (Webhook)
Whenever a trade signal occurs, this script generates a specific JSON message by combining the values entered by the user in the "Autotrade Settings" and sends it via webhook using the alert() function.
Input Settings: It takes inputs for user_id, exchange, leverage, capital_percent (equity %), sl_percent (stop loss %), and settings for 3-stage split take-profits (e.g., tp1_price_percent, tp1_qty_percent).
Signal Types:
ENTRY: When a "buy" or "sell" signal occurs, it sends an entry command including all the settings above.
CLOSE (Stop-Loss): If the price hits the stop loss according to the strategy's internal logic (slAlertTick), it sends a signal to close the position.
TAKE_PROFIT: When a profit target is reached (tpAlertTick), it sends a signal to take profit on the specified quantity.
2. 📈 How It Works: The "ICT Unicorn" Strategy
The script's entry logic follows the "Unicorn Model," one of the concepts from ICT (Inner Circle Trader).
Identifying Components:
Breaker Block (BB): It identifies a "Breaker Block." This is an Order Block that, after creating a specific high/low, fails to continue in that direction and is instead broken through in the opposite direction.
Fair Value Gap (FVG): It identifies a "Fair Value Gap" (a price imbalance area).
Core Entry Signal (The Unicorn): The core entry condition for this strategy is the overlap of a Breaker Block (BB) and a Fair Value Gap (FVG), which creates a powerful support/resistance zone known as the "Unicorn."
Long Entry:
Price moves down, creating a "Bearish Breaker Block."
Subsequently, price breaks upward, creating a "Bullish FVG" that overlaps with this Breaker Block area.
This overlapping area (FVG-BB Overlap) becomes the basis for the long entry. (Depending on the dbgRequireRetracement setting, the code either waits for a retracement to the FVG or sends an immediate entry signal.)
Short Entry:
Price moves up, creating a "Bullish Breaker Block."
Subsequently, price breaks downward, creating a "Bearish FVG" that overlaps with this Breaker Block area.
This overlapping area becomes the basis for the short entry.
3. 📊 Additional Features
Visualization: It draws the FVG and Breaker Block zones as boxes on the chart (can be toggled in settings), allowing for visual confirmation of the trade setup.
Backtesting Dashboard: It displays a dashboard in the top-right corner (by default) showing the strategy's cumulative performance (total entries, wins/losses, win rate, total profit).
Summary
This script is a highly specific ICT strategy that uses the "overlap of a Breaker Block and an FVG (the Unicorn Model)" as its sole entry condition. When this condition is met, it transmits an immediately executable order signal to an automated trading bot, complete with all the detailed risk management values preset by the user. It is an "all-in-one" strategy script.

Addikro_V1📌 Description – Trend+Entry+Risk Indicator
This indicator combines statistically proven trading concepts into a complete trading framework:
✅ Trend Filter (EMA200)
All trades follow the higher-timeframe trend. Trend direction is clearly visualized.
✅ Entry Signals (you can choose):
EMA Crossover (EMA50 crossing EMA200) — classic trend-following entry
Breakout of recent highs/lows (20-bar range) — optionally only valid after a pullback to EMA50
✅ ATR-Based Risk Management:
Dynamic Stop Loss (SL) and Take Profit (TP1/TP2) levels using ATR
The last entry is saved — SL/TP lines stay visible on the chart
Optional position size suggestion based on % risk of account
✅ Smart Filters for Higher Accuracy:
RSI filter: e.g., only long if RSI > 50
Volume filter: signal only if volume is above SMA × multiplier
✅ Fixed Chart HUD (Table Overlay):
Displays live information anchored to the chart (does not move with candles)
Shows: Trend direction, entry mode, RSI, ATR, SL/TP multiplier, position size suggestion
Position can be set: top-left / top-right / bottom-left / bottom-right
✅ Signals & Alerts:
Visual arrows on the chart for long/short signals
Custom alert conditions included (works with mobile, email, webhook, bots)
🎯 Why this indicator works
It follows the same logic used by many successful systematic and hedge fund strategies:
Trend direction + statistically solid entries + strict risk management → no repainting, no guessing, no emotion.

ICT Sweep + CHoCH + FVG Alerts
### 🔥 ICT Sweep + CHoCH + FVG Alerts
Script designed to automate ICT entry confirmations using:
• Liquidity Sweep (Buy/Sell Stops taken)
• Change of Character (CHoCH)
• Fair Value Gap (FVG) confirmation
### ✅ Conditions
**Long signal when:**
1. Bearish liquidity sweep
2. Bullish CHoCH
3. Bullish FVG forms and gets respected
**Short signal when:**
1. Bullish liquidity sweep
2. Bearish CHoCH
3. Bearish FVG forms and gets respected
### 🎯 Purpose
This script helps traders detect smart-money setup entries based on ICT logic and receive alerts in real time.
### 📡 Alerts
Supports webhook automation for bots, signal servers, or trading platforms.
*This script does not place trades automatically, alerts only.*
### ⚠️ Disclaimer
This tool is for educational purposes.
Always backtest and use proper risk management.
Trend Catch STFR - whipsaw Reduced### Summary of the Setup
This trading system combines **SuperTrend** (a trend-following indicator based on ATR for dynamic support/resistance), **Range Filter** (a smoothed median of the last 100 candles to identify price position relative to a baseline), and filters using **VIX Proxy** (a volatility measure: (14-period ATR / 14-period SMA of Close) × 100) and **ADX** (Average Directional Index for trend strength). It's designed for trend trading with volatility safeguards.
- **Entries**: Triggered only in "tradeable" markets (VIX Proxy ≥ 15 OR ADX ≥ 20) when SuperTrend aligns with direction (green for long, red for short), price crosses the Range Filter median accordingly, and you're not already in that position.
- **Exits**: Purely price-based—exit when SuperTrend flips or price crosses back over the Range Filter median. No forced exits from low volatility/trend.
- **No Trade Zone**: Blocks new entries if both VIX Proxy < 15 AND ADX < 20, but doesn't affect open positions.
- **Overall Goal**: Enter trends with confirmed strength/volatility, ride them via price action, and avoid ranging/choppy markets for new trades.
This creates a filtered trend-following strategy that prioritizes quality entries while letting winners run.
### Advantages
- **Reduces Noise in Entries**: The VIX Proxy and ADX filters ensure trades only in volatile or strongly trending conditions, avoiding low-momentum periods that often lead to false signals.
- **Lets Winners Run**: Exits based solely on price reversal (SuperTrend or Range Filter) allow positions to stay open during temporary lulls in volatility/trend, potentially capturing longer moves.
- **Simple and Balanced**: Combines trend (SuperTrend/ADX), range (Filter), and volatility (VIX Proxy) without overcomplicating—easy to backtest and adapt to assets like stocks, forex, or crypto.
- **Adaptable to Markets**: The "OR" logic for VIX/ADX provides flexibility (e.g., enters volatile sideways markets if ADX is low, or steady trends if VIX is low).
- **Risk Control**: Implicitly limits exposure by blocking entries in calm markets, which can preserve capital during uncertainty.
### Disadvantages
- **Whipsaws in Choppy Markets**: As you noted, SuperTrend can flip frequently in ranging conditions, leading to quick entries/exits and small losses, especially if the Range Filter isn't smoothing enough noise.
- **Missed Opportunities**: Strict filters (e.g., requiring VIX ≥ 15 or ADX ≥ 20) might skip early-stage trends or low-volatility grinds, reducing trade frequency and potential profits in quiet bull/bear markets.
- **Lagging Exits**: Relying only on price flips means you might hold losing trades longer if volatility drops without a clear reversal, increasing drawdowns.
- **Parameter Sensitivity**: Values like VIX 15, ADX 20, or Range Filter's 100-candle lookback need tuning per asset/timeframe; poor choices could amplify whipsaws or over-filter.
- **No Built-in Risk Management**: Lacks explicit stops/targets, so it relies on user-added rules (e.g., ATR-based stops), which could lead to oversized losses if not implemented.
### How to Use It
This system can be implemented in platforms like TradingView (via Pine Script), Python (e.g., with TA-Lib or Pandas), or MT4/5. Here's a step-by-step guide, assuming TradingView for simplicity—adapt as needed. (If coding in Python, use libraries like pandas_ta for indicators.)
1. **Set Up Indicators**:
- Add SuperTrend (default: ATR period 10, multiplier 3—adjust as suggested in prior tweaks).
- Create Range Filter: Use a 100-period SMA of (high + low)/2, smoothed (e.g., via EMA if desired).
- Calculate VIX Proxy: Custom script for (ATR(14) / SMA(close, 14)) * 100.
- Add ADX (period 14, standard).
2. **Define Rules in Code/Script**:
- **Long Entry**: If SuperTrend direction < 0 (green), close > RangeFilterMedian, (VIX Proxy ≥ 15 OR ADX ≥ 20), and not already long—buy on bar close.
- **Short Entry**: If SuperTrend direction > 0 (red), close < RangeFilterMedian, (VIX Proxy ≥ 15 OR ADX ≥ 20), and not already short—sell short.
- **Exit Long**: If in long and (SuperTrend > 0 OR close < RangeFilterMedian)—sell.
- **Exit Short**: If in short and (SuperTrend < 0 OR close > RangeFilterMedian)—cover.
- Monitor No Trade Zone visually (e.g., plot yellow background when VIX < 15 AND ADX < 20).
3. **Backtest and Optimize**:
- Use historical data on your asset (e.g., SPY on 1H chart).
- Test metrics: Win rate, profit factor, max drawdown. Adjust thresholds (e.g., ADX to 25) to reduce whipsaws.
- Forward-test on demo account to validate.
4. **Live Trading**:
- Apply to a chart, set alerts for entries/exits.
- Add risk rules: Position size 1-2% of capital, stop-loss at SuperTrend line.
- Monitor manually or automate via bots—avoid overtrading; use on trending assets.
For the adjustments I suggested earlier (e.g., ADX 25, 2-bar confirmation), integrate them into entries only—test one at a time to isolate improvements. If whipsaws persist, combine 2-3 tweaks.

Scalp BTC/ETH — Reversal & Continuation (v1, Pine v6)Scalp BTC/ETH — Reversal & Continuation (1m à 10m)
Cet indicateur détecte des opportunités de micro-scalping sur futures (BTC/ETH) basées sur deux mécaniques courtes validées par structure de prix :
A) Reversal de pression (contre-mouvement contrôlé)
Détection d’une sur-extension brutale suivie d’une absorption sur la bougie suivante.
Objectif : capturer la première respiration après un excès de prix (rejet court).
B) Continuation courte (momentum + reprise)
Détection de 3 bougies directionnelles consécutives suivies d’un pullback léger, puis signal sur la reprise du mouvement initial.
Gestion intégrée (scénario standard TP dynamique)
TP1 → 50% de la position à un gain fixe (% adaptable au timeframe)
Stop déplacé au Break-Even sur le restant
Sortie finale sur bougie inverse significative
(correction ≥ X% du corps précédent) ou timeout (max bars en trade)
Scalp BTC/ETH — Reversal & Continuation (1m to 10m)
This indicator detects short-term futures scalping setups on BTC & ETH using two mechanical price-action models designed for fast execution:
A) Reversal Compression (counter-move entry)
Identifies a sharp impulse (overextension) followed by absorption / failure to extend on the next candle.
Objective: capture the first corrective pullback after exhaustion.
B) Controlled Continuation (momentum follow-through)
Identifies 3 consecutive trend candles, then a shallow pullback, and triggers an entry on the resumption of the main leg.
Built-in trade logic (dynamic TP structure)
TP1 → scale out 50% of the position at a fixed percentage (auto-scaled per timeframe)
Stop moved to Break-Even after TP1
Final exit on either:
• a meaningful opposite candle (≥ X% correction of prior body), or
• a timeout (max bars in trade)
Technical characteristics
Designed for 1m / 3m / 5m / 7m / 10m
No repainting (bar-close confirmed logic)
Works for both LONG & SHORT
Built-in alert events:
ENTRY_LONG / ENTRY_SHORT / TP1 / EXIT_STOP / EXIT_INVERSE / EXIT_TIMEOUT
Suitable for manual execution, semi-automation (alerts) or full bot integration (webhook JSON)
Purpose
Provide a repeatable, rule-based, non-subjective framework to harvest micro-moves with controlled risk, without relying on lagging indicators or long-term prediction.
(A Strategy / backtesting version is planned as a next iteration.)

Quadruple AlphaTrendKivancOzbilgi's 'Alpha Trend' indicator has been developed as 'Quadruple Alpha Trend'.
It has been extended to AlphaTrend1,2,3,4, and each line allows users to freely choose colors.
Each of the AT1 to 2 and AT3 to 4 was again color-transformed at the crossing point, respectively.
We believe that the value of AT can compensate a lot for all the shortcomings of a regular moving average.
It can show the support and resistance of the low and high points at each horizontal section and
pressed neck point at the same time
Draw a horizontal line type.
These advantages make it easy to visually break through and collapse support and resistance on the monthly, weekly, and daily charts
It makes it possible to distinguish. I think it's an excellent indicator design by Kivanc Ozbilgi.
The most similar indicator to this one is the "UT BOT", which is close to the moving average in terms of support and resistance
Because it gives a euphemism, the value of "Alpha Trend" as an index that includes horizontal support and resistance
Very highly appreciated. If you have any issues or need to develop further, please leave a note.
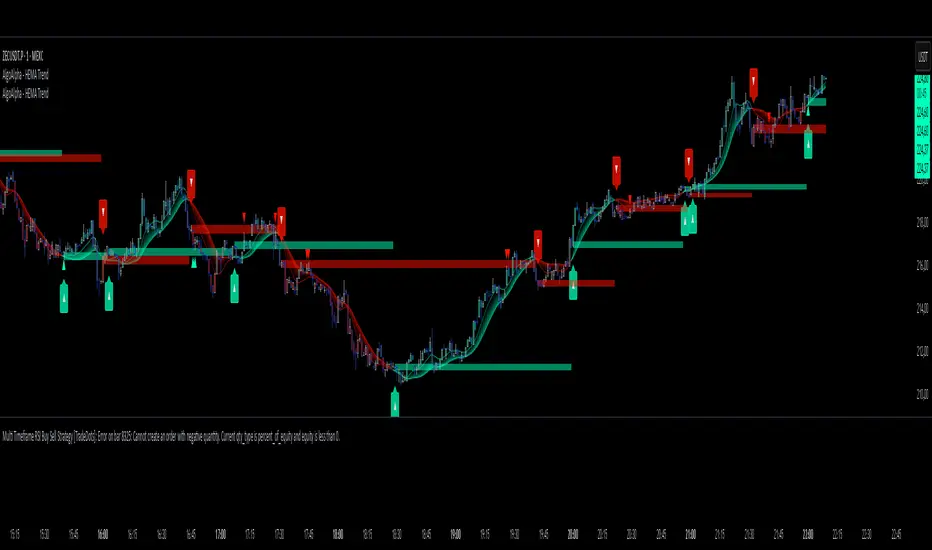
HEMA Trend Levels [AlgoAlpha]This indicator analyzes trend, momentum, volume and liquidity traps to generate LONG/SHORT signals.
It also includes automatic support/resistance zones, volatility warnings, and a risk panel.
Features:
EMA, DEMA, RSI, MACD, ADX, HTF EMA confirmations
ATR-based TP1 / TP2 targets with trailing SL
Liquidity trap / wick detection
Pump/dump movement alarms
Colored Heikin Ashi candles
Automatic support/resistance zones (pivot-based)
Top-right panel with trend, RSI, MACD, volume/ADX, active trade and risk score
How to Use:
Timeframes: Best for 1m–15m scalping, 1H–4H swing trading.
Signals: “BUY” label → Long entry, “SELL” label → Short entry.
Zones: Green = support, Red = resistance.
Alerts: High ATR = reduce leverage, Bot trap = caution.
Panel: When trend & confirmations align, the signal is stronger.
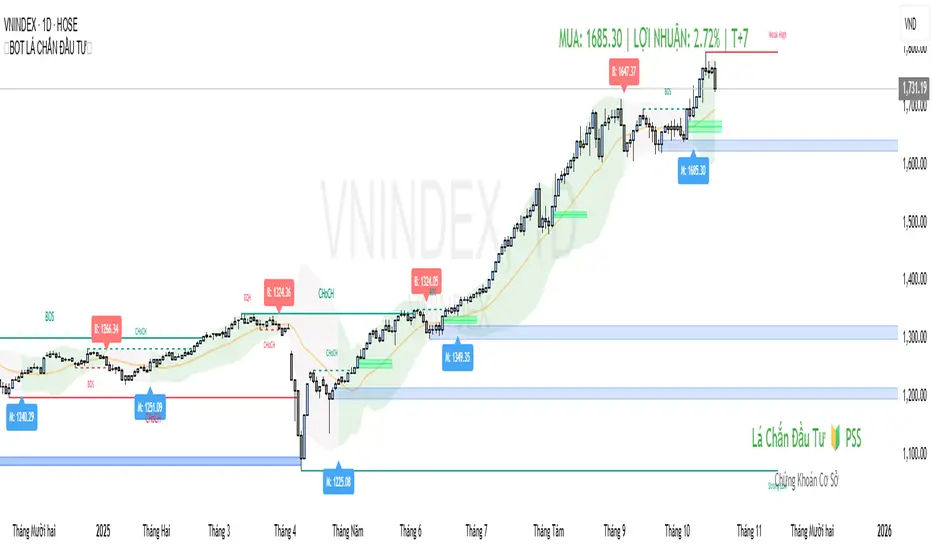
🔰BOT TEAM PSS🔰This hybrid strategy integrates the institutional focus of Smart Money Concepts (SMC) with the confirmation power of technical indicators. The approach begins with an SMC framework, identifying high-probability zones such as Order Blocks (OB), Fair Value Gaps (FVG), and liquidity pools. Traders first analyze market structure, watching for a Market Structure Shift (MSS) or Change of Character (CHoCH) to signal a potential shift in direction.
Once price retraces into a key SMC zone, the trader does not enter immediately. Instead, they seek confirmation from a specialized indicator, such as a proprietary tool developed by the 'La Chan Dau Tu' (Investment Shield) team. This custom indicator is specifically designed to validate SMC signals, filtering out low-probability trades. This dual-layer analysis is key: SMC provides the high-probability "where," while the team's indicator provides the "when," confirming momentum alignment before entry.

🔰BOT LÁ CHẮN ĐẦU TƯ🔰This hybrid strategy integrates the institutional focus of Smart Money Concepts (SMC) with the confirmation power of technical indicators. The approach begins with an SMC framework, identifying high-probability zones such as Order Blocks (OB), Fair Value Gaps (FVG), and liquidity pools. Traders first analyze market structure, watching for a Market Structure Shift (MSS) or Change of Character (CHoCH) to signal a potential shift in direction.
Once price retraces into a key SMC zone (e.g., a bullish OB), the trader does not enter immediately. Instead, they seek confirmation from a specialized indicator, such as a proprietary tool developed by the 'La Chan Dau Tu' (Investment Shield) team. This custom indicator is specifically designed to validate SMC signals, filtering out low-probability trades. This dual-layer analysis is key: SMC provides the high-probability "where," while the team's indicator provides the "when," confirming momentum alignment before entry.
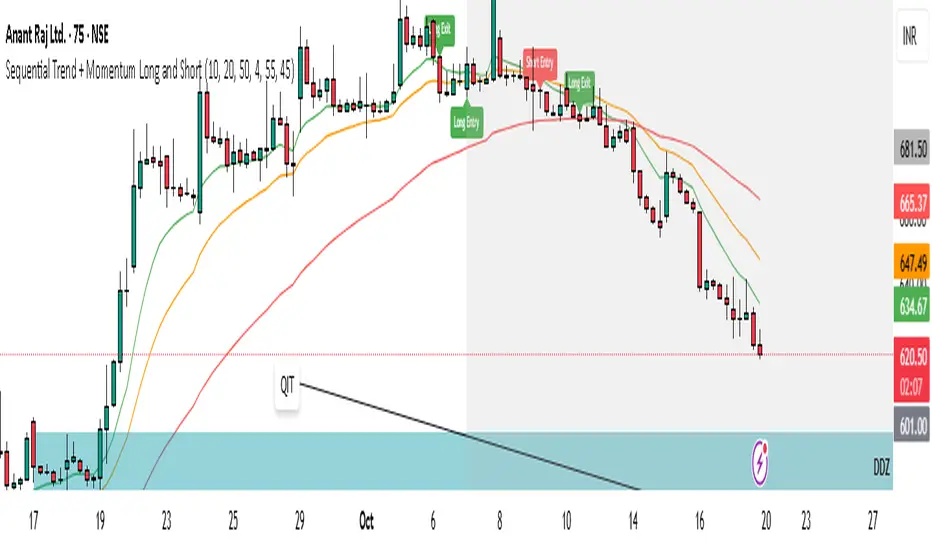
Sequential Trend + Momentum Long and Short📈 Signals
🟢 Long Entry: EMA trend turns bullish and RSI confirms momentum.
🔴 Short Entry: EMA trend turns bearish and RSI confirms momentum.
🟢 Long Exit: Price drops below EMA Exit zone.
🔴 Short Exit: Price rises above EMA Exit zone.
🧩 Parameters
Input Description
EMA Fast Short-term EMA for trend detection
EMA Slow Medium-term EMA for trend filtering
EMA Exit Longer EMA for trailing exit confirmation
RSI Length Period of RSI used for momentum check
RSI Long Threshold RSI value confirming bullish momentum
RSI Short Threshold RSI value confirming bearish momentum
🚀 How to Use
Apply the indicator on your preferred timeframe (15min–1h recommended).
Use Long Entry and Short Entry markers for potential trade setups.
Combine with your own stop-loss & target rules or automate via webhook.
Alerts are built-in for all entries/exits and can be sent to trading bots or brokers.
🔔 Alerts
Sequential Long Entry Triggered → triggers when bullish conditions align.
Sequential Long Exit Triggered → triggers when long trend weakens.
Sequential Short Entry Triggered → triggers when bearish conditions align.
Sequential Short Exit Triggered → triggers when short trend weakens.
🧭 Best Practices
Works best in trending markets; avoid ranging conditions.
Can be paired with volume filters or higher timeframe confirmation for better accuracy.
Adjustable EMA and RSI values make it flexible across assets (stocks, crypto, indices).
Short Only Bot (3Commas Webhook Uyumlu)Short işlem açmaya ce 3commans ile uyumlu hacim odaklı indikatör. halka açık herkes kullanabilir.

Algo Trading Signals - Buy/Sell System# 📊 Algo Trading Signals - Dynamic Buy/Sell System
## 🎯 Overview
**Algo Trading Signals** is a sophisticated intraday trading indicator designed for algorithmic traders and active day traders. This system generates precise buy and sell signals based on a dynamic box breakout strategy with intelligent position management, add-on entries, and automatic target adjustment.
The indicator creates a reference price box during a specified time window (default: 9:15 AM - 9:45 AM IST) and generates high-probability signals when price breaks out of this range with confirmation.
---
## ✨ Key Features
### 📍 **Smart Signal Generation**
- **Primary Entry Signals**: Clear buy/sell signals on confirmed breakouts above/below the reference box
- **Confirmation Bars**: Reduces false signals by requiring multiple bar confirmation before entry
- **Cooldown System**: Prevents overtrading with configurable cooldown periods between trades
- **Add-On Positions**: Automatically identifies optimal pullback entries for scaling into positions
### 📦 **Dynamic Reference Box**
- Creates a high/low range during your chosen time window
- Automatically updates after each successful trade
- Visual box display with color-coded boundaries (red=resistance, green=support)
- Mid-level reference line for market structure analysis
### 🎯 **Intelligent Position Management**
- **Automatic Target Calculation**: Sets profit targets based on average move distance
- **Add-On System**: Up to 3 additional entries on optimal pullbacks
- **Position Tracking**: Monitors active trades and remaining add-on capacity
- **Auto Box Shift**: Adjusts reference box after target hits for continued trading
### 📊 **Visual Clarity**
- **Color-Coded Labels**:
- 🟢 Green for BUY signals
- 🔴 Red for SELL signals
- 🔵 Blue for ADD-ON buys
- 🟠 Orange for ADD-ON sells
- ✓ Yellow for Target hits
- **TP Level Lines**: Dotted lines showing current profit targets
- **Hover Tooltips**: Detailed information on entry prices, targets, and add-on numbers
### 📈 **Real-Time Statistics**
Live performance dashboard showing:
- Total buy and sell signals generated
- Number of add-on positions taken
- Take profit hits achieved
- Current trade status (LONG/SHORT/None)
- Cooldown timer status
### 🔔 **Comprehensive Alerts**
Built-in alert conditions for:
- Primary buy entry signals
- Primary sell entry signals
- Add-on buy positions
- Add-on sell positions
- Buy take profit hits
- Sell take profit hits
---
## 🛠️ Configuration Options
### **Time Settings**
- **Box Start Hour/Minute**: Define when to begin tracking the reference range
- **Box End Hour/Minute**: Define when to lock the reference box
- **Default**: 9:15 AM - 9:45 AM (IST) - Perfect for Indian market opening range
### **Trade Settings**
- **Target Points (TP)**: Average move distance for profit targets (default: 40 points)
- **Breakout Confirmation Bars**: Number of bars to confirm breakout (default: 2)
- **Cooldown After Trade**: Bars to wait after closing position (default: 3)
- **Add-On Distance Points**: Minimum pullback for add-on entry (default: 40 points)
- **Max Add-On Positions**: Maximum additional positions allowed (default: 3)
### **Display Options**
- Toggle buy/sell signal labels
- Show/hide trading box visualization
- Show/hide TP level lines
- Show/hide statistics table
---
## 💡 How It Works
### **Phase 1: Box Formation (9:15 AM - 9:45 AM)**
The indicator tracks the high and low prices during your specified time window to create a reference box representing the opening range.
### **Phase 2: Breakout Detection**
After the box is locked, the system monitors for:
- **Bullish Breakout**: Price closes above box high for confirmation bars
- **Bearish Breakout**: Price closes below box low for confirmation bars
### **Phase 3: Signal Generation**
When confirmation requirements are met:
- Entry signal is generated with clear visual label
- Target price is calculated (Entry ± Target Points)
- Position tracking activates
- Cooldown timer starts
### **Phase 4: Position Management**
During active trade:
- **Add-On Logic**: If price pulls back by specified distance but stays within favorable range, additional entry signal fires
- **Target Monitoring**: Continuously checks if price reaches TP level
- **Box Adjustment**: After TP hit, box automatically shifts to new range for next opportunity
### **Phase 5: Trade Exit & Reset**
On target hit:
- Position closes with TP marker
- Statistics update
- Box repositions for next setup
- Cooldown activates
- System ready for next signal
---
## 📌 Best Use Cases
### **Ideal For:**
- ✅ Intraday breakout trading strategies
- ✅ Algorithmic trading systems (via alerts/webhooks)
- ✅ Opening range breakout (ORB) strategies
- ✅ Index futures (Nifty, Bank Nifty, Sensex)
- ✅ High-liquidity stocks with clear ranges
- ✅ Automated trading bots
- ✅ Scalping and day trading
### **Markets:**
- Indian Stock Market (NSE/BSE)
- Futures & Options
- Forex pairs
- Cryptocurrency (adjust timing for 24/7 markets)
- Global indices
---
## ⚙️ Integration with Algo Trading
This indicator is **algo-ready** and can be integrated with automated trading systems:
1. **TradingView Alerts**: Set up alert conditions for each signal type
2. **Webhook Integration**: Connect alerts to trading platforms via webhooks
3. **API Automation**: Use with brokers supporting TradingView integration (Zerodha, Upstox, Interactive Brokers, etc.)
4. **Signal Data Access**: All signals are plotted for external data retrieval
---
## 📖 Quick Start Guide
1. **Add Indicator**: Apply to your chart (works best on 1-5 minute timeframes)
2. **Configure Time Window**: Set your desired box formation period
3. **Adjust Parameters**: Tune confirmation bars, targets, and add-on settings to your trading style
4. **Set Alerts**: Create alert conditions for automated notifications
5. **Backtest**: Review historical signals to validate strategy performance
6. **Go Live**: Enable alerts and start receiving real-time trading signals
---
## ⚠️ Risk Disclaimer
This indicator is a **tool for analysis** and does not guarantee profits. Trading involves substantial risk of loss. Always:
- Use proper position sizing
- Implement stop losses (not included in this indicator)
- Test thoroughly before live trading
- Understand market conditions
- Never risk more than you can afford to lose
- Consider your risk tolerance and trading experience
**Past performance does not indicate future results.**
## 🔄 Version History
**v1.0** - Initial Release
- Dynamic box formation system
- Confirmed breakout signals
- Add-on position management
- Visual signal labels and statistics
- Comprehensive alert system
- Auto-adjusting target boxes
---
## 📞 Support & Feedback
If you find this indicator helpful:
- ⭐ Please leave a like/favorite
- 💬 Share your feedback in comments
- 📊 Share your results and improvements
- 🤝 Suggest features for future updates
---
## 🏷️ Tags
`breakout` `daytrading` `signals` `algo` `automated` `intraday` `ORB` `opening-range` `buy-sell` `scalping` `futures` `nifty` `banknifty` `algorithmic` `box-strategy`
*Remember: The best indicator is combined with proper risk management and trading discipline.* Use it at your own rist, not as financial advie


Long‑only Swing/ScalpThis is a basic scalper stategy for algos or crypto bots, tested on BNB, not the best backtest but you can tweak and get better results. Take profit at 1% and Sl at 2% , adjust those settings first to see different back test resutls.

HAZ_10FSuper Trends Bot 10Frams .
A custom indicator that displays enhanced candles with a dynamic signal line and ATR-based alerts.
It highlights market direction using color-coded bars and provides clear buy/sell signals for entries and exits.
Designed for traders who want quick signals and smoother price action with reduced market noise.

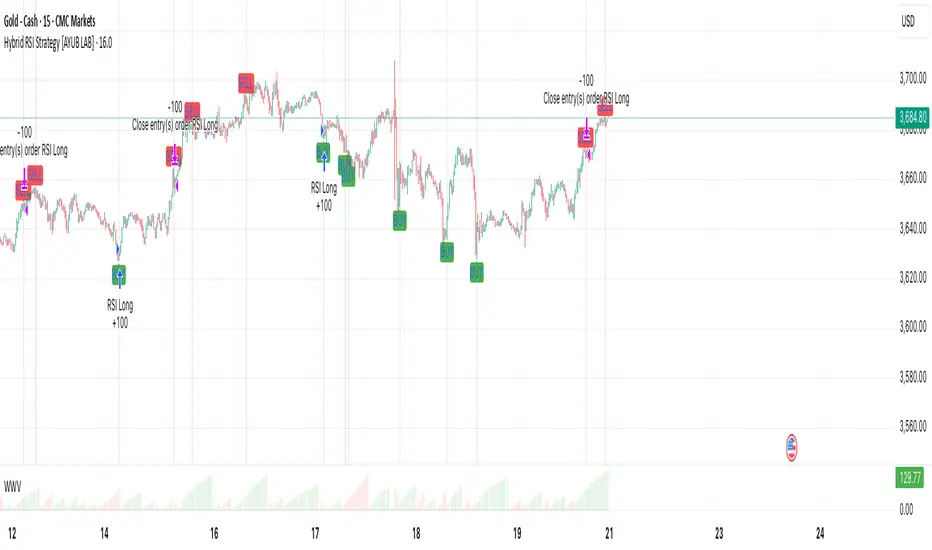
Hybrid RSI Strategy [Heifereum ]This is a hybrid script that combines visual RSI indicator signals with an optional backtestable trading strategy.
BUY Entry: When RSI crosses above the oversold level (default 30)
SELL Exit: When RSI crosses below the overbought level (default 70)
Timeframe: Works best on trending assets (crypto, forex, indices) in 5min to 1H
Backtest Toggle: Turn ON/OFF live testing using the Enable Backtest Mode? setting
Visual Cues: Buy/Sell labels, background coloring, and alerts ready for webhook automation
Use this strategy to visually explore RSI dynamics, run performance backtests, or hook up to external bots via alerts.