ADOL_ BOT SYSTEM(ABS)English))
ADOL_ BOT SYSTEM(ABS) : : Entry, Stop Loss, Profit Loss (Liquidation), Breakthrough, Push/Rebound, Support/Resistance, Wave Assistance, Trend Line Assistance, Momentum (Intensity) Signals All indicators //
Concept tree)
Entry) Long is the entry of long, and the short is the entry of short. Start trading after the signal generation peak ~ the next peak. H is the standard for HH breakthrough long and L is for LL breakthrough shot.
Stop loss) The low/high point of the signal bar becomes the stop loss at the time of entry (consider continuous flow). If the wave suddenly breaks before you start doing a profit, a stop loss or a full cut is recommended.
Liquidation) L Blue is a recommended spot for long liquidation and S Blue is a short liquidation. Even if you trade according to the trend, it is recommended to liquidate in installments (or total liquidation) when a liquidation signal occurs.
Use) You can draw a trend line according to the wave flow. The small shape of the wave assists the flow of the wave. Check the down-long and up-short signals, and determine the advantageous section.
Support/Resistance) The support/resistance line is a high probability of an inflection point, but it is often the baseline for a limit trade because it can be retested.
Application) The support/resistance line exerts a strong effect when it is overlapped with the ghost candle and box circle.
Explained by chart:
한국어))
아돌봇시스템(ABS) : : 진입, 손절, 익절(청산), 돌파, 눌림/반등, 지지/저항, 파동보조, 추세선 보조, 모멘텀(강도) 신호 전부 표시기 //
개념트리)
진입) 롱은 롱의 진입, 숏은 숏의 진입 시그널입니다. 시그널 발생봉 ~ 다음봉 이후 거래를 시작합니다. H는 HH돌파롱, L은 LL돌파숏의 기준이 됩니다.
손절) 시그널봉의 저점/고점은 진입시의 손절가가 됩니다(연속된 흐름 고려). 익절을 하기전에 갑자기 웨이브가 깨지면 손절이나 본절이 추천됩니다.
청산) L청은 롱의 청산, s청은 숏의 청산 추천자리입니다. 추세를 따라 트레이딩을 하더라도 청산시그널 발생시 분할청산(or전량청산)을 권장합니다.
활용) 웨이브의 흐름에 맞춰 추세선 긋기를 할 수 있습니다. 웨이브의 작은형은 파동의 흐름을 보조합니다. 내림롱, 오름숏 시그널을 확인하고, 유리한 구간을 판단합니다.
지지/저항) 지지/저항선은 높은 확률의 변곡점이지만, 종종 리테스트를 할 수 있기 때문에 지정가 매매의 기준선이 됩니다.
응용) 지지/저항선은 고스트캔들, 박스권과 중첩시 강력한 효과를 발휘합니다.
차트로 설명 :
use and more strategy - send PM (더 많은 전략과 사용 - PM보내기) ▼ ▼ ▼ ▼
"bot" için komut dosyalarını ara

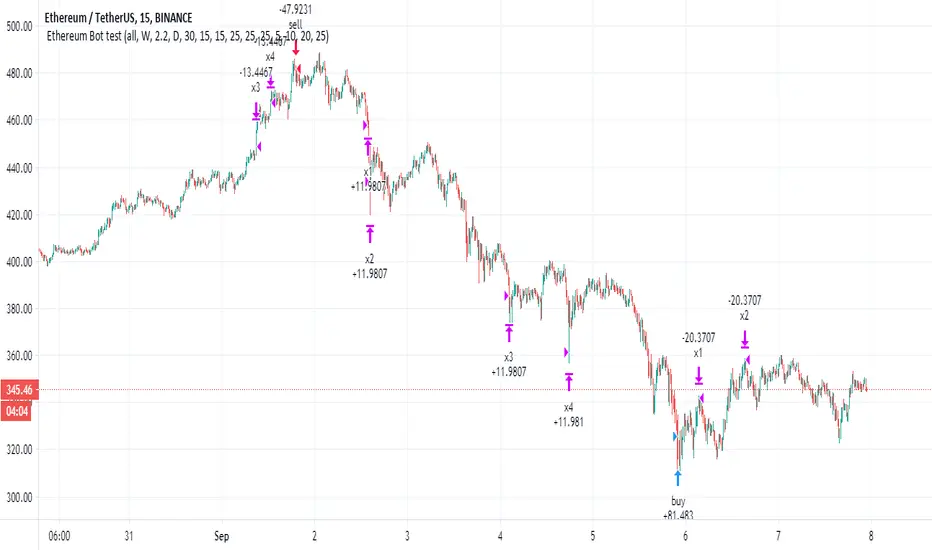
Ethereum Bot testThis bot design for etherum mainly on binance hence its name
similar to early versions it has buy system based on modified low scanner strategy that you can find in my list of indcators as free ones
exit is by take profit or exit long% profit or short by pivot -fiv system
you can set to long or short or both
suppose to work on all TF with no restriction
you can rebuy with smart stop loss that allow you to buy again from your early long that you took
for different assets you need to optimise in order to find best settings
i set this one for 15 min cahart , but it actualy work very nice on all TF
in future i will put study version that fit the strategy exact
the factor control the fibs -pivot exit system
HTF control the buy system
all MTF is no repainting one
if you want this setting just click in menue on rebuy and long exit and direction all
for difrent TF , it may bettter to be without it , buy for 5-30 min chart seems to be very good
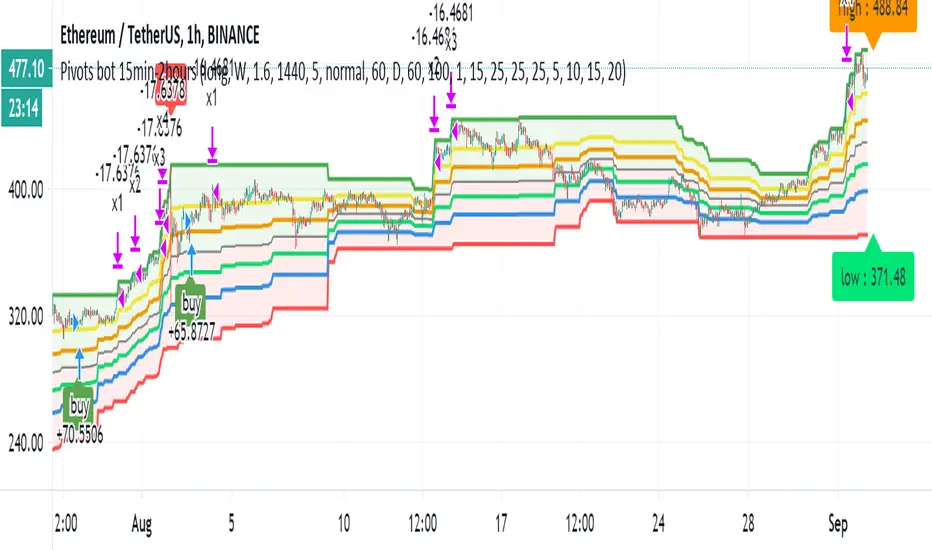
Pivots bot 15min-2hoursThis strategy is non repainting one. no security attatch to exept for non repaint pivots where we must use security .
The strategy work on candles from 15 min to 2 hours, you need to choose what best for you .
the strategy based on 3 parts -Low scanner
traditinal weekly pivots (not shown ) but exist in menue as HTF
donchian channel fibs shown in script with panel to show upper and lower
there is stop loss set here to 15%
take profit set to 5%,10-15-25% where you take 1/4 of profit each time .
in the future I will make i hope on a website that i plan a study version of this and many others which will be as premium stuff for those who want real working strategies (one of my plans)
as you go from 15min to 2 hour the % of profit go up but alos the % of loss
the strength of strategy depend on the take profit . also it a fact that crypto on the rise now so this strategy is very proftible for longs not so for shorts.
in case of bear market I have other strategy for it so maily will be for shorts less for longs
there is leveage option set now to 1
the lot is 100% but in real life we never put such. in case you plan to do leverage then please do not put all your money just portion which is 1-10% of your money and then choose your leverage
so let me know what you think
this strategy is a proof that we can create great non repainting bots that actually make money if they are used correctly
let me know what you think on it
Donchian Channel Strategy [for free bot]
I present to you a script for testing the Donchian channel breakout strategy for the Binance_exchange.
This strategy is trending, and is especially effective for trading cryptocurrency futures.
This strategy is very flexible, and you can configure virtually all possible parameters, moreover, separately for longs and separately for shorts.
In the script, you can configure the parameters of the channel for entry and exit, the exit method, enable or disable purchases / sales, specify take profit and stop loss, and more.
On the example of optimization, only 20% of the deposit is used. This is done for diversification, since there are 37 contracts on binance_futures (at the time of writing the script description). That is, by optimizing the parameters for different currencies, you can very well reduce risks.
Представляю Вам скрипт для тестирования стратегии пробоя канала Дончиана для биржи Бинанс.
Данная стратегия относится к трендовым, и особенно эффективная на торговли криптовалютных фьючерсов.
Данная стратегия очень гибкая, и можно настроить фактически все возможные параметры, при чем, отдельно для покупок и отдельно для продаж.
В скрипте можно настроить параметры канала на вход и на выход, метод выхода, разрешить или запретить покупки/проаджи, указать тейк-профит и стоп-лосс и другое.
На примере оптимизации используется всего 20% от депозита. Это сделано для диверсификации, так как на фьючерсах бинансе присутсвует 37 контрактов (на момент написания описания скрипта). Т.е., оптимизировав параметры под разные валюты, можно очень хорошо снизить риски.

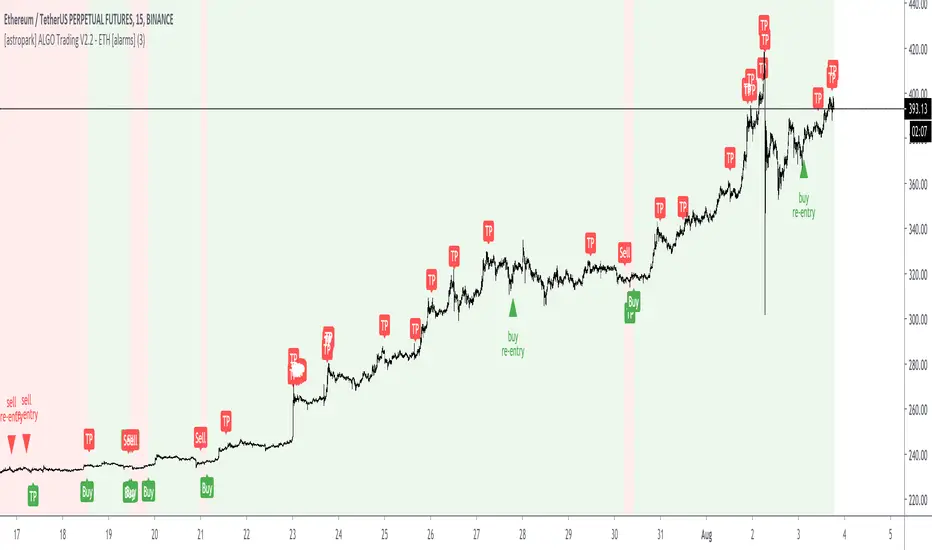
[astropark] ALGO Trading V2.2 - ETH [alarms]Dear Followers,
today another awesome Swing and Scalping Trading Strategy indicator : the upgraded version of ALGO Trading V2 for Binance Ethereum PERP on 15m timeframe!
It is runnable on a bot , just write me in order to help you do it.
If you are a scalper or you are a swing trader, you will love suggested entries for fast and long-lasting profit.
Keep in mind that a proper trailing stop strategy and risk management and money management strategies are very important (DM me if you need any clarification on these points).
This is an upgrade version of ALGO Trading V2 for Ethereum.
You can find ALGO Trading V2 indicator here below:
If you are interested in Bitcoin Trading, you will like for sure ALGO Trading V1.2, which is a customized version for Bitcoin trading:
This strategy has the following options:
enable/disable signals on chart
enable/disable bars and background coloring based on trend
enable/disable a Filter Noise option, which reduces overtrading
enable/disable a Trailing Stop option
enable/disable/config a Take Profit option, with Re-Entry
enable/disable a secret Smart Close Option which may improve profit on your chart (again, check it on you chart if it helps or not)
This strategy only trigger 1 buy (where to start a long trade) or 1 sell (for short trade). If you enable Take Profit / Stop Loss option, consider that many TP can be triggered before trend reversal, so take partial profit on every TP an eventually buy/sell back lower/higher on RE-ENTRY signal to maximize your profit.
This script will let you set all notifications you may need in order to be alerted on each triggered signals.
The one for backtesting purpose can be found by searching for the astropark's "ALGO Trading V2.2" and then choosing the indicator with "strategy" suffix in the name, or you can find here below:
This is not the "Holy Grail", so use proper money and risk management strategies.
This is a premium indicator , so send me a private message in order to get access to this script.
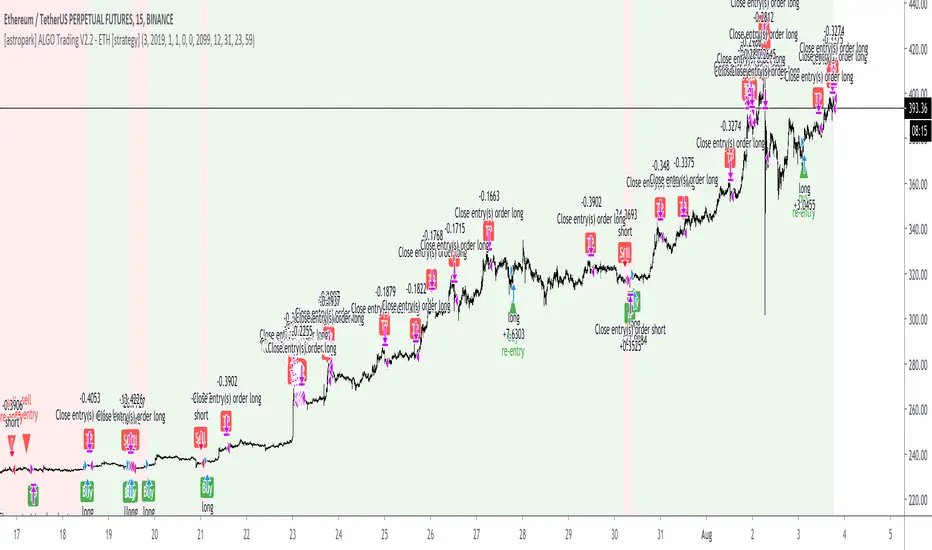
[astropark] ALGO Trading V2.2 - ETH [strategy]Dear Followers,
today another awesome Swing and Scalping Trading Strategy indicator : the upgraded version of ALGO Trading V2 for Binance Ethereum PERP on 15m timeframe!
It is runnable on a bot , just write me in order to help you do it.
If you are a scalper or you are a swing trader, you will love suggested entries for fast and long-lasting profit.
Keep in mind that a proper trailing stop strategy and risk management and money management strategies are very important (DM me if you need any clarification on these points).
This is an upgrade version of ALGO Trading V2 for Ethereum.
You can find ALGO Trading V2 indicator here below:
If you are interested in Bitcoin Trading , you will like for sure ALGO Trading V1.2, which is a customized version for Bitcoin trading:
This strategy has the following options:
enable/disable signals on chart
enable/disable bars and background coloring based on trend
enable/disable a Filter Noise option, which reduces overtrading
enable/disable a Trailing Stop option
enable/disable/config a Take Profit option, with Re-Entry
enable/disable a secret Smart Close Option which may improve profit on your chart (again, check it on you chart if it helps or not)
This strategy only trigger 1 buy (where to start a long trade) or 1 sell (for short trade). If you enable Take Profit / Stop Loss option, consider that many TP can be triggered before trend reversal, so take partial profit on every TP an eventually buy/sell back lower/higher on RE-ENTRY signal to maximize your profit.
Strategy results are calculated on the time window from December 2019 to now, so on more than 7 months, using 1000$ as initial capital and working at 1x leverage (so no leverage at all! If you like to use leverage, be sure to use a safe option, like 3x or 5x at most in order to have liquidation price very far).
This is not the "Holy Grail", so use proper money and risk management strategies.
In order to get notified when a signal is triggered, you need to use the "alarms" version of this indicator (just search for astropark's "ALGO Trading V2.2 - ETH" indicator and choose the one with "alarms" suffix).
This is a premium indicator , so send me a private message in order to get access to this script.
Channel Break [for free bot]I present to you a script for testing the channel breakout strategy for the Bitmex exchange.
Cryptocurrency itself is a trending tool, which is why breakout strategies generate the largest profits, and the channel breakout strategy is one of the most effective trend strategies.
The optimization result shows the result of trading on a volume of 20% of the deposit. But since Bitmex trades in futures contracts, you can use 50%, 100% and even much more, depending on your attitude to risk.
At the time of publication on the Bitmex exchange there are 12 different contracts, i.e. You can diversify your trading well (by pre-optimizing the settings for each contract).
In the script, you can set up many trading options - timeframe, periods for buying and selling, method of exiting a trade, stop loss, take profit, risk management, etc.
Thus, you create a strategy "for yourself".
Представляю Вам скрипт для тестирования стратегии пробоя канала для биржи Битмекс.
Криптовалюта, сама по себе является трендовым инструментом, именно поэтому, пробойные стратегии генерируют самую большую прибыль, а стратегия пробоя канала – является одной из самых эффективных трендовых стратегий.
На результате оптимизации показан результат торговли на объеме в 20% от депозита. Но так как на Битмекс торговля идет фьючерсными контрактами, Вы можете использовать 50%, 100% и даже намного больше, в зависимости от Вашего отношения к риску.
На момент публикации на бирже Битмекс есть 12 разных контрактов, т.е. Вы можете хороши диверсифицировать свою торговлю (предварительно оптимизируя настройки по каждый контракт).
В скрипте Вы можете настроить множество вариантов торговли - таймфрейм, периоды для покупки и продажи, метод выхода из сделки, стоп-лосс, тейк-профит, рискменеджмент и т.п.
Таким образом Вы создаете стратегию "под себя".

Rsi BotOk This is MTF RSI bot
it has two way to approach it . one is strict with no repaint at all , just click to remove the repaint in the menu .
its still make profit but sure not crazy unrealistic one:)
The other option is the "repaint version" which is under my special repaint control system (not perfect but since we can never truly control the repaint the signal may be not perfect ) , but in general it not so much repainting :)
to verify just use the bar control to see how it work.
the buy and sell depend on the rsi crossing oversold and overbought level that you can control in the menu
Also in the menu you see a factor . this has two function . since it based on % , when you buy you want to be buying in upswing
so let factor let say of 0.8 (is 0.8% above the entry ) this to make sure we buy in upswing and vice versa when we sell. this to correct many wrong entry of the rsi . the other function is important in the repainting model since it reduce the repainting by allot.
the min distance in menu is to control the difference between the two rsi (red color and the blue color= slow and fast)
for Forex i find factor of 0.1 % in the repaint model to work find
on Crypto best is between 0.5 to 1
there is option to check and see if stop loss and take profit improve your profit or not (i put both on very high level so it will not be a factor but you can change it as you wish
you can test to see if it better to go longs or shorts in this model or both direction
i put the setup of 50% eqiuty maybe it too much but it you choice if you test the model to reduce it to proper amount (best is 10-30%)
The repainting model is much more profti but does not matter what i do to correct it is sometime repaint. most of time it actual work fine so it your choice if you want to use it or not . just be sure on what you are doing if you put money on it
the non repaint model is much more safe nut much less profit. still it can make profit with proper setting can work very nice
so if you are not sure what you doing the use the more stable one and remove the repaint in the option
if you have any question just pm or write remarks

[astropark] ALGO Trading V1.2 [alarms]Dear Followers,
today another awesome Swing and Scalping Trading Strategy indicator : the upgraded version of ALGO Trading V1 for Binance Bitcoin PERP on 15m timeframe!
It is runnable on a bot , just write me in order to help you do it.
If you are a scalper or you are a swing trader, you will love suggested entries for fast and long-lasting profit.
Keep in mind that a proper trailing stop strategy and risk management and money management strategies are very important (DM me if you need any clarification on these points).
This strategy has the following options:
enable/disable signals on chart
enable/disable bars and background coloring based on trend
enable/disable a Filter Noise option, which reduces overtrading
enable/disable a Trailing Stop option
enable/disable/config a Take Profit option, with Re-Entry
enable/disable a secret Smart Close Option which may improve profit on your chart (again, check it on you chart if it helps or not)
This strategy only trigger 1 buy (where to start a long trade) or 1 sell (for short trade). If you enable Take Profit / Stop Loss option, consider that many TP can be triggered before trend reversal, so take partial profit on every TP an eventually buy/sell back lower/higher on RE-ENTRY signal to maximize your profit.
This is not the "Holy Grail", so use proper money and risk management strategies.
This indicator will let you set all alerts you need in order to get notified whenever a new signal is triggered.
To check its backtesting, you should use the strategy version, that you can find by searching for "ALGO Trading V1.2" or here below:
You can check out previous ALGO Trading V1 indicator here below:
This is a premium indicator , so send me a private message in order to get access to this script.
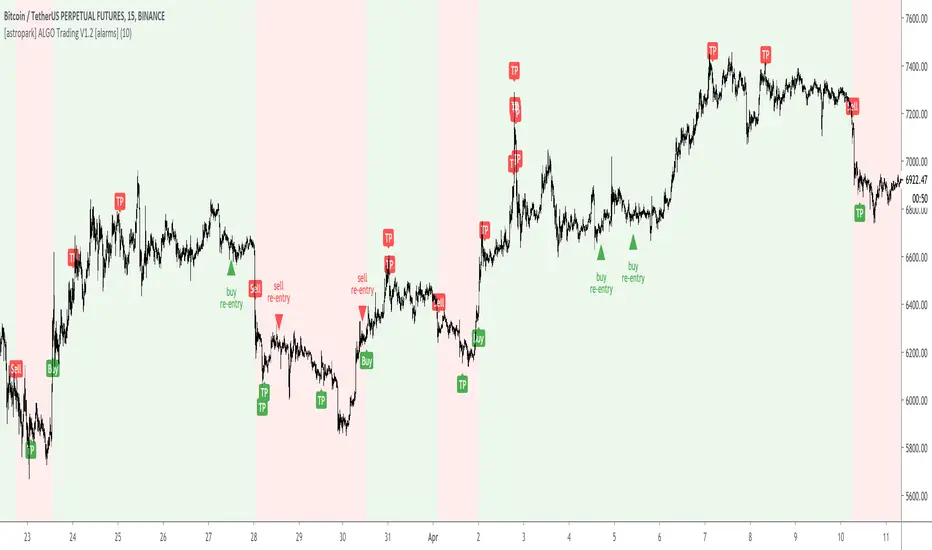
[astropark] ALGO Trading V1.2 [strategy]Dear Followers,
today another awesome Swing and Scalping Trading Strategy indicator : the upgraded version of ALGO Trading V1 for Binance Bitcoin PERP on 15m timeframe!
It is runnable on a bot , just write me in order to help you do it.
If you are a scalper or you are a swing trader, you will love suggested entries for fast and long-lasting profit.
Keep in mind that a proper trailing stop strategy and risk management and money management strategies are very important (DM me if you need any clarification on these points).
This strategy has the following options:
enable/disable signals on chart
enable/disable bars and background coloring based on trend
enable/disable a Filter Noise option, which reduces overtrading
enable/disable a Trailing Stop option
enable/disable/config a Take Profit option, with Re-Entry
enable/disable a secret Smart Close Option which may improve profit on your chart (again, check it on you chart if it helps or not)
This strategy only trigger 1 buy (where to start a long trade) or 1 sell (for short trade). If you enable Take Profit / Stop Loss option, consider that many TP can be triggered before trend reversal, so take partial profit on every TP an eventually buy/sell back lower/higher on RE-ENTRY signal to maximize your profit.
Strategy results are calculated on the time window from December 2019 to now, so on more than 7 months, using 1000$ as initial capital and working at 1x leverage (so no leverage at all! If you like to use leverage, be sure to use a safe option, like 3x or 5x at most in order to have liquidation price very far).
This is not the "Holy Grail", so use proper money and risk management strategies.
In order to get notified when a signal is triggered, you need to use the "alarms" version of this indicator (just search for astropark's "ALGO Trading V1.2" indicator and choose the one with "alarms" suffix).
You can check out previous ALGO Trading V1 indicator here below:
This is a premium indicator , so send me a private message in order to get access to this script.

ck - EMA Cross with AlertsDisplays 5 popular EMAs (you can hide any you don’t want to see from the “Styles” screen when editing the config).
Set the values for your EMAs by clicking the cog after adding this indicator to your chart.
A Long or Short signal is fired when EMA1 crosses EMA2 - a cross up is a Long signal, a cross down is a Short signal.
Connect to your Bots (3commas / 3C.exchange recommended) to automate buys and sells!

[astropark] VWAP Crosses [alarms]Dear Followers,
today a new Swing and Scalping Strategy based on WVAP , mainly designed for Bitcoin and High-Cap Cryptocurrencies, like Ethereum. It works also on Forex and Stocks.
It works great since 15m and above till 1D. I suggest you to use it on 15m, 30m or 1h timeframes .
VWAP or "Volume Weighted Average Price" is a volume-based indicator similar to a moving average.
This trading indicator is used to identify market resistance and support levels and is represented as a weighted average price for the treaded volumes.
My strategy will help you identify main support-resistance level to be careful of and it will trigger a buy or a sell depending on how price will intereact with vwaps.
green means we are in a bullish trend, in fact it start with a "buy" signal
red means we are in a bearish trend, in fact it start with a "sell" signal
blue means we are in a moment where trend may change, so be careful and always remember that taking profits is awesome and have a stoploss is a must in trading
The user who wants to use this strategy, especially via an automated bot, must always set a stoploss (example 150$ from entry on bitcoin) or use a proper risk management strategy .
This is not the "Holy Grail", so use it with caution. It's highly suggested to use a proper money management .
This script will let you set all notifications you may need in order to be alerted on each triggered signals.
The one for backtesting purpose can be found here below:
This is a premium indicator , so send me a private message in order to get access to this script.

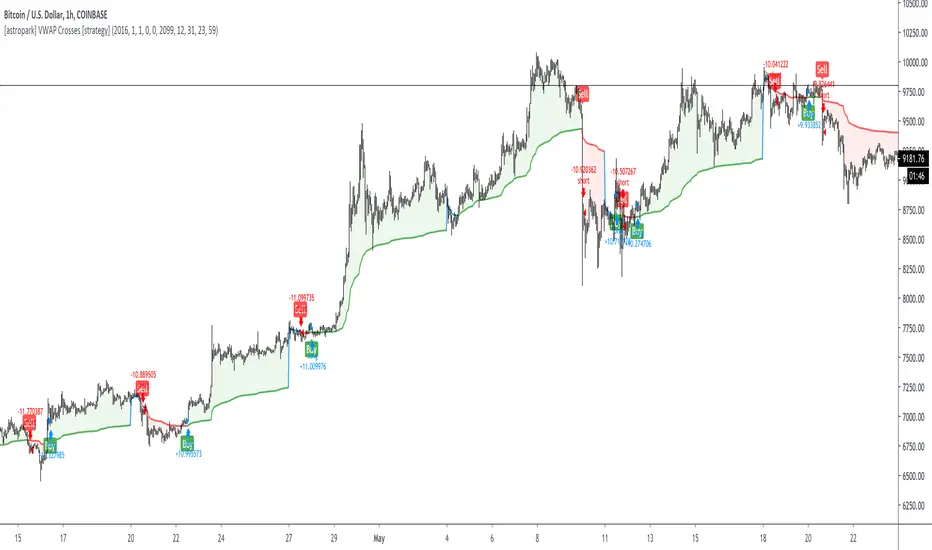
[astropark] VWAP Crosses [strategy]Dear Followers,
today a new Swing and Scalping Strategy based on WVAP , mainly designed for Bitcoin and High-Cap Cryptocurrencies, like Ethereum. It works also on Forex and Stocks.
It works great since 15m and above till 1D. I suggest you to use it on 15m, 30m or 1h timeframes .
VWAP or "Volume Weighted Average Price" is a volume-based indicator similar to a moving average.
This trading indicator is used to identify market resistance and support levels and is represented as a weighted average price for the treaded volumes.
My strategy will help you identify main support-resistance level to be careful of and it will trigger a buy or a sell depending on how price will intereact with vwaps.
green means we are in a bullish trend, in fact it start with a "buy" signal
red means we are in a bearish trend, in fact it start with a "sell" signal
blue means we are in a moment where trend may change, so be careful and always remember that taking profits is awesome and have a stoploss is a must in trading
The user who wants to use this strategy, especially via an automated bot, must always set a stoploss (example 150$ from entry on bitcoin) or use a proper risk management strategy .
This is not the "Holy Grail", so use it with caution. It's highly suggested to use a proper money management .
This script will let you backtest this script and check profitability on your preferred market.
The alarms version of this indicator, which will let you set all notifications you may need in order to be alerted on each triggered signals, can be found by searching for astropark "VWAP Crosses"
This is a premium indicator , so send me a private message in order to get access to this script.
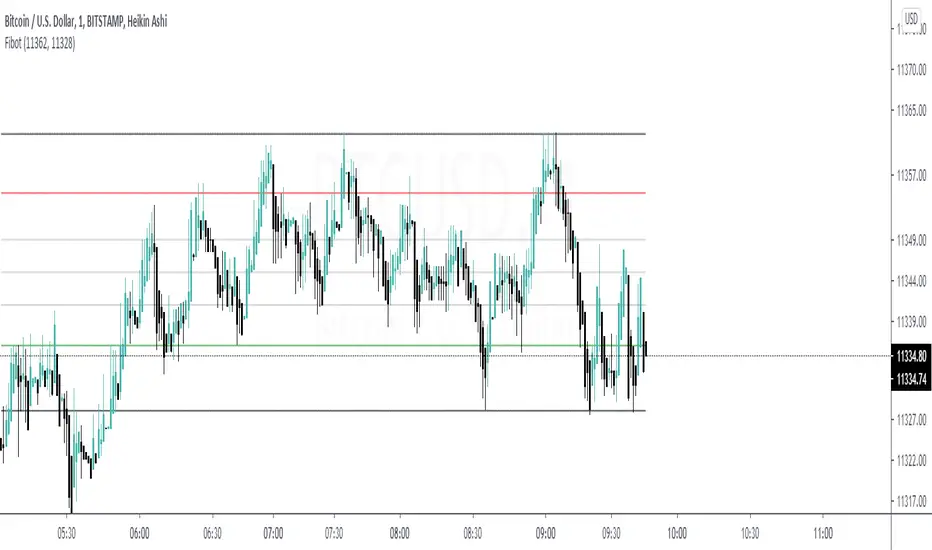
BTC GRID bot Visualisation. 31 steps/100USDT, simple adjustableBTC GRID bot Visualisation. 31 steps/100USDT, simple adjustable

Savvy Trader BotThis Script uses Customized Indicators that includes price action to determine direction. The Indicator allows full control of settings that allows you to trade a wide range of markets. This indicator has been checked against Cryptocurrencies and Forex. The indicator will print a long or short signal for entry along with a Moving Stoploss and two Take profit targets.

BoilerRoomColdCaller - 3Commas Grid Bot SignalThis is very similar to 3Commas' grid bot, the range is from the previous 7 days' lowest low decreased by 3% to the previous 7 days' highest high increased by 3%, you can also adjust if you want 7 days' highest/lowest close price as your range or highest high and lowest low as your range. 10 buys and 10 sells within the range, the unit price would be (high-low)/19.
The buy signals and the sell signals will be triggered if:
- The previous close is below one specific green line (buy line), and the current close is above that specific green line, or
- The previous close is above one specific green line (buy line), and the current close is below that specific green line
Thus, whether the price is dropping below these lines or rising above these lines, a buy or sell signal will be triggered when they cross green or red lines. Your entry price will be the next open price after this candle's close reaches the lines.
Big thanks to @glaz, who helped me a lot with this script. Please give a like button and share if you like this script. Let me know if you have questions, thanks guys.

Gridbot visualizor and advisor V1.0This scripts visualizes the buy and sell levels as used by gridbots.
It also gives you some recommended settings if you want to use manual mode instead of AI mode, based on timeframe, target grid size etc.
The inputs should be pretty much self explanatory, if you have any questions feel free to drop me a message below.
Have fun, be healthy and profitable!
Jurgenvv ( aka CryptoJur)
This script uses some code or ideas from:
ck-3commas-GRID-bot-Visualisation by ChrisKaye.
How to make the status box to the right was learned from Daveatt his scripts.

hamster-bot HiDeep strategy// DESCRIPTION OF STRATEGY
HiDeep Strategy
Author foresterufa
This is a counter-trending strategy that is gradually gaining a position against the trend at the best price.
A prerequisite for completing a position is the price exit from the internal channel on the chart and the appearance of the HiDeep indicator.
The condition for closing the position is touching the opposite side of the internal channel.
A condition for facilitating closure along the middle line of the channel, with high price volatility , is that the price touches the border of the external channel.
Input signals are generated by HiDeep indicators. Closing a position by moving averages.

Pump AlertsMy very first indicator in Pine Script with two alert conditions for trading bots.
It's based on " Pump Catcher " by @ joepegler
I modified some parts, hopefully improved the usability and enabled alerts, so you can use it to trigger bots like 3commas via webhooks.
Pump Alerts 🚀 attempts to "detect moments of abnormal and accelerating increase in volume" AKA "pumps". Small and big pumps.
I recommend using it on small timeframes like 1 to 15 min and tinkering with the lookback period as well as threshold values.
Other than that it's pretty self-explanatory and beginner-friendly.
Free and Open Source. Let me know how you use it!

hamster-bot REP strategyThe strategy basically contains RSI + EMA + Parabolic = REP.
Entry: RSI
Trend Filter: EMA
Exit: Trailing Stop Parabolic

Easy Loot Trailing Stop Bot - (PSAR) StrategyHello World,
Today I am bringing you a Parabolic Stop and Reverse Strategy that uses a 5% trailing stop loss.
Tested the strategy on the 1D timeframe of Bitcoin from the time period starting from 2018 onwards.
As you may know the price in the start of 2018 for Bitcoin was around $11,000 meaning if you bought and HODL'd since then you'd be down a good %, as current price is $8650.
Below is the strategy testing results, up 844% profits in the last two years.
Easy Loot Members Only, contact me if you'd like access to the strategy.
Parabolic Stop and Reverse (PSAR) Strategy
Parabolic SAR is a time and price technical analysis tool primarily used to identify points of potential stops and reverses. In fact, the SAR in Parabolic SAR stands for "Stop and Reverse". The indicator's calculations create a parabola which is located below price during a Bullish Trend and above Price during a Bearish Trend.
Trailing Stop Loss
A trailing stop-loss order is a special type of trade order where the stop-loss price is not set at a single, absolute dollar amount, but instead is set at a certain percentage or a certain dollar amount below the market price.

[astropark] ALGO Trading V3 [alarms]Dear Followers,
today another awesome Swing and Scalping Trading Strategy indicator, runnable on a bot , which works great on many timeframes (from 1h and above is suggested), just write me in order to help you find correct settings).
It must be said that this strategy works even better on 1m Renko chart!
If you are a scalper or you are a swing trader, you will love suggested entries for fast and long-lasting profit.
Keep in mind that a proper trailing stop strategy and risk management and money management strategies are very important (DM me if you need any clarification on these points).
This is not an evolution of "ALGO Trading V1" or "ALGO Trading V2" , but a twin sister of them.
For your reference, here it is the "ALGO Trading V1" indicator
and here the "ALGO Trading V2"
This strategy has the following options:
enable/disable signals on chart
enable/disable bars and background coloring based on trend
enable/disable a "filter noise" option , which try to reduce overtrading (you can easily check it on backtesting)
enable/disable a Take Profit / Stop Loss option (you can easily check it on backtesting too)
enable/disable a secret SmartOption which may improve profit on your chart (again, check it on you chart if it helps or not)
This strategy only trigger 1 buy or 1 sell. If you enable Take Profit / Stop Loss option, consider that many TP can be triggered before trend reversal, so take partial profit on every TP an eventually buy/sell back lower/higher to maximize your profit.
This script will let you set all notifications you may need in order to be alerted on each triggered signals.
The one for backtesting purpose can be found by searching for the astropark's "ALGO Trading V3" and then choosing the indicator with "strategy" suffix in the name, or you can find here below
Strategy results are calculated on the time window from 1995 to now, so on more than 15 years, using 1000$ as initial capital and working at 1x leverage (so no leverage at all! If you like to use leverage, be sure to use a safe option, like 3x or 5x at most in order to have liquidation price very far).
This is not the "Holy Grail", so use a proper risk management strategy.
This script will let you backtest how the indicator will perform on any chart and timeframe you may like to test and/or trade. Of course results will be very different depending on the chart and timeframe you will open. I tested a lot of charts and always you can find a combination that keep this strategy in profit on swing trading style (and this means that if you can have a daily look at the chart you can always manage to maximize your profit on each trade!)
This is a premium indicator , so send me a private message in order to get access to this script.
