Accurate CCT System [rurubudong]Overview
The CCT (Consecutive Candle Trading) Bot is a powerful Price Action trading indicator that identifies high-probability trade setups based on consecutive bullish or bearish candles breaking key levels on higher timeframes.
This system helps traders:
✅ Identify strong momentum setups automatically
✅ Enter at institutional price levels (POI - Point of Interest)
✅ Trade with clear structure and confluence
✅ Avoid emotional decision-making with systematic signals
📊 How It Works
CCT Pattern Requirements
The indicator detects CCT setups when:
Two consecutive bullish candles on the higher timeframe (default 1H)
The second candle closes above the high of the first candle
A Point of Interest (POI) is created at the first candle’s high
For bearish setups, the logic reverses:
Two consecutive bearish candles
Second candle closes below the low of the first
POI created at the first candle’s low
Entry System
Entry Signal: Price crosses the POI level on lower timeframe (▲ for long, ▼ for short)
POI Validity: 90 minutes from CCT confirmation (adjustable in Premium)
Entry Mode: Cross-bar entry (previous bar touches, current bar crosses)
🆓 FREE Version Features
Core Functionality
✅ Automatic CCT Detection (1-hour timeframe)
✅ POI Lines - Visual horizontal lines showing entry zones
✅ CCT Confirmation Labels - “CCT✓” marks when pattern confirms
✅ Entry Signals - Clear ▲/▼ arrows when POI is crossed
✅ Historical Mode - Display all past CCT setups for backtesting
✅ Clean Interface - No clutter, just essential signals
Settings
CCT Timeframe: Fixed at 60 minutes
Entry Mode: Cross-bar entry
Max Entries: 1 per POI
POI Validity: 90 minutes
Perfect for: Beginners learning Price Action, traders who want simple clean signals, anyone testing the CCT methodology
💎 PREMIUM Version - Full Trading System
Advanced Features
🎯 Pending POI Detection - Gray dashed lines show potential setups BEFORE they confirm
📊 Stop Loss & Take Profit Visualization - Automatic SL/TP lines with trailing stops
🔧 Full Customization - Adjust ALL timeframes, periods, and modes
🔄 Multiple Entries - Up to 3 entries per POI for scaling in
⚡ Advanced Entry Modes - Cross-bar / Same-bar / Both required
🎚️ Two POI Modes - “Touch & Stop” or “Time Limited”
📈 Two-Stage TP System - TP1 at 50% (swing high/low) + TP2 with trailing stop
🎨 Complete Info Panel - 17 data points showing live trade status
🔔 JSON Alert System - Full webhook support for automation (Entry, TP1, TP2, SL)
🎭 Visual Feedback - Background colors showing CCT state, position status
⚙️ Dual SL Types - CCT Candle or Entry Swing based
Premium Settings Include
Any CCT Timeframe - 5m, 15m, 1H, 4H, Daily, etc.
Custom POI Duration - 10 to 300 minutes
Swing Periods - Customize SL, TP, and Trailing periods
SL Offset - Add buffer ticks to avoid stop hunting
Max 3 Entries - Scale into positions
All Colors Customizable
Info Panel (Premium Only)
Real-time display showing:
Current timeframes
POI status (None / Pending / Confirmed / Touched)
Exact POI price
Stop Loss level
Take Profit 1 & 2 levels (✓ marks when hit)
Entry count (e.g., “2/3”)
Position status (Active / None)
Trade outcome (TP1 50% / TP2 / Stop Loss)
🎓 Trading Strategy
Recommended Usage
Timeframe: Use 1-minute or 5-minute charts for entries
CCT Detection: Keep at 1-hour (or customize in Premium)
Risk Management:
Premium users: Use the automatic SL visualization
Free users: Manually set SL below/above CCT setup candles
Targets:
Premium: Automatic TP1 (50%) and TP2 (trailing)
Free: Take profit at recent swing highs/lows
Best Practices
✅ Trade in the direction of higher timeframe trend
✅ Look for CCT setups at key support/resistance levels
✅ Combine with volume confirmation
✅ Avoid trading during low liquidity periods
✅ Use proper position sizing (1-2% risk per trade)
📋 Display Modes
Active POI Mode (Default)
Shows only the current active POI line
Updates continuously as new setups form
Clean chart with minimal visual noise
Historical CCT Mode
Displays ALL past CCT setups
Great for backtesting the strategy
See historical win rates and patterns
Fixed POI length for clean visualization
⚙️ Settings Guide
FREE Version
Show CCT Labels: Toggle “CCT✓” markers
Show All Historical CCT: Enable to see past setups
Show POI Lines: Toggle POI horizontal lines
Show Entry Signals: Toggle ▲/▼ entry arrows
Colors: Customize CCT and POI colors
Historical POI Length: Adjust visual length (5-20 bars)
PREMIUM Version (Additional)
CCT Detection Timeframe: Choose any TF
POI Extension Mode: Touch & Stop vs Time Limited
Entry Cross Mode: Cross-bar / Same-bar / Both
Max Entries per POI: 1-10 entries
SL Type: CCT Candle or Entry Swing
All Swing Periods: Customize SL, TP1, TP2 calculations
SL Offset: Add tick buffer to stop loss
Show Pending POI: Gray dashed line before confirmation
Show SL/TP Lines: Visual risk management
CCT Background: Color coding for market state
Complete Alert System: JSON webhooks for automation
🔔 Alert System (Premium Only)
Available Alerts
CCT Bull Confirmed - New long setup confirmed
CCT Bear Confirmed - New short setup confirmed
Long Entry - Entered long position at POI
Short Entry - Entered short position at POI
Long TP1 - 50% take profit hit
Short TP1 - 50% take profit hit
Long TP2 - Final target hit (trailing stop)
Short TP2 - Final target hit (trailing stop)
Long Stop Loss - Stop loss triggered
Short Stop Loss - Stop loss triggered
JSON Format (Webhook Compatible)
Entry Alert Example:
{
"signal": "long",
"entry": "21245.50",
"time": "2025-01-25T10:30:00Z",
"ticker": "NQ1!"
}
TP Alert Example:
{
"signal": "tp1_hit_long",
"close_pct": 50,
"rule": "round_up",
"price": "21280.75"
}
Perfect for connecting to trading bots, Discord/Telegram notifications, or automated execution platforms.
📈 Performance Optimization
Backtesting Tips
Enable “Show All Historical CCT” mode
Replay historical data to see how setups performed
Note the POI lines and entry arrows
Track win rate and average R:R
Adjust timeframes if needed (Premium)
Live Trading
Start with small position sizes
Verify each setup matches your strategy rules
Use proper risk management
Keep a trading journal
Track statistics over 20+ trades minimum
❓ FAQ
Q: What instruments work best?
A: Futures (NQ, ES, YM), Forex majors, and liquid crypto pairs
Q: What’s the difference between Free and Premium?
A: Free gives you core CCT detection and basic signals. Premium adds pending detection, SL/TP visualization, full customization, multiple entries, and automation alerts.
Q: Can I use this for scalping?
A: Yes! Use 1-minute chart with 60-minute CCT detection for quick trades
Q: Do I need Premium for profitable trading?
A: No, the Free version contains the complete CCT methodology. Premium adds convenience, automation, and advanced risk management tools.
Q: How do I set stop losses in Free version?
A: Manually place stops below/above the CCT setup candles. Premium users get automatic SL lines.
Q: Can I backtest this?
A: Yes! Use “Show All Historical CCT” mode and TradingView’s bar replay feature
🚀 Get Started
Add to Chart - Click “Add to favorites” or apply directly
Choose Your Display - Active POI or Historical mode
Customize Colors - Make it match your theme
Start Learning - Watch for CCT✓ labels and POI lines
Upgrade When Ready - Get Premium for full automation
📞 Support & Updates
Questions? Comment below or message me directly
Feature Requests? Let me know what would help your trading
Updates - Indicator is actively maintained and improved
⚠️ Disclaimer
This indicator is for educational purposes only. Past performance does not guarantee future results. Always practice proper risk management and never risk more than you can afford to lose. Trading carries substantial risk of loss.
Upgrade to Premium:
💬 Questions or feedback? Drop a comment below!
🌟 If this indicator helps your trading, please leave a review!
"bot" için komut dosyalarını ara

Apex Adaptive RSIThe Apex Adaptive RSI is a next-generation momentum oscillator designed to solve the "lag vs. noise" problem found in traditional indicators. By utilizing an Efficiency Ratio (ER), the script dynamically adjusts its sensitivity based on current market volatility.
How it Works: Unlike a standard RSI that uses a fixed period (e.g., 14), the Apex Engine calculates the "Efficiency" of price action. In trending markets, it speeds up to catch entries early; in choppy or sideways markets, it slows down to filter out false signals. This is then smoothed using Volatility-Adjusted Heikin Ashi candles to provide a clear visual of momentum strength.
Key Features: The Apex Adaptive RSI is a high-performance momentum oscillator that replaces traditional static RSI logic with an Efficiency Ratio (ER) engine. It dynamically scales its sensitivity—speeding up to catch trend breakouts and slowing down to filter out noise during market consolidation.
Visual Guide & Features:
1. The Apex Heikin Ashi Candles Instead of a single line, momentum is visualized through HA candles.
Bright Colors (Neon Green/Red): High-velocity momentum.
Dark Colors: Waning momentum or consolidation.
Wicks: Show the "reach" of RSI before the internal smoothing takes over.
2. The Volatility Cloud (Purple Shaded Area) This is your "Market Safety Zone."
The Cloud: Represents 2 standard deviations of RSI movement.
The Logic: When the RSI candles exit this cloud, the market is in an extreme state. Divergences that occur outside or at the edge of this cloud are statistically much more likely to result in significant reversals.
3. TOP & BOT Triangles (Labels)
TOP (Red Triangle): Marks a confirmed Pivot High in momentum.
BOT (Lime Triangle): Marks a confirmed Pivot Low in momentum.
These labels appear once the "Pivot Strength" (lookback) is satisfied, confirming a structural turning point.
4. TM & BM Dots (The Apex Markers)
TM (Top Marker - Red Circle): The exact "ceiling" of an RSI pulse.
BM (Bottom Marker - Green Circle): The exact "floor" of an RSI pulse.
Trading Tip: Use these dots to draw manual trendlines or to identify "Liquidity Grabs" (where price breaks a high but the TM dot remains lower than the previous peak).
5. Divergence Lines (Customizable)
Solid Lines (Regular Divergence): Indicates a potential trend reversal.
Dashed/Dotted Lines (Hidden Divergence): Indicates trend continuation.
Historical Memory: The script retains these lines on your chart for backtesting and structural analysis.
Unified Alert System:
The script includes a "Any Divergence" alert. This allows you to set a single notification for your ticker that triggers for all four types of signals (Reg Bull, Hid Bull, Reg Bear, Hid Bear) on the close of the confirmation bar.
Adaptive Sensitivity: Automatically scales between fast and slow periods based on market speed.
Heikin Ashi RSI Candles: Integrated "Apex Candles" that change color based on momentum velocity, making trend shifts easy to spot.
Unified Divergence Engine: Automatically detects and plots Regular (Reversal) and Hidden (Continuation) divergences.
Historical Backtesting: Divergence lines remain on the chart, allowing for thorough historical analysis.
Volatility Bands: Real-time statistical "Guardrails" (Bollinger-style) that identify extreme overbought and oversold conditions.
Smart Alerts: A unified "Any Divergence" alert that notifies you the moment a signal is confirmed.
How to Trade:
Reversals: Look for Regular Divergence when the RSI is outside the Volatility Bands.
Trend Following: Use Hidden Divergence (dashed lines) as high-probability entries in an existing trend.
Momentum: Watch the Apex Candle colors; a shift from dark to bright green/red indicates a "Pulse" in momentum.
Enjoy
Cemmec

Pitchfork Long Strat x Mizar🎯 Advanced DCA Strategy with Nadaraya-Watson Envelope for Mizar Integration
This strategy combines the sophisticated Nadaraya-Watson kernel regression indicator with an intelligent DCA (Dollar Cost Averaging) system, specifically designed for automated trading via Mizar webhooks.
═══════════════════════════════════════════════════════════
📊 KEY FEATURES
✓ Nadaraya-Watson Envelope Indicator
- Adaptive regression bands that follow price trends
- ATR-based dynamic upper/lower bands
- Customizable lookback windows and weighting
✓ Intelligent DCA System
- Exponential scaling of price thresholds (default 1.9x per level)
- Exponential scaling of order sizes (default 1.6x per level)
- Up to 20 configurable safety orders
- Minimum bars between orders to avoid overtrading
- Tracks average entry price across all orders
✓ Flexible Stop Loss Options
- Percentage-based stop loss
- ATR-based dynamic stop loss
- Always calculated from average entry price
✓ Optional Trailing Buy
- Separate settings for initial entry and DCA orders
- Helps capture better entry prices during pullbacks
✓ Full Mizar Integration
- Pre-configured webhook messages for all actions
- Automatic base asset extraction from ticker
- Separate TP settings for backtesting vs. live trading
- Supports open position, activate safety orders, edit TP, and close position
✓ Professional Backtesting
- Real-time position tracking with visual entry/exit labels
- Info table showing avg entry, TP, SL, and P&L
- Tracks average bars in winning trades for optimization
- Commission-inclusive (0.06% default)
═══════════════════════════════════════════════════════════
🎲 HOW IT WORKS
ENTRY SIGNAL:
- Triggers when price crosses above the lower Nadaraya-Watson band
- First order: Fixed size (default $10 USDT)
- Subsequent DCA orders: Exponentially scaled based on your settings
DCA LOGIC:
- Each safety order requires price to drop by an exponentially growing percentage
- Example with 2.1% base deviation and 1.9x scale:
• Order 1: Initial entry
• Order 2: -2.1% from Order 1
• Order 3: -3.99% from Order 2 (2.1% × 1.9)
• Order 4: -7.58% from Order 3 (2.1% × 1.9²)
• And so on...
EXIT SIGNALS:
- Take Profit: Fixed percentage above average entry
- Stop Loss: Percentage or ATR-based below average entry
═══════════════════════════════════════════════════════════
⚙️ RECOMMENDED SETTINGS
For BTC/ETH (Lower Volatility):
- DCA Price Deviation: 2.0-2.5%
- DCA Step Scale: 1.8-2.0
- DCA Volume Scale: 1.5-1.7
- Max Safety Orders: 4-6
- Stop Loss: 30-40%
For Altcoins (Higher Volatility):
- DCA Price Deviation: 2.5-3.5%
- DCA Step Scale: 1.9-2.2
- DCA Volume Scale: 1.6-1.9
- Max Safety Orders: 5-8
- Stop Loss: 40-60%
═══════════════════════════════════════════════════════════
🔗 MIZAR SETUP
1. Create a DCA bot on Mizar
2. Copy your Bot ID and API Key
3. Enter them in the "Mizar Webhook" settings
4. Set your Quote Asset (USDC/USDT)
5. Create alert with webhook URL: api.mizar.com
6. Set alert message to {{strategy.order.alert_message}}
7. Make sure "Webhook URL" option is checked
═══════════════════════════════════════════════════════════
⚠️ IMPORTANT NOTES
- This is a LONG ONLY strategy
- Always backtest on your specific asset/timeframe before going live
- Start with conservative settings and adjust based on results
- Monitor your "Avg Bars in Winning Trades" to optimize entry/exit
- The strategy calculates all percentages from your average entry price
- Recommended timeframes: 15m, 1h, 4h (avoid < 5m due to noise)
═══════════════════════════════════════════════════════════
📈 IDEAL FOR
- Cryptocurrency spot trading
- Medium to long-term position building
- Automated trading via Mizar
- Bull market accumulation strategies
- Traders who want to average into positions systematically
═══════════════════════════════════════════════════════════
💡 TIPS FOR SUCCESS
1. Use higher timeframes for more reliable signals
2. Adjust ATR multiplier based on asset volatility
3. Keep total position size (all DCA orders) within risk tolerance
4. Monitor the "Position Value" in the info table
5. Consider market conditions when setting TP/SL levels
═══════════════════════════════════════════════════════════
Created by Pitchfork| Modified for Mizar DCA Integration
For questions or support, please comment below!
#Mizar #DCA #NadarayaWatson #CryptoStrategy #AutomatedTrading

Universal Signal Trading Tool : Single TargetInternal V 128.0
Overview
This script by maurya_algo_trader is designed for four major things
Connect external buy/sell entry signal (from indicator) as well as optional exit signal (bool as well as limit) if available
SL/Target/TSL : Set various types of Target, Stoploss and trailing stoploss through this script
Trade/Risk Managements : Control the no of trades, day or month profits or loss etc.
Time managements : Sessions for trade timings
Execute trades (Equity, Futures and Options) on various brokers (Currently available for Dhan, Flattrade, 5Paisa, Anand Rathi and Delta exchange) automatically via webhook features through only single alerts
(currently available only for indian market : NSE, BSE, MCX and Delta exchange India crypto)
How to Connect External Signals for Entry, Exit(optional)
To connect external signals it is mandatory that the external signal script must be in the form of an “indicator” (Not in strategy).
In the tradingview community indicator you can find readymade indicator buy/sell signals (e.g. ut bot alerts). Mostly the buy/sell signal plotted via plotshap() function which gives the particular value (mostly: 1). This can be seen in “Data Window” (Right side of Tradingview just below the alert section). When you keep the cursor on the candle at buy or sell signal, it gives the value “1” and on the rest of the candles it will be “0”.
In Settings/Input tab you will find “EXTERNAL ENTRY” section where you can select the buy signal in drop down menu of “External Ling Entry Signal” and in same line default value 1 is already present (You can change it if plotted signal showing any other numbers for Buy signal). Similarly Choose sell signal in drop down menu of “External Short Entry Signal”. It also has the same “1” value by default but if it is different like” -1” you can change it manually.
If you have your own strategy, you need to convert it into an indicator first by removing the strategy function from the entire script (if you know the pine script coding or you can message me for the same). Then set the variable for the logic (bool condition) of long entry and short entry. And then plot the logic by following pine codes :
long_entry_cond = *your long condition logic variables (unique bool condition)*
short_entry_cond = *your short condition logic variables (unique bool condition)*
plot(long_entry_cond ? 1 : 0, '✅✅Long Entry Connector✅✅', display = display.data_window)
plot(short_entry_cond ? 1 : 0, '⛔⛔Short Entry Connector⛔⛔', display = display.data_window)
This will create the external plots which can be retrieved in the dropdown menu of “EXTERNAL ENTRY”.
If you have any external exits (other than opposite entry) you can use them similarly in sections of “EXTERNAL EXIT”. If you have any Take profit or take SL (at limit price) then it can also be retrieved in External TAKE PROFIT and EXTERNAL TAKE SL section by selecting the appropriate option in the dropdown menu.
Once proper signal attachment done with dropdown menu, you can see various entry exit labels like : “Long Entry”, “Short Entry”, “Long Exit” and “Short Exit”.
In addition to original entry, advance entry options are available like : “Entry at second candle of the day if no position”; “Entry at high/low breakout of actual Buy/Sell candle”; and “Add buffer to high/low of buy sell candle in points/percentage (inputs).
SL/Target Settings
By default, target and SL are off.
You can select various target types below and set the value accordingly (additional multiplier input available to optimize various interval of target level) :
Value (INR 1000 : not applicable of Index);
Percentage,
Points,
R:R (Multiplier of SL (Point/Percentage) );
No of Bars: Exit at set no of bars after entry.
Various stoploss types available like :
Value (INR 1000 : not applicable of Index);
Percentage,
Points,
Low/High During entry : A fix SL as low or high of no of candle back
Following options are one kind trailing Stoploss
HH/LL of period of candle : As candle moves ahead fix length of candle’s low or high move a one kind of trailing stoploss
ATR : Supertrend as trailing SL you need to add length and multiplier in respective input tabs
Pivot : This is the pivot point of right and left side candles length (low for long side and high for short) add left and right side candle length in respective input tabs.
Opposite band of Bollinger : Lower Band for Long Side and Upper band for Short side
TSL settings
TSL settings have the following types of options. By default it is off. This section is specifically designed to activate TSL after some market achieved some distance from its entry and TSL can be started from desired distance from entry or SL.
High/Low : It trails by distance of previous to new high created after entry
Step : It trails by by given inputs of distance: at every 50 points trails 50 points
Pivot/HH/LL od period of candle, ATR, opposite band of Bollinger these options are same as available in Stoploss section. The difference is only You can choose where the TSL is activated where it start from that you can decide in section.
Trade/Risk Managements
Trade direction : Both/Only Long/ Only short
Reverse Trade : You can reverse the trade if SL/TSL hit if it is in loss/profit options
Skip Opposite trade: If SL and Target or TSL is set then you can skip opposite trade until your SL/Target or TSL hit
Close trade if profitable at no of candle new highest close (for long) and lowest close (for short)
Max no of orders per day
Max Profit Per day
Max loss per day
Max Profit per month
Max Loss per month
Kill All Trades on chart
This option enables you to take only fresh entries after creating the alert. So many times Trade is running on chart and still we have not taken any order or created alert and I want a fresh entry signal (with any exit signal of previous entry). So for that you need to set the current date and times after the last entry on the chart. This will show you a pink color vertical draggable line. Before the pink line all signals disappear. Only after that you have to create an alert to take trade.
Date Filter
This filter is enabled to backtest from a specific date. But remember that date should not be beyond the unavailable candles on the chart. For Deep backtest you must use the tradingview premium plan feature in the strategy section.
Always unclick this option if you are trading via webhook
Time Management
Auto square off on click option available for NSE, NSE and MCX symbols, where mostly between 15:00 to 15:30 hours for NSE/BSE and 23:00 to 23:30 hours for MCX depending upon timeframe.
Upto two sessions you can set for trading: 0000 to 0000 means continue trading without any time restriction: Always set in 24 hour format. Input always shows in candles opening time instead of closing time.
Example
Trade timing : 09:30 - 15:00 (All entry and exit as per logic)
Squareoff timing : 15:00 – 15:30 (Only Exit happen at first candle close between 15:00 to 15:30, for 1 min TF it square off on 15:01, for 5 min TF 15:05 and for 15 min TF 15:15)
Algo Settings
Select broker : Dhan, Flattrade, 5Paisa,Anand Rathi, Delta Exchange
Instrument: Option, Future, Equity (What are you trading?)
For Future always use 1! (for current month) and 2! (for next month expiry) symbol chart (eg. NIFTY1! Or NIFTY2!)
Order type: Delivery (carry forward), Intraday ( Always set autosquare off of square off settings in time management). This selection also affects signals on the equity chart, Intraday shows both long and short signals while Delivery option shows only long side signals because in equity short trade is not allowed in delivery.
Quantity: for equity use no of shares that you what to trade, for future and options always use no of lot: enter 1 for 1 lot (please do not use lot size).
Client ID: You need to add client Id if you use broker Flattrade or Anand Rathi
Secret key from Json : Paste secret code for Dhan/Flattarde/Anand Rathi while strategy Id for delta exchange, no need of secret code for 5 paisa.
Secret code for Dhan: Order/Webhook/ Manage/ select webhook expiry/ creat webhook/ add any script/ creat json/ copy secret code from json without any inverted coma
Secret code from Flattrade: Order/webhook/login to creat webhook/ copy code from json (longer in character)
Strategy Id for Delta exchange : Algo/trading bot/Creat webhook/OTP-2FA-submit/ copy strategy id from json
deltaexchangeindia.freshdesk.com
Option settings
If you are trading options then select OPTION in instrument.
Option Buyer or seller: If you are option buyer then by default it is OPT BUYING
OPT BUYING: buy CE when long entry and buy PE when short entry on index chart, while it shows only long trades on option premium chart
OPT SELLING: sell PE when long entry and sell CE when short entry on index chart, while it shows only short trade on option premium chart
BOTH: This option is only used when you want to trade both long (Option Buying) and short signal (Option Selling) on option premium charts. Do not use on index chart; this is exclusively for option premium chart.
Strike selection : ATM : At the money, OTM: out of the Money (low Premium), ITM : In the money (Higher Premium)
You can trade the strike in multiple of your choice like in Nifty strike difference is 50 , but if dont want to trade 50 multiple strike 25850 or 25950 and you only want to trade 25800, 25900 then click on that option and enter strike difference 100.
Set expiry: for NSE and BSE according to instrument it has specific expiry day
Current Auto Expiry : Nearest expiry date (tuesday for NSE and thursday for BSE) for nifty50 current week tuesday and for Banknifty Current month last tuesday.
Current week/Next week/Next to Next week : for Nifty50 only
Current Month: Monthly expiry for NSE and BSE
Next Month: Next Monthly Expiry for NSE and BSE
Manual Date Input : Select this option for MCX and delta exchange india as well as NSE/BSE if date is not accurate automatically function. Suppose any Tuesday expiry for NSE is on holiday then you must select Manual date input.
Manual Expiry date: When you select Manual Input Date in above option then only you can select particular date of option expiry.
Delay Entry order by approx seconds: This option exclusively for Future and equity where new entry and previous exit order fire at the same time which cause margin release issues and hence order rejected due to low margin. This option gives signals at the same time but fires order after some seconds. Minimum 5 seconds are set but according to your symbols liquidity increases seconds specifically in MCX market where more than 10 seconds is appropriate. Always monitor such trades.
Consent and disclaimer
Always click this option : 'Trading involves a risk of loss and may not appropriate for every one. Please consider carefully if trading is appropriate for you. Past performance is not indicative of future results. Any signals appear on chart are for education purpose only. This signals can be optimised by yourself changing the variables in the indicator\'s input tab on various instruments and timeframe. It is your responsibility knowing that by clicking you are accepting that indicator would trade on your behalf at your own risk. We are not SEBI registered.'
Show Monthly Performance Table
This option enable the Monthly Performance in table form where month wise profit and loss are showing (on index it shows in point form). Percentage in () depends upon initial capital set in the property tab. Various Statistical parameters are also seen in table like : % profitability, profit factor, No of trades (W winnings and L Lossing), Max Run-Up, Max Drawdown, Initial capital, Backtest Range. This data only shows that shows on strategy tester without any deep backtesting.
Show Small PNL Table
This option enables a small profit and loss table for today’s trade only (except the last candle close)
Show Algo Setting Details Table
This table enables you to show which settings have you done for automation and also guides if you select the wrong option showing in red background color. Symbols, instruments, broker, client id, secret key, position on chart, expiry date (most important for FNO) please verify this date with actual option chain expiry date. Wrong expiry date lead to no execution of trade.
Creat Alert for Automation
At the end of indicator on three dot click on “Add alert on Universal Signal Trading Tool : Single Target”. Which Creat on Pop-Out Page with three different tab:
Settings Message and Notifications
#Settings
Symbols : current symbol
Condition: Universal Signal Trading Tool : Single Target
Interval: Same as chart
#Message
Alert Name: Type your Custom alert name
Message: by default you will this message : {{strategy.order.alert_message}}
Please do not change this message, do not use any json message here
#Notifications
Click on webhook url : (Only available if you have Tradingview subscription and two factor authentication is done) paste brokers valid webhook here (Use only active webhook). Please do not use api webhook, use only tradingview webhook separately available for tradingview User’s broker account.
Play sound as per your need
How to update an alert?
Once you create an alert on the current indicator and current chart with the same timeframe then green color watch you can see next to indicator name on chart. If green watch does not appear then the current indicator setting/symbol/timeframe is different from the setting in alert.
So if you have made any changes then you must update the alert.
See the right top side of the alert in the alert section: pause/ restart, edit and delete option are available. Click on edit option then pop-up window will open, select appropriate symbol if it is different, in condition dropdown menu if indicator name shows two time means second name is the new settings, so select second indicator name and select timeframe as same as chart and then click ok. Check if the green watch appears or not.
Trouble shooting
Q : I am not able to see signals on chart?
Check initial capital on chart, increase zero at end if required.
Always unclick the backtest date filter.
Check entry exit external signal properly selected.
Q: Trade not executing on broker panel?
Is alert generated in alert log? If yes then check secret code, expiry date if trading FNO, valid webhook and symbols. If No then update your alert.
Q: Order fails at broker?
Click on the failed order and see the reason and approach us via message on tradingview.
Note: Strategy used in the above strategy is only for example and demonstration purpose. It does not indicate to use the same strategy.
Results shown here are using the supertrend indicator (attached to this script as external indicator) with ATR length 1 and factor 30 on Nifty 50 index chart on 5 minute timeframe.
Always use your own criteria, risk management and proper backtesting before using the live capital. Do not go for blind trading, always monitor the automated trade in synchronization. Any misbehave by system or technical glitches leads to unwanted loss. So, think first, practice and go according to your analysis.
Your feedback and reporting any kind of bug is appreciable. Please reach us via message, comment or communication method available in our profile.

ATR Trailing Stop + HTF + Pivots (Non-Repainting📌 UT Bot PRO + HTF + Pivots + PP SuperTrend (Non-Repainting)
This indicator is a fully non-repainting trading system designed for intraday and swing traders.
It combines multiple high-probability confirmations into a single, clean signal engine.
🔍 What’s Inside
✔ ATR-based trailing stop (UT-Bot style logic)
✔ Heikin Ashi price smoothing
✔ Heikin Ashi VWAP trend confirmation
✔ Higher-Timeframe EMA filter (no lookahead)
✔ Volume strength confirmation
✔ Auto timeframe Standard Pivot Points (PP, R1, R2, S1, S2)
✔ Pivot Point SuperTrend for market direction
✔ ATR-based Stop Loss & Take Profit levels
🔒 Non-Repainting Guarantee
Signals trigger only on confirmed candle close
Higher timeframe data uses lookahead_off
Pivot calculations are confirmed (no future data)
Signals will not disappear or shift after printing
📈 Trading Logic
BUY Signal
Price crosses above ATR trailing stop
Pivot SuperTrend is bullish
Price above HA VWAP
HTF EMA trend is bullish
Volume above average
SELL Signal
Price crosses below ATR trailing stop
Pivot SuperTrend is bearish
Price below HA VWAP
HTF EMA trend is bearish
Volume above average
⚙️ Recommended Settings
Intraday (5m–15m): HTF = 15m
Scalping (1m–5m): HTF = 5m
Swing (15m–1H): HTF = 1H
SL: 1.5 × ATR
TP: 3 × ATR
🧠 Best Used For
Crypto
Forex
Indices
Stocks
Works best in trending markets. Avoid very low-volume or choppy sessions.
⚠️ Disclaimer
This indicator is for educational purposes only.
No trading strategy guarantees profits. Always use proper risk management and test before live trading.

DewaSMC ELITE DewaSMC ELITE — Prepare Entry + EMA Alerts
DewaSMC ELITE is a Smart Money Concept (SMC) trading indicator designed for scalping and intraday trading on 5-minute and 15-minute timeframes.
It helps traders anticipate entries early, confirm direction with EMA filters, and manage trades with automatic TP/SL levels and advanced JSON alerts.
Key Features
Smart Money Concept (SMC)
- Automatic BOS (Break of Structure) and CHoCH (Change of Character)
- Bullish & bearish market structure detection
- Break confirmation using candle body or wick
Prepare Entry System (Early Warning)
- PREPARE ENTRY zones appear before an actual structure break
- Provides early alerts so traders can get ready before entry
- Prepare zones are automatically removed once a valid entry occurs
EMA Confirmation Filter
- Built-in EMA 9 & EMA 20
- Optional strict EMA alignment:
- LONG: EMA 9 above EMA 20 + price above EMA
- SHORT: EMA 9 below EMA 20 + price below EMA
- EMA confirmation status is shown in the info table and alerts
Automatic TP & SL (ATR-Based)
- Entry is set at the broken structure level
- TP1, TP2, TP3, and Stop Loss are dynamically calculated using ATR
- Visual Risk Zone & Reward Zone
- TP hit tracking with visual check marks (✓)
Trade Information Table
- Displays real-time trade details:
- Trade direction (LONG / SHORT)
- Entry price, Stop Loss, TP1–TP3
- Risk & reward percentages
- EMA confirmation status
- Risk : Reward ratio
Advanced JSON Alerts (No Spam)
- BUY & SELL entry alerts
- Clean JSON format (ready for bots / webhooks)
- Anti-spam signal lock
Filters:
- Timeframe 5m & 15m
- Volatility filter (ATR-based)
- EMA confirmation (YES / NO is always included)
Recommended Timeframes & Markets
Best performance on:
- 5m & 15m timeframes
- Forex, Gold (XAUUSD), and Crypto (BTC, ETH)
ELITE Mode Features:
- Maximum trades per day
- Cooldown between trades
- Kill switch to disable all entry alerts
Who Is This Indicator For?
✔ Scalpers & intraday traders
✔ Smart Money Concept (SMC) traders
✔ Traders who want early entry preparation
✔ Bot & webhook automation users
Disclaimer
This indicator is not financial advice.
Always apply proper risk management.
Trading performance depends on market conditions, spread, and execution quality.

Backtest Pro - The TradingView Backtesting EngineBacktest your indicators — no strategy code required. Backtest Pro is the next-generation backtesting engine for smarter testing. Simply link your signals, set your stops, and start testing.
With its upgraded UI/UX and fundamentally improved stop system, Backtest Pro replaces the legacy PSE (Practical Strategy Engine) and sets a new standard for TradingView backtesting. It delivers more accurate intrabar trailing stops, flexible stop types (Points, ATR Multiplier, %), and a smoother workflow for greater precision and control.
Once loaded on your chart, Backtest Pro appears as BT Pro as the script title and in the Strategy Tester, alerts, and chart labels.
Beyond the core stop and pyramiding logic, Backtest Pro also introduces:
A clearer Data Window for reviewing trade details.
Improved signal labels in the Strategy Tester’s List of Trades for easier log analysis.
Updated chart labels that align better with TradingView’s native style and make signals easy to interpret. Together, these improvements make Backtest Pro the most practical and user-friendly way to backtest indicator-based trading signals in TradingView.
Copyright © 2025 CoinOperator
________________________________________________________________________________
🚀 Why Traders Choose Backtest Pro
Answer in minutes what used to take days of manual testing.
Backtest Pro is a drop-in, ready-to-use backtesting engine that links to your indicator with just a few simple connection lines. It provides more accurate intrabar trailing stops, multiple stop types (Points, ATR Multiplier, %), and a smoother workflow for greater precision and control.
Whether you’re running a quick test or fine-tuning complex strategies, Backtest Pro helps you reach clearer insights faster.
________________________________________________________________________________
👤 Who Backtest Pro Is For
Backtest Pro is designed for traders who already have a trading methodology or entry/exit logic and want professional-grade validation and risk analysis.
Backtest Pro is not a signal service and does not provide discretionary trade recommendations. All entries and exits — including alerts used for automation — are generated solely from user-defined logic.
You bring the logic — Backtest Pro provides the structure, metrics, and discipline.
Backtest Pro helps swing traders, day traders, and strategy developers streamline the backtesting process without sacrificing depth or accuracy. It offers flexible stop management, enhanced Data Window metrics, refined Strategy Tester labeling, and clean on-chart visuals to support consistent evaluation.
Backtest Pro supports trading and backtesting on futures (continuous contracts), forex, crypto, stocks, ETFs, and commodity/index CFDs (tradable if offered by your broker).
________________________________________________________________________________
⚡ Quick Start
Add Backtest Pro to your chart. It appears as BT Pro as the script title and in the Strategy Tester, alerts, and chart labels.
Add a few connector lines to your indicator, then link your custom entry and exit signals.
Adjust position sizing, stops, and pyramiding.
Run the TradingView Strategy Tester for instant results.
________________________________________________________________________________
🔄 From PSE to Backtest Pro
Backtest Pro builds on the foundation of the PSE (Practical Strategy Engine), evolving it into a more refined tool. While PSE introduced flexible stop handling, Backtest Pro enhances the experience with:
More accurate intrabar trailing stops
Expanded stop type options (Points, ATR Multiplier, %)
Upgraded Data Window for easier review
Clearer trade signals in the Strategy Tester
Cleaner, more consistent chart labels
Wash Sale Prevention is Now Optional. If enabled, it only applies to assets of types stock and fund.
🛠 INPUTS TAB SETTING
📅 Trading Window
Enable Trading Window to define the date/time when trading is allowed. Disable to trade the entire market data.
Partition the time when trading is allowed to see if your indicator settings work well across the different ranges. Your resulting metrics should be acceptable across all four (4) ranges: entire range, 1st half, IQR, and 2nd half.
Show Trading Window Lines – Enable to draw vertical lines at the start and end of the trading window for clear visual definition of when trading is allowed.
💰 Position Sizing (Money Management)
Separating the equity risk into initial position and pyramid position allows for greater ability to maximize profits within your acceptable drawdown.
Note : Position sizing is determined on the anticipated fill price which is affected by the maximum of slippage and selected price gap (discussed in the Execution Rules section). Max Equity per Position (%) : This setting applies to each position within a trade group . Limits the position size and will not exceed this amount. Set as desired. Default is 20% for non-leverage trading. For leveraged trading, adjust accordingly. Example: for 3× leverage, enter 300 (3 × 100 = 300).
Max Equity Drawdown Warning (%) : Triggers an alert if the strategy’s equity drawdown exceeds this threshold. Select the method to use for this warning. If BT Pro, then it is based on peak equity at bar-close. If TradingView, then it is based on the built-in variable strategy.max_drawdown_percent. Helps you manage strategy-level risk tolerance.
Scaled Pyramiding : Adjusts position size incrementally for each pyramid entry—either decreasing or increasing exposure relative to the prior entry.
Start Position: The entry number at which scaling begins. For example, 3 means scaling starts on the 2nd pyramid (the 3rd entry overall).
Chg(%): The percentage change applied to each subsequent pyramid entry.
Max(%): The maximum cumulative reduction allowed when scaling downward. Ignored for upward scaling because increases are already capped by Max Equity per Position (%).
⚖️ Execution Rules
Trade Direction : Select either Both , Long Only, or Short Only.
Alert Failed to Trade – Enable to alert you when a trade did not happen due to low equity or low order size. Applicable only for the first position of a trade group.
Cooldown Period : Controls how long the engine waits after an exit before allowing a new trade group. Backtest Pro also applies a small built-in safeguard to prevent unrealistic same-bar flips: ● 1 bar minimum for same-direction entries
● 2 bars minimum for direction changes
Prevent Wash Sales : Enable if you want the Backtest Pro to enforce a minimum cooldown period of 30 days for trade groups that result in a loss. Only applies to assets of types stock and fund.
Pyramid Conditions with Price Gaps : Dwn Gap and Up Gap refer to price gaps. A price gap is the difference between the closing price of the previous candle and the opening price of the current candle, and their value is shown in the Data Window. Selection options include: disabled (the default), median, avg, p80 (for 80th percentile), and p90 (for 90th percentile). The values reflect ~500 most recent bars from the cursor position. Disabled sets the Dwn Gap and Up Gap to zero in the below logic. Pyramids require a tailing stop loss, TSL. The price gaps are used in conditions for pyramids:
To ensure the previous position is protected when opening a pyramid position. A new pyramid position will not open until its trailing stop loss protects the prior position.
To prevent a pyramid position from becoming a loss when too close to a take profit level, TP (if enabled), due to commission cost.
The logic for #1 and #2 is as follows:
For a Long Pyramid: TSL: Stop Price - max(DwnGap, slippage) > LastEntryPrice
TP (if enabled): Long take profit > close + max(UpGap, slippage) AND gain > commission cost
For a Short Pyramid:
TSL: Stop Price + max(UpGap, slippage) < LastEntryPrice
TP (if enabled): Short take profit < close - max(DwnGap, slippage) AND gain > commission cost
Show All Gap Stats in Data Window
Enable to show all price gap statistics in the Data Window to review market conditions.
Disable for the Backtest Pro to run most efficiently.
Note: Statistics selected in Dwn Gap and Up Gap settings are always shown, regardless of this option.
🛑 Exit Strategy (Risk Management)
Backtest Pro supports multiple stop loss styles, giving traders the tools to backtest strategies in TradingView with precision:
The Exit Strategy applies a common protective stop across the entire trade group.
Pyramids require a trailing stop loss. A new pyramid position will not open until its trailing stop loss protects the prior position.
Plot Stop Level : You can plot the stop level either as of bar close (the default) or as of bar open. This only affects the visual plot. The underlying logic does not change. The trades will be the same regardless of the setting.
ATR Length : The ATR Length is used with the ATR multiplier and is common to stop loss, SL, trailing stop loss, TSL, take profit, TP, and the time-based exit option. It is the number of bars (periods) used in ATR calculation.
Price-Based Exits Stop Loss and Trailing Stop Loss options are Points, ATR Multiplier, and %.
The Trailing Stop Loss is activated from entry of the initial position of a trade group.
Take Profit options are Points, ATR Multiplier, %, and R-Multiple. How Trailing Stops Work in the Backtest Pro All trailing stop inputs (Points, ATR Multiplier, or %) are converted at the first entry into a fixed currency offset.
That offset is reactive intrabar and applied as the trailing distance from the most favorable price (highest for longs, lowest for shorts) since the first entry in the trade group.
Even if “%” is selected as the input method, the engine uses the fixed currency offset.
The trailing stop offset (points) is displayed in the Data Window for reference, allowing you to enter that offset directly at your broker if needed.
⚠️ Caution: Always enter a points-based trailing stop at your broker—never a percentage-based trailing stop. Volatility-Based Exit While in a trade, ATR values are accumulated each bar. The position exits once the total exceeds ATR Multiplier × ATR at entry if the Reward/Risk is below the set threshold.
Dividends are not included in reward (i.e., profit).
👉 These flexible stop types solve one of the biggest limitations of the legacy PSE and make Backtest Pro a true TradingView backtesting engine.
📑 Trade Signal Labels in Strategy Tester
Backtest Pro uses standardized trade labels in the Strategy Tester → List of Trades. These labels make it easy to understand the reason behind each entry or exit at a glance. Entry : Standard entry signal when conditions are met.
Stop : Stop-loss exit triggered at your defined stop level.
Pyr-Entry : Pyramid entry, adds to an existing position.
Trail-Stop : Trailing stop exit based on offset logic. Note : If the stop level has been adjusted to equal the trailing stop level, the Strategy Tester may display Stop instead of Trail-Stop. The exit displayed is the one Pine Script evaluates first, but the actual exit behavior remains correct.
Exit : Standard exit signal.
Delay-Exit : One-bar delayed exit, prevents immediate exit when position entry and exit signal occur on the same bar.
TP : Take Profit exit, closes position at your profit target.
RR-Exit : Reward/Risk exit — position closes when ATR accumulation exceeds the set threshold and R/R is below target.
📊 Performance Metrics & Reporting
Include Dividends in Profit
Adjusts ROI, CAGR, Reward/Risk, Avg Invest/Trade-Grp, and Equity.
Assumes dividends are taken as cash (not reinvested). They are applied to Equity on the ex-date instead of the payment date.
Only applies if the security issues dividends and the chart is 1D or lower timeframe; otherwise ignored.
Include Dividends in Profit Factor
Applies only when Include Dividends in Profit is enabled.
Adds dividend income to both gross profits and gross losses when calculating Profit Factor, so PF reflects total return (trading + dividends).
Affects Avg Trade-Grp Loss, Equity Loss from ECL, and Equity Loss from ECL (%).
Show Dividends
Displays the payout in currency/share, as well as the total amount based on the number of shares of the position(s) currently held by the trade group. For long positions you earned the dividends. For short positions you owe the dividends.
Show Metrics Table
The on-chart Metrics Table displays a compact set of key statistics for quick reference and mobile use. Full and expanded metrics are available in the Data Window on desktop or browser. Section groupings may differ between the table and Data Window to optimize readability and presentation in each context.
📊 Data Window
Note : Accessible via a button on the right-hand toolbar of the chart interface. Unlike the Metrics Table, Data Window values update dynamically as you move your cursor across bars. All metrics are based on trade groups.
Trade Information
Enter Price
Stop Price
Favorable Extreme : only shows if trailing stop loss is enabled on Inputs tab. The most favorable price (highest for longs, lowest for shorts) since the first entry in the trade group.
TSL Offset Points : only shows if trailing stop loss is enabled on Inputs tab.
Take Profit : only shows if take profit is enabled on Inputs tab.
Leverage information applies to trade groups.
Fail Pos / Margin (%) : Shows zero if the failed position size was <1, or the margin % that failed to meet the requirement in the Properties tab. A flag appears above the bar where a failed trade occurred. Only applies to the first position of a trade group. Hover over the flag to view the value in the Data Window.
Notional Value : total trade group position size x latest entry price x point value. The equity must be > notional value x margin requirement for a trade to occur.
Current Margin (%) : must be greater than margin requirement set on the Properties tab in order for a trade to occur.
Margin Call Price : when enabled on the Style tab is displayed on both the chart and the Data Window as shown below.
Performance Net Profit (%) : Will include dividends if 'Include Dividends in Profit' is enabled. Only shows in Data Window if 'Include Dividends in Profit' is enabled.
ROI (%) and CAGR (%) : Based on Avg Invest/Trade-Grp. Adjusted for dividends if enabled.
Reward/Risk (profit/risked, expectancy per amount risked): Adjusted for dividends if enabled. Color is green if above breakeven, red if below, and yellow if within ±0.1 tolerance.
Profit Factor (PF) : By default, dividends are not counted in win/loss classification.
Win % : Uses same coloring scheme as Reward/Risk except uses a ±2% tolerance for yellow. Breakeven point is the balance between Reward/Risk and Win %, showing whether the system can be profitable. For example, for a low Win % a high Reward/Risk is needed for the system to be potentially profitable. Equity & Growth
Equity : Your current equity.
Dividend Sum : The amount of total dividends accumulated since entering the market. Only shows in Data Window if 'Include Dividends in Profit' is enabled. Risk & Drawdown
Maximum Drawdown (MDD)
Measures the largest peak-to-trough decline in account equity over the entire backtest.
A new peak is recorded whenever equity reaches a new high; the system then tracks the lowest equity seen until a new peak forms.
This method uses bar-close equity including both realized and unrealized P&L. Therfore, it may not match TradingView’s displayed drawdown values which use a different method.
Maximum Drawdown %
Expresses MDD as a percentage of the equity peak from which the decline occurred.
This normalizes drawdown across different account sizes and assets, making strategy-to-strategy risk comparisons more meaningful.
Maximum Consecutive Losses applies to trade groups.
Equivalent Consecutive Losses (ECL) : Based on Win % and Nbr of Trade-Grp’s.
Simulates a realistic losing streak with intermittent small wins.
Lowered by increasing Win %.
Equity Loss from ECL : Equity drawdown estimated from ECL.
Equity Loss from ECL (%) : Same, expressed as a percentage.
Avg Trade-Grp Loss Trade Structure
Backtesting Years : The trading window in years.
Nbr of Trade-Grp’s : Count of trade groups.
Nbr of Positions : The count of positions shown on the chart.
The TV list of trades in the Strategy Tester may indicate more than what is actually shown on the chart.
Avg Invest/Trade-Grp : Avg money invested per trade group. Adjusted for dividends if enabled.
Avg Trade-Grp Days : The average number of days for trade groups.
Time in Market (%) : The percentage of time in a trade based on the trading window.
Cnt 1st EE Same-Bar is the count of first positions in a trade group that enter and exit on the same bar. Labels appear above for easy reference. Helps assess optimal stop-loss settings.
Cnt Pyr EE Same-Bar is the count of pyramid positions in a trade group that enter and exit on the same bar. Labels appear above for easy reference. Helps assess optimal stop-loss settings. Up Gaps / Dwn Gap (Ticks) ( Show All Gap Stats in Data Window enabled )
Median gap
Avg gap
80 percentile
90 percentile
Price Gap (Ticks) ( Show All Gap Stats in Data Window disabled )
Dwn Gap : Shows selected option if not disabled.
Up Gap : Shows selected option if not disabled.
Data Quality
Tick Resolution measures how many minimum price increments (ticks) fit into the current asset’s price. It is calculated as: Tick Resolution = Price / Minimum Tick Size. This value indicates the precision available for order placement and stop calculations.
Green – High resolution (>= 1000). The strategy’s stop and profit calculations will operate with normal accuracy.
Yellow – Moderate resolution (100-999). Stop levels are still functional but may exhibit minor rounding effects.
Red – Low resolution (< 100). This can distort trailing stops, stop losses, or take profits due to coarse rounding by TradingView’s broker emulator.
⚠️ Caution : When Tick Resolution is in the red zone, results from backtests may differ significantly from live trading because price precision is too low for reliable simulation.
💡 Tip : If low tick resolution is present at the beginning of the chart’s market data (often with very old price history), use the Trading Window to restrict backtesting to later periods where the asset price has risen and tick resolution is higher.
👁 Visualization
Highlight Traded Background
Trade groups are shown in background color of green for long positions and red for short positions. Set as desired.
Show Losing Trade Groups
Losing trade groups are indicated at the exit with label text in the color blue. Used to easily find consecutive losses affecting your strategy’s performance. The dividend payment, if any, is not considered in the calculation of a win or loss.
Show Position Values
Enable to show the currency value of each position in gold color.
Show Max Drawdown (Peak & Trough) Enable to show the peak and trough labels on the price chart. Based on equity at bar close. Use to easily identify the bar associated with the peak and trough of equity.
Select label size for your preference.
Alert on Expiring GTC Orders
Backtest Pro includes an optional alert that warns you when a Good-Til-Canceled (GTC) order is approaching expiration. This feature is designed as a safety net, helping you avoid unprotected trades caused by broker-imposed GTC expirations. This alert is sent a few days before a 60-day time period you’re if still in an open position.
By default, the alert is enabled, offering protection for traders who may not actively monitor order expiry rules.
Professional users who already track expirations can disable the feature in the settings to streamline alerts.
🔌 Signal Connection
Click the dropdown and select the entry and exit signal to establish a connection to your indicator.
Separate Entry and Exit Signal Connections.
Backtest Pro requires separate entry and exit signals. Indicators that already produce distinct events integrate cleanly and make strategies easier to read, debug, and maintain.
If your indicator currently uses a combined signal (e.g., buy = 1, sell = –1, flat = 0), that structure can create overlap or conflicts during backtesting.
Don’t worry — later in this manual, you’ll learn exactly how to adapt your indicator so it outputs clear entry and exit signals compatible with Backtest Pro.
🔌 Configure Your Indicator for Entry and Exit Signals
This section explains how to structure your indicator’s entry and exit signals so they can connect seamlessly with the Backtest Pro engine.
Define your own conditions for when to enter or exit positions using any technical logic you prefer. You can configure exits independently of entries or make them dependent on them—for example, exiting only when the opposite entry condition occurs.
Below are a few examples of how you might define Long and Short Entry Signals before connecting them to Backtest Pro.
________________________________________________________________________________
Examples of Long Entry Signals
ind_sig_long = oscillator > UpperLimit
ind_sig_long = ta.crossover(ta.sma(close, 14), ta.sma(close, 28))
ind_sig_long = MACD_hist > 0 Examples of Short Entry Signals
ind_sig_short = oscillator < LowerLimit
ind_sig_short = ta.crossunder(ta.sma(close, 14), ta.sma(close, 28))
ind_sig_short = MACD_hist < 0 ________________________________________________________________________________
Combining and Refining Your Signals
If your indicator uses multiple internal conditions, you can combine them using logical operators or threshold rules before connecting to the Backtest Pro engine.
1. Combine multiple conditions
Use logical and / or to merge your conditions into one signal:
Entry_Long = ind_sig_long1 and ind_sig_long2 // both must be true
Entry_Short = ind_sig_short1 or ind_sig_short2 // either may be true ________________________________________________________________________________
2. Require a minimum number of confirming conditions
You can also define a threshold for how many entry conditions must be true before triggering a signal. This can help ensure stronger confirmation.
minNbr_Entries = input.int(defval=1, title='Min Number of Entry Conditions')
// Convert boolean signals to numeric form
longCount = (ind_sig_long1 ? 1 : 0) + (ind_sig_long2 ? 1 : 0)
shortCount = (ind_sig_short1 ? 1 : 0) + (ind_sig_short2 ? 1 : 0)
// Require at least minNbr_Entries to confirm signal
Entry_Long = longCount >= minNbr_Entries
Entry_Short = shortCount >= minNbr_Entries
Do likewise for your Exit conditions to ensure consistency in trade confirmation.
________________________________________________________________________________
Defining Exits
Independent of Entries
Exit_Long = ta.crossunder(ta.rsi(close, 14), 70)
Exit_Short = ta.crossover(ta.rsi(close, 14), 30) Dependent on Entries
Exit_Long = Entry_Short // exit longs when short entry triggers
Exit_Short = Entry_Long // exit shorts when long entry triggers ________________________________________________________________________________
Final Signals to Connect to Backtest Pro
entry_signal = Entry_Long ? 1 : Entry_Short ? -1 : 0
exit_signal = Exit_Long ? 1 : Exit_Short ? -1 : 0
plot(entry_signal, title="entry_signal", color = color.blue, display=display.data_window)
plot(exit_signal, title="exit_signal", color = color.red, display=display.data_window) ________________________________________________________________________________
Notes
You can easily expand this structure to handle three or more conditions by adding them to the count expression.
If your indicator already provides a single entry_signal, you can connect it directly to Backtest Pro without modification.
Always ensure your final Entry_Long, Entry_Short, Exit_Long, and Exit_Short variables are boolean (true / false).
🔒 Connecting Closed-Source Indicators
If your indicator is closed-source (meaning you cannot view or modify its internal code), you’ll need to work with the plotted values it provides.
Create a connection indicator that reads those plotted values and converts them into clear entry and exit signals using the logic described above.
This connection indicator acts as a bridge between the closed-source indicator and Backtest Pro, allowing you to translate its behavior into standardized signal logic that the engine can process.
⚙️ PROPERTIES TAB SETTING
Initial Capital : Set as desired.
Base Currency : Leave as Default. The Backtest Pro is designed to use the instrument’s native currency, so changing this is not necessary.
Order Size : Essentially disabled. Position sizing is handled in the Inputs tab and is based on a percentage of equity.
Pyramiding : Set as desired.
Commission : Enter as a percentage of position value. The Backtest Pro is designed to work only with commission expressed this way.
Verify Price for Limit Orders : Set as desired.
Slippage : Set as desired. See the Dwn/Up Gap values in Data Window to get an idea of possible values to use.
Margin (Leverage Trading):
The Backtest Pro supports both leveraged and non-leveraged trading (default is no leverage).
Note : The following two settings apply at the trade group level . For example, to trade with 5× leverage, enter 20 (1 ÷ 5 × 100 = 20).
Margin for Long Positions : Set as desired. Default is 100%.
Margin for Short Positions : Set as desired. Default is 100%.
Recalculate After Order Is Filled (default is enabled)
Enabling this allows the Backtest Pro to function correctly and to recalculate immediately after an order is filled , which makes it possible to:
Enter and exit on the same bar (because the strategy sees the fill instantly).
Trigger alerts immediately after the fill , instead of waiting for the next bar close.
You may see the following Caution! message in the TradingView Strategy Tester:
This warning occurs because the strategy parameter calc_on_order_fills = true . You can safely close the caution message and know the Backtest Pro will produce realistic backtest results.
Recalculate On every tick : Disable.
Fill Orders
Using Bar Magnifier : Recommended if your TradingView plan supports it. Improves intrabar accuracy, but the strategy can still run without it.
On Bar Close : Must remain disabled. Enabling this prevents the Backtest Pro from working as intended.
⚠️ Caution : Enabling On Bar Close forces all orders to be evaluated only at bar close. This disables intrabar logic, prevents same-bar entries and exits, and breaks trailing stop / pyramid behavior. For the Backtest Pro to work as intended, On Bar Close must remain disabled .
Using Standard OHLC : Recommended if running the strategy on Heikin Ashi charts. Otherwise, set as desired. The default is enabled.
📢 Using The Alert Dialog Box Message Field
When setting alerts, include alert() function calls with order fills to allow notifications for drawdown exceeded, Failed to Trade (if enabled), and to be warned of expiring GTC orders (if enabled).
Example Message for Order Fill Alerts
(This is just an example. Consult TV manual for possible placeholders to use.)
Position: Current = {{strategy.market_position}}, Previous = {{strategy.prev_market_position}}
{{strategy.order.action}} {{strategy.order.contracts}} shares at price = {{strategy.order.price}} on {{exchange}}:{{ticker}} (TF: {{interval}})
Equity_Multiplier = {{strategy.order.contracts}} x {{strategy.order.price}} ÷ {{plot("Equity")}}
{{strategy.order.alert_message}}
Note :
Use a known account equity multiplied by Equity_Multiplier to determine the total currency amount required for position sizing—especially when managing multiple accounts with different equity levels.
What {{strategy.order.alert_message}} Includes
This placeholder automatically inserts the additional information generated for each order fill alert (blank for exits):
Stop Price (on first entries is based on bar close prior to order fill bar)
TSL Offset (Pts) distance from Favorable Extreme (for pyramid entries)
TP (on first entries is based on bar close prior to order fill bar)
Price Gap (Pts) based on your gap selection and slippage entered
Example Message for Bot Trading Alerts
(You must consult your specific bot for configuring the alert message. This is just an example.)
"action": "{{strategy.order.action}}",
“price”: {{strategy.order.price}}
"amount": {{strategy.order.contracts}},
"botId": "1234"

Smart Impulse PRO v1.0Smart Impulse PRO (Invite‑Only) — Comprehensive Guide for TradingView
***
## English Version
Smart Impulse PRO (Invite‑Only) — Comprehensive Guide for TradingView
Strategy Concept & Uniqueness
Smart Impulse PRO is a trend‑following impulse continuation strategy built specifically for volatile crypto pairs . It uses a custom price×volume impulse signal normalized with Z‑score , then filters these impulses through multi‑timeframe trend conditions and a layered guard system that blocks structurally weak trades (flat, overextension, exhaustion).
Backtest Summary (Crypto Pairs)
Smart Impulse PRO was backtested on several volatile crypto perpetual pairs (including ETHUSDT, BTCUSDT and other majors/alts) on 1h charts in the period 01 Jan 2023 – 26 Dec 2025. On this sample, typical results were:
- Total trades per pair : ≈100–130
- Win rate range : ≈ 90–94%
- Profit factor range : ≈ 3.0–3.9
These values are historical backtest metrics on specific symbols and settings and do not guarantee similar performance in the future .
Why It’s Special
✅ Custom price×volume impulse model (Z‑score‑based) : Measures how unusual each bar’s move is in its recent context, not just simple MA/RSI crossovers
✅ 15+ Exhaustion & Structure Guards : Automatically block bad contexts (flat, low vol, overextended candles, climax volume)
✅ Dynamic TP Grid : Take‑profit levels adapt to current impulse strength |Z|
✅ Visual Transparency : Bubbles show exactly why signals were blocked
✅ Invite‑Only Logic : The concrete impulse model and guard interactions are proprietary and therefore published as invite‑only with protected source, as allowed by TradingView’s script rules.
***
### 1. What the Script Does (User View)
Smart Impulse PRO acts as an automated decision engine for volatile crypto pairs (e.g., ETHUSDT, BTCUSDT) on intraday and swing timeframes (15m–4h). It:
- Generates Long/Short entries only when both trend and impulse conditions align.
- Manages exits with a multi‑level TP grid, breakeven logic, optional trailing stop and time‑based exit.
- Visually shows both taken trades and blocked signals , including a short text reason for rejection.
This lets users trade crypto trends with a clear explanation of when and why the strategy chooses to act or stay out.
***
Entry Rules
Long (Buy):
Price is above EMA200 (long‑term trend is up)
Z‑score impulse > Z_threshold (e.g., 1.5)
Volume above recent average
ADX > Min ADX (e.g., 25)
ATR regime OK (ATR > ATR_floor and not in volatility squeeze)
All active guards pass (no overextended candle, no extreme wick against direction, no climax volume lock, no distance violation vs EMA200/VWAP, no Z‑streak lock)
Short (Sell):
Price is below EMA200 (long‑term trend is down)
Z‑score impulse > Z_threshold
Volume above recent average
ADX > Min ADX
ATR regime OK
All active guards pass (same checks, mirrored for shorts)
Logic:
The script first checks that the market is trending (EMA200 side + ADX + volatility filters), then validates that the current bar is a statistically strong price×volume impulse, and finally makes sure the bar is not an exhaustion spike or overextended move according to the guard system. Only if all three layers agree, a trade is opened.
Exit Rules
Stop‑Loss:
Initial stop‑loss is placed at a user‑defined distance (percent or ATR‑based), and position size is calculated so that a full stop equals Max Risk per Trade (%).
Take‑Profit grid:
Up to 10 TP levels.
Step type: Percent, ATR% or Hybrid.
Optional “Breathing grid”: TP distances are increased in proportion to |Z‑score| at entry (capped), so stronger impulses receive wider, more ambitious targets.
TP Profile (Equal / Aggressive / Balanced / Defensive) decides how much size is closed at each level.
Breakeven and Trailing:
Optional breakeven: after TP1 is hit, stop can be moved to entry price plus a small offset.
Optional ATR‑based trailing stop activates only after TP3 to avoid being shaken out too early by noise.
Time‑based Exit:
If enabled, any open trade that does not hit TP or SL within the chosen time limit (bars or minutes) is closed at market, to avoid very long, stagnant positions.
### 2. How the Script Works (Internals)
2.1 Impulse Engine (Custom Z‑Score Model)
At the core is a price×volume impulse series with Z‑score normalisation:
- Raw impulse:
`delta_impulse = (close - close ) * volume`
- Normalisation over N bars (default N = 20):
`zscore = (delta_impulse - avg(delta_impulse, N)) / stdev(delta_impulse, N)`
A bar becomes an impulse candidate only when:
- `abs(zscore) > Z_threshold` (default 1.5), and
- volume is above its recent average.
This is a custom implementation of a price×volume impulse model based on Z‑score; the exact combination of inputs, window, thresholds and how this signal feeds guards and exits is part of the proprietary logic.
2.2 Trend & Volatility Context — Why the Mashup Exists
The strategy combines several classic tools, but each covers a specific failure mode. The mashup is intentional:
| Component | What it checks | Why it is needed |
|----------|----------------|------------------|
| EMA200 | Long‑term bias (price above/below) | Prevents counter‑trend trading |
| EMA200 slope | Steepness of EMA over K bars | Filters flat/ranging phases even above/below EMA |
| VWAP | Distance of price from volume‑weighted fair value | Avoids entering when price is far from value (overextension) |
| ADX | Trend strength | Disables signals in low‑trend, choppy markets |
| ATR vs AvgATR50 | Current volatility vs recent average | Detects volatility squeezes and abnormally calm regimes |
| ATR% floor (Anti‑Flat Gate) | ATR as % of price | Hard “no‑trade” mode in ultra‑tight ranges |
An impulse alone is not sufficient in crypto; only impulses inside a suitable trend and volatility context are allowed to become trades.
2.3 Guard System (Exhaustion & Overextension)
Above trend filters, Smart Impulse PRO adds a guard layer designed from typical crypto problems (late entries, news spikes, “buying the top”):
- Max body / ATR : Rejects abnormally large real bodies (e.g., body > 3× ATR), often at the end of a move.
- Max range / ATR : Blocks extremely long high‑low bars.
- Upper/lower wick filters :
- Longs blocked when upper wick dominates (rejection from above).
- Shorts blocked when lower wick dominates (rejection from below).
- Z‑streak guard : After several consecutive impulse bars in the same direction, new entries in that direction are disabled to avoid chasing.
- Climax volume + cool‑off : When volume spikes above a multiple of its recent average, new trades are paused for N bars.
- Distance guards : Excessive distance (in ATR multiples) from EMA200 and VWAP can block trades.
These checks interact with the impulse model so that the final decision reflects a coherent risk framework rather than a loose collection of filters.
2.4 Dynamic TP Grid (Exit Logic)
- Up to 10 TP levels; step type: Percent, ATR% or Hybrid.
- With Breathing grid , TP spacing is increased by a factor of `k * abs(zscore)` (capped) at entry.
- Stronger impulses (higher |z|) → wider distances between TP levels; weaker impulses → tighter TP spacing.
- TP profiles (Equal / Aggressive / Balanced / Defensive) control how much position size is allocated to early vs late targets.
- Optional breakeven: move SL to entry (plus offset) after TP1.
- Optional trailing: ATR‑based trailing stop activates after TP3.
This links entry strength and exit geometry using the same impulse signal.
***
### 3. How to Use the Script (Practical Guide)
3.1 Quick Start
1. Add Smart Impulse PRO to a volatile crypto pair (e.g., ETHUSDT, BTCUSDT) on 15m–4h.
2. Keep the default preset and observe executed trades and blocked bubbles.
3. Use the dashboard to see which filters are active and which ones are blocking most trades (e.g., ADX, Flat, Exhaust).
4. If there are too few trades, gradually lower Z_threshold or Min ADX , or slightly relax guard limits — change one parameter at a time .
5. Set Max Risk per Trade (%) , stop distance, TP count/profile and optional trailing in line with your risk tolerance.
3.2 Example Profiles
- Aggressive intraday (15m)
- Z‑threshold 1.2
- Min ADX 20
- ATR% floor 0.2%
- Some exhaustion guards disabled (e.g., less strict wick limits).
- Conservative swing (1h–4h)
- Z‑threshold 1.5
- Min ADX 25–30
- ATR% floor 0.3–0.4%
- All guards enabled, higher‑timeframe filters ON.
3.3 Risk Management & Position Sizing
- Max Risk per Trade (%) — percentage of equity at risk if the full stop‑loss is hit.
- Position size is computed automatically from Max Risk %, stop distance and instrument price.
- Breakeven and trailing can be enabled to reduce open risk after partial profit is taken.
- Time‑based exit closes trades that stay open beyond a user‑defined duration without reaching TP or SL.
3.4 Alerts
Alerts use `strategy.order.alert_message` to send JSON containing side (long/short), entry, stop and TP levels. This allows users to connect the strategy with external bots or dashboards without exposing internal code.
***
### 4. Why This Script Is Invite‑Only (Originality Justification)
TradingView asks invite‑only scripts to explain why their logic is original and why source protection is justified. Smart Impulse PRO does that by:
- Implementing a custom price×volume impulse model based on Z‑score normalisation and integrating it with exits through the breathing TP grid.
- Using a coordinated guard framework that explicitly targets typical crypto issues (late chase entries, overextension vs VWAP/EMA200, volatility squeezes, volume spikes).
- Providing a structured indicator mashup where EMA200, VWAP, ADX, ATR and Anti‑Flat Gate each address different dimensions (trend, volatility, structure) and are designed to work together as a context gate for the impulse signal.
On ETHUSDT, BTCUSDT and a group of other volatile crypto pairs, Smart Impulse PRO showed approximately 90–94% win rate and profit factor above 3.0 in 2023–2025 backtests under default risk and filter settings. These numbers are illustrative only and do not promise or guarantee similar live results.
Risk Disclaimer
Trading cryptocurrencies involves substantial risk. Backtests are hypothetical and assume perfect execution without additional slippage, liquidity constraints or exchange issues. Always test the strategy on your own symbols and timeframes and keep risk per trade at a level you are comfortable with.
FAQ
Q: Does the strategy guarantee profit?
A: No. It is a rule‑based decision engine; all results depend on market conditions, parameters and execution, and backtests do not guarantee future performance.
Q: Can I use it on any crypto pair?
A: The logic is designed for volatile crypto pairs. It has been backtested on ETHUSDT, BTCUSDT and several other majors/alts, but each symbol should be tested and, if needed, re‑tuned by the user.
Q: Which timeframe is best?
A: The engine is intended for intraday and swing charts between 15m and 4h. Lower timeframes will generally produce more signals and more noise; higher ones will produce fewer, slower signals.
Q: Can I disable some filters or guards?
A: Yes. Trend filters, the Anti‑Flat Gate and most exhaustion guards can be turned on or off. It is recommended to change one setting at a time and monitor how it affects blocked signals and the equity curve.
Q: How are alerts meant to be used?
A: Alerts send a JSON payload with side, entry, stop and TP levels via strategy.order.alert_message, so users can connect the strategy to external bots or dashboards if they wish.
***
## Русская версия
Smart Impulse PRO (по приглашению) — Полное руководство для TradingView
Концепция и уникальность
Smart Impulse PRO — стратегия продолжения импульсов, разработанная под волатильные криптовалютные пары . В ней используется пользовательская модель импульса “цена×объём”, нормализованная через Z‑score , после чего такие импульсы проходят фильтрацию по тренду на разных таймфреймах и через каскад гардов, блокирующих слабые и рискованные сетапы (флэт, перетянутость, истощение).
Сводка тестов (крипто‑пары)
Стратегия тестировалась на нескольких волатильных крипто‑парах (перпетуальные контракты, включая ETHUSDT, BTCUSDT и ряд других мейджоров/альтов) на часовом таймфрейме за период 01.01.2023 – 26.12.2025. Типичные значения по этим тестам:
- Количество сделок на пару : ≈100–130
- Диапазон винрейта : ≈ 90–94%
- Диапазон фактора прибыли : ≈ 3.0–3.9
Это результаты тестов на истории по конкретным инструментам и настройкам и не гарантируют такой же доходности в будущем .
Почему она оригинальная
✅ Пользовательская модель импульса цена×объём (Z‑score) : измеряет “редкость” бара в его статистическом окружении, а не просто пересечение стандартных индикаторов
✅ 15+ гардов : системно защищают от догоняния, пампов, торговли в “пиле” и на перетянутых уровнях
✅ “Дышащая” TP‑сетка : цели автоматически подстраиваются под силу текущего импульса |Z|
✅ Прозрачность : пузырьки показывают причины каждого отказа от сделки
✅ Формат по приглашению : логика импульса и взаимодействие гардов публикуются как закрытый скрипт с Invite‑Only доступом, что соответствует правилам TradingView.
***
### 1. Что делает скрипт (для пользователя)
Smart Impulse PRO выступает как движок принятия решений для торговли волатильными крипто‑парами (ETHUSDT, BTCUSDT и др.) на таймфреймах от 15 минут до 4 часов:
- Открывает лонги/шорты только при одновременном совпадении трендовых и импульсных условий.
- Управляет выходом через многоуровневую сетку TP, безубыток, по желанию — трейлинг‑стоп и тайм‑стоп.
- Отображает как реальные сделки , так и отклонённые сигналы с короткой подписью причины блокировки.
Задача — структурировать трендовую торговлю криптой и сделать логику решений максимально понятной.
***
### 2. Как работает скрипт (внутренняя логика)
2.1 Импульсное ядро (кастомная модель на Z‑score)
В основе лежит ряд дельта×объём :
- Сырой импульс:
`delta_impulse = (close - close ) * volume`
- Нормализация по окну N баров (по умолчанию 20):
`zscore = (delta_impulse - среднее(delta_impulse, N)) / стд(delta_impulse, N)`
Бар считается кандидатом на импульс , только если:
- `abs(zscore) > Z_threshold` (по умолчанию 1.5);
- объём выше своей недавней средней.
Это собственная реализация импульсного сигнала цена×объём , нормализованного по Z‑score; выбор входных данных, окна, порогов и связка с гардами и выходами формируют проприетарную часть стратегии.
2.2 Зачем нужен “мэшап” индикаторов (тренд и волатильность)
Комбинация EMA200, VWAP, ADX, ATR и Anti‑Flat Gate собрана так, чтобы каждый компонент покрывал отдельный вид риска:
| Компонент | Что проверяет | Зачем нужен |
|----------|---------------|------------|
| EMA200 | Долгосрочный уклон (цена выше/ниже) | Защита от контртрендовых входов |
| Наклон EMA200 | Наклон за K баров | Отсекает участки со слабым трендом (флэт) |
| VWAP | Удалённость цены от “центра объёма” | Не даёт входить в явной перетянутости от справедливой цены |
| ADX | Силу тренда | Запрещает торговлю в пиле и боковике |
| ATR vs AvgATR50 | Текущую волатильность к средней | Находит режимы сжатия и аномально низкой волатильности |
| ATR% пол (Anti‑Flat Gate) | ATR в % от цены | Жёсткий запрет торговли в очень узком диапазоне |
Импульс может быть сильным, но без нормального тренда и адекватной волатильности сделка не допускается.
2.3 Система гардов (истощение, перетянутость)
- Макс тело/ATR : слишком большая свеча относительно ATR трактуется как возможное окончание движения.
- Макс диапазон/ATR : блокирует экстремальные по размеру бары.
- Фильтры по хвостам :
- Лонги блокируются при доминирующем верхнем хвосте (отторжение сверху).
- Шорты — при доминирующем нижнем хвосте.
- Z‑streak : после серии импульсных баров в одну сторону новые входы по этому направлению отключаются.
- Climax‑объём + пауза : при объёме выше кратности к средней входы на несколько баров ставятся на паузу.
- Дистанционные гарды : чрезмерное удаление цены от EMA200 и VWAP в ATR‑мультипликаторах может блокировать вход.
Эти условия работают совместно с импульсным ядром и трендовыми фильтрами, формируя связанную модель риска.
2.4 Динамическая TP‑сетка
- До 10 тейк‑профитов; шаг — в %, ATR% или гибридный.
- При включённой опции “Breathing grid” шаг между TP увеличивается пропорционально `|zscore|` (в пределах лимита).
- Сильные импульсы → более широкая сетка и шанс забрать длинное движение, слабые → более плотная сетка.
- Профили TP (равный / агрессивный / сбалансированный / защитный) задают распределение объёма между ближними и дальними целями.
- Можно включить перевод стопа в безубыток после TP1 и трейлинг‑стоп по ATR после TP3.
***
### 3. Как использовать стратегию (практика)
3.1 Быстрый старт
1. Откройте график волатильной крипто‑пары (ETHUSDT, BTCUSDT и т.п.) на ТФ 15m–4h и добавьте стратегию.
2. Оставьте настройки по умолчанию и наблюдайте маркеры сделок и пузырьки отклонённых сигналов.
3. Через дашборд смотрите, какие фильтры чаще всего блокируют сделки (ADX, Flat, Exhaust и др.).
4. Если сделок мало, по шагу снижайте порог Z‑score или ADX либо ослабляйте некоторые гарды — всегда меняйте только один параметр за раз.
5. Настройте Max Risk per Trade , размер стопа, количество и профиль TP, а также при необходимости безубыток и трейлинг‑стоп.
3.2 Типовые профили
- Агрессивный скальпинг (15m)
- Z‑порог 1.2
- ADX min 20
- ATR% пол 0.2%
- Несколько гардов истощения отключены.
- Консервативный свинг (1h–4h)
- Z‑порог 1.5
- ADX min 25–30
- ATR% пол 0.3–0.4%
- Все гарды включены, HTF‑фильтры активны.
3.3 Риск и размер позиции
- Max Risk per Trade (%) задаёт долю капитала, которую допускается потерять при полном срабатывании стоп‑лосса.
- Стратегия рассчитывает размер позиции из риска, стопа и цены инструмента.
- Можно включить перевод стопа в безубыток после TP1 и трейлинг‑стоп после TP3.
- Тайм‑стоп закрывает сделки, которые слишком долго остаются открытыми без достижения TP/SL.
3.4 Алерты
Алерты формируют JSON‑строку с направлением, ценой входа, стопом и всеми TP‑уровнями через `strategy.order.alert_message`. Это позволяет подключать внешние боты и панели без раскрытия кода.
***
### 4. Почему скрипт по приглашению (обоснование оригинальности)
Стратегия не сводится к “набору индикаторов на графике”. Формат Invite‑Only обоснован тем, что в коде реализованы:
- Пользовательская модель импульса цена×объём на базе Z‑score и использование этого же сигнала для адаптивной TP‑геометрии.
- Связанный набор гардов , построенный вокруг реальных проблем крипто‑торговли (поздние входы после пампов, перетянутость от VWAP/EMA200, режимы сжатия, всплески объёма).
- Логика мэшапа : EMA200, VWAP, ADX, ATR и Anti‑Flat Gate работают согласованно как фильтр контекста для импульса, а не как независимые визуальные индикаторы.
На ETHUSDT, BTCUSDT и ряде других крипто‑пар Smart Impulse PRO показывала ≈90–94% винрейт и фактор прибыли выше 3.0 в тестах 2023–2025 годов при стандартных настройках фильтров и риска. Эти значения служат иллюстрацией поведения стратегии в прошлом и не являются обещанием аналогичных результатов в реальной торговле.
Предупреждение о рисках
Торговля криптовалютами связана с повышенным риском. Результаты бэктестов гипотетичны и предполагают идеальное исполнение без дополнительного проскальзывания и проблем с ликвидностью. Перед использованием стратегии на реальном счёте протестируйте её на своих инструментах и выбирайте риск на сделку в соответствии с личной толерантностью к убыткам.
FAQ
В: Гарантирует ли стратегия прибыль?
О: Нет. Это набор правил для принятия решений; результат зависит от рынка, настроек и исполнения. Любые бэктесты не гарантируют такую же доходность в будущем.
В: Можно ли использовать её на любой крипто‑паре?
О: Логика рассчитана на волатильные криптовалютные пары. Стратегия тестировалась на ETHUSDT, BTCUSDT и нескольких других мейджорах/альтах, но для каждого инструмента параметры желательно проверить и при необходимости подстроить.
В: Какой таймфрейм предпочтителен?
О: Стратегия рассчитана на внутридневную и свинговую торговлю в диапазоне 15m–4h. На младших ТФ сигналов больше и шума выше; на старших — сигналов меньше, но они формируются медленнее.
В: Можно ли отключать отдельные фильтры и гарды?
О: Можно. Трендовые фильтры, Anti‑Flat Gate и большинство гардов истощения включаются и выключаются отдельно. Рекомендуется менять настройки по одной и смотреть, как это влияет на заблокированные сигналы и кривую капитала.
В: Для чего нужны алерты?
О: Алерты отправляют JSON‑сообщение с направлением, ценой входа, стопом и уровнями TP через strategy.order.alert_message, что позволяет при желании подключать внешних ботов и панели управления риском.

Infinity Algo█ OVERVIEW
Infinity Algo is an all-in-one signal system with 5 entry modes, 6 take-profit levels, and built-in Auto-Tune optimization.
Switch between trend-following, contrarian, and sniper modes based on market conditions — all within one indicator. Auto-Tune tests 500+ parameter combinations to selects the best-scoring settings from historical simulations.
Includes on-chart TP/SL visualization, trailing stop modes, and webhook-ready alerts.
█ KEY FEATURES
✅ 5 Signal Modes: Normal, Smart, AI, HL Sniper, AI Sniper
✅ 3 Exit Modes: Percentage targets, Signal step-outs, Opposite signal
✅ 6 Take-Profit Levels with on-chart visualization
✅ Trailing Stop-Loss (Breakeven / Moving Target)
✅ Auto-Tune Parameter Optimization
✅ Visual Helpers: Bar coloring, gradient background, "signal coming" markers
✅ Built-in alert conditions for automation
✅ Designed for crypto, forex, stocks, indices, and commodities
█ WHAT MAKES THIS INDICATOR DIFFERENT
🧠 Auto-Tune Engine
Most indicators use static settings that fail when volatility shifts. Auto-Tune tests 500+ parameter combinations in the background — varying sensitivity, thresholds, and trigger configs — selects the best-scoring settings from historical simulations.
Choose from 12 scoring metrics: Sharpe Ratio, Sortino Ratio, Calmar Ratio, SQN, Martin Ratio, GPR, Win Rate, Total Profit, Average Profit, Profit Factor, and more.
Note: Auto-Tune is systematic parameter optimization on historical data — not predictive AI. Past performance does not guarantee future results.
🎯 Multi-Mode Signal System
One indicator, five signal modes:
Normal: Contrarian entries against the trend filter
Smart: Trend-following entries with the trend filter
Auto-Tune: Auto-optimized momentum signals
HL Sniper: More selective trend triggers
Auto-Tune Sniper: Auto-optimized sniper configuration
🛡️ Adaptive Risk Management
Trailing SL modes that respond to your TP hits — not arbitrary price levels. Lock in breakeven or ratchet your stop as profit grows.
👁️ Anticipation Markers
"Possible Long/Short Coming" labels appear when momentum approaches signal levels — giving you time to prepare before the signal fires.
█ SIGNAL MODES EXPLAINED
Normal + Smart (Default)
The dual-mode system that adapts to market conditions:
Normal Signals: Momentum threshold cross against the trend filter — contrarian plays for reversals and range boundaries
Smart Signals: Momentum threshold cross with the trend filter — trend-following plays for continuation moves
Auto-Tune Mode
Let the optimization engine find best-scoring settings:
Tests 500+ parameter combinations against historical data
Simulates trades using your configured TP/SL levels
Scores each configuration by your chosen metric (Sharpe, Sortino, Win Rate, etc.)
Walk-Forward: Re-optimizes every N bars to adapt to regime changes
Static: Locks in best-scoring settings from full available history
HL Sniper
For traders who prefer quality over quantity:
Trend-trigger mode for more selective entries
Fewer signals, more selective setups
Best suited for volatile markets where patience matters
Auto-Tune Sniper
Combines sniper selectivity with automatic optimization:
Optimizes RSI period, smoothing factor, and trigger sensitivity
Adapts configuration based on historical performance
Selective entries + adaptive parameters
█ EXIT & RISK MANAGEMENT
Percentage Targets
Up to 6 TP levels (TP1…TP6) with on-chart lines and labels
Configure price distance (%) and position size (%) for each level
Designed for scaling out positions systematically
Signal Step-Outs
Momentum-shift condition triggers partial exits
Optional higher-timeframe confirmation for stronger signals
"New TP Must Beat Last" prevents weak consecutive exits
Opposite Signal
Closes/flips position when the next opposite entry signal appears
Simple and effective for trend-following systems
Stop-Loss & Trailing
Fixed SL as % from entry (configurable separately for long/short)
Breakeven: Moves SL to entry price after chosen TP is hit
Moving Target: Advances SL to previous TP level as profit grows
█ VISUAL HELPERS
On-Chart TP/SL Lines: See your targets and stops directly on the chart
Bar Coloring: Candles colored by current signal bias
Background Gradient: Visual confirmation of position direction
"Possible Signal Coming" Markers: Anticipate entries before they trigger
Peak Profit Label: Track maximum unrealized profit during trades
█ AUTO-TUNE DASHBOARD
When Auto-Tune is enabled, the dashboard displays:
Current Parameters: Active sensitivity, thresholds, or sniper config
Simulated Performance: Trade count, win rate, P&L from internal backtest
Confidence Score: Stability indicator based on agreement among top configurations
Note: Auto-Tune is automated parameter selection on historical data — not predictive AI. It cannot guarantee future performance.
█ USE CASES
📈 Trending Markets
Use "Smart" signals + Percentage TPs. Stay aligned with momentum while scaling out at multiple targets. Enable Moving Target trailing to maximize winners.
📉 Ranging / Choppy Markets
Use "Normal" signals (contrarian mode). Catch reversals at range boundaries. Tighter TP targets and quicker exits work best.
⚡ High Volatility / News Events
Use "HL Sniper" for selective entries. Fewer signals, more selective. Wider SL to accommodate volatility.
🧪 New Asset / Unfamiliar Market
Enable "AI" mode and let Auto-Tune find optimal parameters. Great for exploring new markets without manual optimization.
🤖 Automation & Bots
Structured alert payloads work with popular bot platforms and custom webhooks. Entry + 6 TPs + SL in one alert.
█ HOW TO USE
Apply to your chart (any timeframe, any market)
Choose your signal mode based on market conditions
Pick your direction (Long / Short / Both)
Select exit mode: Percentage, Signals, or Opposite Signal
Configure TP levels and position sizing
Enable Stop-Loss and choose a trailing mode
Optional: Enable Auto-Tune for adaptive optimization
Set alerts for signals and TP/SL events
█ ALERTS
Built-in alert conditions for:
All entry signal types (Normal, Smart, AI, HL Sniper, AI Sniper)
TP hits (percentage levels or signal-based steps)
SL touch events
"Possible Long/Short Coming" anticipation markers
Tip: Create separate alerts for each condition. Use TradingView placeholders ({{ticker}}, {{close}}) in your alert messages.
█ WORKS ON
Crypto
Forex
Stocks
Indices
Commodities
█ REALISTIC EXPECTATIONS
No indicator wins 100% of the time — this is no exception
Signals should be combined with your own analysis
Auto-Tune optimizes on past data — it cannot predict the future
Always use proper position sizing and risk management
Paper trade or backtest before risking real capital
█ LIMITATIONS
Signals and overlays are decision-support tools — they cannot eliminate losses
Auto-Tune can overfit if used without out-of-sample validation
Multi-timeframe logic confirms on higher-TF closes — slight delay is expected
Best evaluated on standard candles with realistic fee/slippage assumptions
█ DISCLAIMER
This indicator is provided for educational and informational purposes only and does not constitute financial advice. Past performance is not indicative of future results. Trading involves substantial risk of loss, and you are solely responsible for your own trading decisions.

JFX Smart ORBJFX Smart ORB is a complete visual trading framework built around the classic
Opening Range Breakout (ORB) concept, enhanced with:
Fixed position sizing (lots)
Automatic Martingale-style size increase after full SL only
A full, event-based alert system for entries, targets, stops, and break-even exits
All of that, plus a clean dual-language HUD (AR/EN) directly on your chart.
What JFX Smart ORB Does
🔹 Smart Opening Range (ORB)
Automatically defines the opening range via:
Fixed timeframe (e.g., 30 minutes), or
Custom session window (e.g., 09:30–09:45) with configurable time zone (UTC-5, etc.).
Plots ORH / ORL and the midline, and shades the OR building zone for visual clarity.
🔹 Regime Detection (Context)
Background shading tells you where price is trading:
📈 Green: Above ORH (bullish regime)
📉 Red: Below ORL (bearish regime)
🔵 Neutral: Inside the OR range
This gives you an instant read on context before you even think about entries.
🔹 Trade Logic & Multi-Target Management
Automatic entry when:
Price breaks ORH for long trades
Price breaks ORL for short trades
Stop loss on the opposite side of the range.
Targets calculated in R-multiples:
TP1 = 0.5R
TP2 = 1R
TP3 = 2R
Position is split across TP1 / TP2 / TP3 according to user-defined percentages, normalized automatically.
💰 Fixed Size + Martingale After Loss Only
Inputs:
Capital ($) – for display/analysis
Base Position Size (lots) – your standard trade size
Contract per 1.00 lot – to convert price movement to P/L in dollars
If a trade hits a full stop loss before TP1, the indicator:
Doubles the position size for the next trade (Martingale factor).
If the trade hits any profit (TP1, TP2, TP3) or closes at Break-Even, the:
Martingale factor resets back to 1× (base size).
Everything is tracked and shown on the chart: current trade size, P/L per trade, and net P/L.
🧠 Session Protection & Inner-Range Logic
Optional session block:
After a strong winning trade (e.g., TP2 or TP3), you can block any further trades for the rest of the ORB session to avoid overtrading.
Inner-range logic after TP1:
Prevents immediate re-entry in the same direction after a BE exit from TP1.
Waits for price to return into a defined inner range around the OR midline, filtering out random noise.
📊 On-Chart HUD / Stats (AR & EN)
The built-in info panel shows in real time:
Session status:
✅ Trading enabled
🚫 Trading disabled until a new ORB
⏳ Waiting for two bars back inside the range
Current price regime (Above ORH / Below ORL / Inside OR).
Entry price, stop loss, TP1, TP2.
Total trades, losing trades, and win rate.
Counts of TP1 / TP2 / TP3 hits.
Reported capital, current position size (lots).
Current trade P/L and total net P/L in dollars.
🔔 Full Alert System (Ready for Webhooks/Bots)
The indicator generates per-bar event flags that feed into alertcondition() so you can build any alert setup you want (pop-up, email, SMS, webhook, bot, EA, etc.).
Available alerts:
Buy Entry: JFX_ORB_BUY_ENTRY
Sell Entry: JFX_ORB_SELL_ENTRY
Stop Loss Hit: JFX_ORB_SL_HIT
TP1 Hit: JFX_ORB_TP1
TP2 Hit: JFX_ORB_TP2
TP3 Hit: JFX_ORB_TP3
Break-Even Exit: JFX_ORB_BE_EXIT
Simply create alerts in TradingView based on these conditions and messages, or plug them into your automation via webhooks.
Who Is JFX Smart ORB For?
Day traders and scalpers who like structured ORB strategies instead of random entries.
Traders who want clear, rule-based entries, well-defined stops and multi-target exits.
Anyone looking to combine ORB + position management + Martingale logic + Alerts in a single, professional tool.
Disclaimer:
This indicator is a professional analysis and trade-management tool, not a guarantee of profit.
Always test on demo first and adapt the position sizing and Martingale behavior to your own risk management and trading plan.

--0-- Base Estrategias 4.0Universal Strategy Builder is an advanced multi-purpose trading engine designed for traders who want to build, test, and automate complete systems without writing Pine Script.
This tool combines multiple entry logics, dynamic filters, risk-management modules, and configurable exit conditions into a single framework.
It is not a “signal indicator.”
It is an infrastructure layer for creating strategies on any market and timeframe.
Key Features
• Entry Modules
Moving Average Cross
RSI-based setups
MACD setups
Chandelier Exit logic
Custom filters for trend, momentum and volatility
Multi-filter stacking (MA, RSI, MACD, AO, custom conditions)
• Risk Management
Percentage-based Stop Loss
ATR-based Stop Loss
Swing High/Low stop logic
Candle-based cancellation rules
Close-on-reversal option
• Take Profit System
Multiple TP levels
Percentage or ATR-derived targets
Multi-stage position scaling
Optional trailing stop with custom activation and distance
• Full MA Suite
6 independent moving averages
EMA/SMA/WMA/RMA
Flexible period and source selection
• Oscillator Suite
RSI (with OB/OS triggers and cross filters)
MACD with adjustable smoothing
Awesome Oscillator
Multi-timeframe filter options
• Bot-Ready
Designed to work seamlessly with:
Webhooks
External automation platforms
Copy-trading engines
Strategy replicators
Who Is This For?
This tool is intended for traders who want to:
Develop systematic strategies
Optimize entry/exit conditions
Combine multiple confirmation layers
Backtest ideas without coding
Build bot-ready setups quickly and consistently
Important Notes
This is a professional toolkit.
It does not predict the market or guarantee profitable results.
Performance depends entirely on how the user configures the system, market conditions, risk parameters, and execution quality.
Access
This script is provided as invite-only.
Please contact the author if you would like to request access.

HMS FVG Precision Engine⭐ HMS FVG Precision Engine — Official Description (Short & Professional)
HMS FVG Precision Engine is an advanced Fair Value Gap–based smart entry system designed for high-precision trading.
It automatically detects clean FVG zones, confirms them using multi-timeframe trend filters, and generates accurate LONG/SHORT signals with real-time alerts.
This tool is optimized for both manual and automated trading, including webhook-based bot execution.
It focuses on precision entries, multi-level trend validation, and clean chart visualization to help traders find high-probability setups without noise.
Key Features:
Smart FVG detection with precision filters
Multi-TF trend confirmation (5m–1H)
Automatic LONG & SHORT entry signals
TP1 / TP2 / TP3 and SL logic with alert support
Webhook-friendly alert format for bots
Lightweight, fast, and non-repainting
Clean, optimized visual markers
Perfect for scalping, day trading, and algorithmic entries.

ADX Breakout Enhanced Signal🥋 Trading Dojo – ADX Breakout Enhanced Signal
This indicator combines the trend-strength power of the ADX with dynamic breakout-based signals, designed for traders who want more frequent and higher-probability entries on timeframes like 1 hour.
The core logic focuses on:
📌 1. Trend Strength Detection with ADX
The indicator evaluates whether the market is showing a strong directional trend using an optimized ADX.
When ADX rises above the configured threshold, the system interprets that price has enough momentum to validate an entry.
📌 2. Breakout Entry Logic
It identifies points where price breaks recent highs or lows, confirming the start or continuation of movement.
This breakout-based approach produces more entries than traditional ADX strategies alone.
📌 3. Clear and Simple Signals
🟩 Long when price breaks a recent high with strong trend confirmation.
🟥 Short when price breaks a recent low with strong trend confirmation.
📌 4. Built-In Automated Alerts
The indicator automatically generates JSON alerts ready for use with automation tools such as trading bots, webhooks, BingX, 3Commas, Discord bots, and more.
🎯 Purpose of the Indicator
To provide more frequent, well-distributed, and momentum-validated entries, while maintaining simplicity and speed — perfect for real-time decision-making.
Perfect For:
Intraday trading
1h, 30m, and 15m timeframes
Breakout-based strategies
Automated trading systems

ICT Smart Money Trading Suite PRO [SwissAlgo]ICT SMC Trading Suite Pro
Structure Detection. Imbalance Tracking. Trade Planning. Contextual Alerts.
Why This Integrated System Was Built
The ICT/SMC methodology requires tracking multiple analytical components simultaneously - a process prone to manual errors, time inefficiency, and visual clutter . This indicator consolidates these elements into a single, unified system , providing rules-based validation for experienced ICT traders who may struggle with execution speed, consistency, and manual calculations.
-----------------------------------------------------------------
What This Indicator Does
ICT/SMC methodology involves tracking multiple analytical components simultaneously. This indicator consolidates them into a single system.
Common challenges when applying ICT manually:
1️⃣ Structure Identification
Determining which pivots qualify as external (macro) structure versus internal (micro) structure requires consistent rules. Inconsistent structure identification affects the detection of the relevant trading range for entries , Change of Character (ChoCH) , and Break of Structure (BoS) . Accurate structure identification is paramount ; a faulty reading invalidates the entire ICT thesis for the current swing. While no automated system can replace human judgment, the indicator provides you with a rules-based starting point for structural analysis. The key goal is to help you find and map the relevant structural leg to focus on.
2️⃣ Chart Organization
Drawing Fibonacci retracements, Fair Value Gaps, Order Blocks, and other imbalances manually creates visual complexity that can obscure the analysis. The indicator addresses this by striving to show all imbalances in a consistent, unified, and understandable visual way , using color coding and z-order layering to maintain clarity even when multiple components are active.
3️⃣ Imbalance Tracking
ICT methodology requires monitoring a vast array of institutional footprints : Fair Value Gaps (FVG), Order Blocks (OB), Breaker Blocks (BB), Liquidity Pools (LP), Volume Imbalances, Wick Imbalances, and Kill Zone ranges. Tracking all these simultaneously and manually monitoring their mitigation status is highly time-intensive and prone to oversight . The indicator constantly scans and tracks all key imbalance types for you, automatically updating their status and creating a dynamic, real-time visual heatmap of unmitigated institutional inefficiency.
4️⃣ Trade Calculation
Determining structure-based Stop Loss (SL) placement, calculating multiple Take Profit (TP) levels with accurate position-sizing splits, and computing the final blended Risk-to-Reward (R:R) ratio involves multiple time-sensitive, manual calculations per setup . The indicator automates this entire trade calculation process for you, instantly providing the necessary pricing (entry, SL, TP), sizing, and performance projections, and mitigating the risk of execution error .
5️⃣ Condition Monitoring
ICT setups often require specific technical conditions to align: price reaching discount Fibonacci levels (0.618-0.882 for shorts, 0.118-0.382 for longs), EMA crossovers confirming momentum, or structural shifts (ChoCH/BoS). Identifying these moments requires continuous chart observation across multiple assets and timeframes.
This indicator includes an alert system that monitors these technical conditions and sends notifications when they occur (real-time). The alert system is designed to minimize spam. This allows traders to review potential setups on demand rather than through continuous observation - particularly relevant for those monitoring multiple instruments or trading sessions outside their local timezone.
-----------------------------------------------------------------
Intended Use
This indicator is designed for traders who:
♦ Apply ICT/SMC methodology - Familiarity with concepts such as Fair Value Gaps, Order Blocks, Liquidity Pools, market structure, and discount/premium zones is assumed. The indicator does not teach these concepts but provides tools to apply them.
♦ Trade on intraday to swing timeframes - The structure detection and Fibonacci zone mapping work across multiple timeframes. Recommended primary timeframe: 1H (adjustable based on trading approach).
♦ Prefer systematic entry planning - The trade calculation feature computes stop loss, take profit levels, and risk-to-reward ratios based on structure and Fibonacci positioning. Suitable for traders who use defined entry criteria.
♦ Monitor multiple instruments or sessions - The alert functionality notifies when specific technical conditions occur (discount zone entries, EMA crossovers, structure changes), reducing the need for continuous manual monitoring.
♦ Use trade execution platforms - The trade summary table displays pre-formatted values (entry, SL, TP levels with quantity splits) that can be manually input into trading platforms or bot services like 3Commas.
-----------------------------------------------------------------
How To Use
Step 1: Structure Analysis
The indicator automatically detects external and internal market structure using pivot analysis. Structure lines are color-coded: red for bearish structure, green for bullish. External pivots are marked with larger triangles, internal pivots with smaller markers. The pivot length parameters (default: 20/20) can be adjusted in settings to align with your structural analysis approach and the asset you are analyzing.
Step 2: Define Your Trading Zone
Use the "Start Swing" and "End Swing" date inputs to mark the beginning and end of the (external) structural leg you wish to analyze. The indicator calculates Fibonacci retracement levels based on these points and color-codes the zones:
* Green zones: Discount area (0.618-0.882 for bearish / 0.118-0.382 for bullish)
* Yellow zones: Premium area (0.786-1.0 for bearish / 0.0-0.214 for bullish)
* Red zones: Extension area beyond structure (potential fake-out zones)
Step 3: Review Imbalances
The indicator identifies and displays multiple imbalance types:
🔥 Volume imbalances (from displacement candles based on PVSRA methodology)
🔥 Fair Value Gaps (FVG)
🔥 Order Blocks (OB) and Breaker Blocks (BB)
🔥 Liquidity Pools (LP) at equal highs/lows
🔥 Wick imbalances (exceptional wick formations)
🔥 Kill Zone liquidity from specific trading sessions (Asian, London, NY AM)
Volume Imbalances
Fair Value Gaps
Order Blocks
Liquidity Pools
Wick Imbalances
Kill Zone Imbalances
According to ICT methodology, imbalances act as price magnets - areas where price tends to return for mitigation. When multiple imbalances overlap at the same price level, this creates a confluence zone with a higher probability of price reaction .
Imbalances are displayed as gray boxes , creating a visual heatmap of institutional inefficiencies. When imbalances overlap, the zones appear darker due to layering, and labels combine to show confluence (e.g., "FVG + OB" or "Vol + LP").
Heatmap of Imbalances
User can view each type alone, or all together (heatmap)
Each imbalance type is tracked until mitigated by price according to ICT principles and can be toggled on/off independently in settings.
Step 4: Reference Levels & Sessions
The indicator displays additional reference data:
🔥 Daily Pivot Points (PP, R1-R3, S1-S3) calculated from previous day
🔥Average Daily Range (ADR) projected from the current day's extremes
🔥 Daily OHLC levels: Today's Open (DO), Previous Day High (PDH), Previous Day Low (PDL)
🔥Session backgrounds (optional): Color-coded boxes for Asian, London, NY AM, and NY PM sessions
Sessions
While these are not ICT-specific imbalances, they represent widely-watched price levels that often attract institutional activity and can act as additional reference points for support, resistance, and liquidity targeting.
All reference levels can be toggled independently in settings.
Step 5: Momentum Reference
EMA 14 and EMA 21 lines are displayed for momentum analysis. When EMA 14 enters discount zones and crosses EMA 21, a triangle marker appears on the chart. This indicates a potential alignment of structure and momentum conditions.
Step 6: Trade Planning
Input your intended entry price in the "Entry Price" field along with your margin and leverage parameters. The indicator automatically calculates all trade parameters:
* Stop loss level (based on Fibonacci structure - typically at 1.118 extension)
* Three take profit levels (TP1, TP2, TP3) with position quantity splits
* Risk-to-reward ratio (blended across all three targets)
* Projected profit/loss values in both dollars and percentage
All calculated values are displayed both visually on the chart (as horizontal lines with labels) and in a formatted Trade Summary table. The table organizes the information for quick reference: entry details, take profit levels with quantities, stop loss parameters, and performance projections.
This pre-calculated data can be manually copied into trading platforms or bot services (such as 3Commas Smart Trades) without requiring additional calculations.
Step 7: Alert Configuration
Create alerts using TradingView's alert system (select "Any alert() function call"). The indicator sends notifications when:
* Price reaches specific discount Fibonacci levels (0.618, 0.786, 0.882 for shorts / 0.382, 0.214, 0.118 for longs)
* EMA 14/21 crossovers occur within discount zones
* Change of Character (ChoCH) is detected
* Break of Structure (BoS) is detected
Note: Alerts require active TradingView alert functionality. Update alerts when changing your trading zone parameters.
-----------------------------------------------------------------
Key Features
Structure & Zone Analysis
* Automated structure detection with external/internal pivots and zig-zag visualization
* Fibonacci retracement mapping with color-coded discount/premium zones
* Visual zone classification: Green (optimal discount), Yellow (premium), Red (fake-out risk)
ICT Imbalances Heatmap
* Volume imbalances (PVSRA displacement candles)
* Fair Value Gaps (FVG)
* Order Blocks (OB) and Breaker Blocks (BB)
* Liquidity Pools (LP) at equal highs/lows
* Wick imbalances (exceptional wick formations)
* Kill Zone liquidity (Asian, London, NY AM sessions)
* Confluence detection with combined labels and visual layering
Reference Levels
* Daily Pivot Points (PP, R1-R3, S1-S3)
* Average Daily Range (ADR) projections
* Daily OHLC levels (DO, PDH, PDL)
* Session backgrounds for kill zones
Trade Planning Tools
* Automated stop loss calculation based on Fibonacci structure
* Three-tier take profit system with position quantity splits
* Risk-to-reward ratio calculation (blended across all targets)
* P&L projections in dollars and percentages
* Trade Summary table formatted for manual platform entry
Momentum & Signals
* EMA 14/21 overlay for momentum analysis
* Visual crossover markers (triangles) in discount zones
* Change of Character (ChoCH) detection and labels
* Break of Structure (BoS) detection and labels
Chart Enhancements
* Higher timeframe candle overlay (5m to Monthly)
* PVSRA candle coloring (volume-based)
* Symbol legend for quick reference
* Customizable visual elements (toggle all components independently)
Alert System
* Discount zone entry notifications (Fibonacci level monitoring)
* EMA crossover signals within discount zones
* Structure change alerts (ChoCH and BoS)
* Configurable via TradingView alert functionality
Alert Functionality
The indicator includes an alert system that monitors technical conditions continuously.
When configured, alerts notify users when specific events occur:
❗ Discount Zone Monitoring
When EMA 14 crosses into key Fibonacci levels (0.618, 0.786, 0.882 for bearish structure / 0.382, 0.214, 0.118 for bullish structure), an alert is triggered. Example: Trading BTC and ETH simultaneously - instead of monitoring both charts for zone entries, alerts notify when either asset reaches the specified level.
❗ Momentum Alignment
When EMA 14 crosses EMA 21 within discount zones, an alert is sent. Example: Monitoring setups across multiple timeframes (1H, 4H, Daily) - alerts indicate when momentum conditions align on any timeframe being tracked.
❗ Structure Changes
Change of Character (ChoCH) and Break of Structure (BoS) events trigger alerts. Example: Trading during the Asian session while located in a different timezone - alerts notify of structure changes occurring outside active monitoring hours.
Configuration
Alerts are set up through TradingView's native alert system. Select "Any alert() function call" when creating the alert.
⚠️ Note: Alert parameters are captured at creation time, so alerts must be updated when changing trading zone settings (Start/End Swing dates) or any other parameter.
How to Create Alerts
Step 1: Open Alert Creation
Click the "Alert" button (clock icon) in the top toolbar of TradingView, or right-click on the chart and select "Add Alert."
Step 2: Configure Alert Condition
* In the alert dialog, set the Condition dropdown to select this indicator
* Set the alert type to ⚠️ " Any alert() function call "
* This configuration allows the indicator to trigger alerts based on its internal logic
Step 3: Set Alert Timing
* Timeframe: Same as chart
* Expiration: Choose "Open-ended (when triggered)" to keep the alert active until conditions occur
* Message tab: choose a name for the alert
Step 4: Notification Settings
Configure how you want to receive notifications:
* Popup within TradingView
* Email notification
* Mobile app push notification (requires TradingView mobile app)
Step 5: Create
Important Notes:
* Alert parameters are captured at creation time . If you change your trading zone (Start/End Swing dates) or entry price, delete the old alert and create a new one .
* One alert per chart: Create separate alerts for each instrument and timeframe you're monitoring.
* TradingView alert limits apply based on your TradingView subscription tier.
What Triggers Alerts: This indicator sends alerts for four key event types:
1. Discount Zone Entry - EMA 14 crossing key Fibonacci levels
2. Momentum Crossover - EMA 14/21 crossovers within discount zones
3. Change of Character (ChoCH) - Structure reversal detected
4. Break of Structure (BoS) - Trend continuation confirmed
All four conditions are monitored by a single alert configuration .
-----------------------------------------------------------------
Recommended Settings
* Timeframe : 1H works well for most assets
* Theme : Dark mode recommended
* Structural Pivots : Default 20/20 captures reasonable structure; adjust to match your analysis
-----------------------------------------------------------------
Chart Elements Guide
♦ Structure Visualization
Zig-zag lines
Automated structure detection - green lines indicate bullish structure, red lines indicate bearish structure. Thick lines represent external structure , thin faded lines show internal structure .
Triangle markers
Large triangles mark external pivots (swing highs/lows), small triangles mark internal pivots.
Fibonacci Zones
* Green zones: Discount area - potential entry zones (0.618-0.882 for shorts / 0.118-0.382 for longs)
* Yellow zones: Premium area - higher extension zones (0.786-1.0 for shorts / 0.0-0.214 for longs)
* Red zones: Fake-out risk area - price beyond structural extremes (above 1.0 for shorts / below 0.0 for longs)
* White dashed lines: Individual Fibonacci levels (1.0, 0.882, 0.786, 0.618, 0.5, 0.382, 0.214, 0.118, 0.0)
♦ Imbalance Heatmap
Gray boxes with dotted midlines
Unmitigated imbalances create a visual heatmap. Overlapping imbalances appear darker due to layering.
Combined labels
When multiple imbalances overlap, labels show confluence (e.g., "FVG + OB", "Vol + LP + Wick")
Types displayed : Vol (Volume), FVG (Fair Value Gap), OB (Order Block), BB (Breaker Block), LP (Liquidity Pool), Wick, KZ (Kill Zone)
♦ Momentum Indicators
* Red line: EMA 14
* Yellow line: EMA 21
* Small triangles on price: Crossover signals - red triangle (bearish crossover), green triangle (bullish crossover) when occurring within discount zones
♦ Structure Change Markers
* Labels with checkmarks/crosses: ChoCH (Change of Character) and BoS (Break of Structure) events (Green label with ✓: Bullish ChoCH or BoS, Red label with ✗: Bearish ChoCH or BoS)
♦ Trade Planning Lines (when entry price is set)
* Blue horizontal line: Entry price
* Green dashed lines: TP1 and TP2
* Green solid line: TP3 (final target)
* Red horizontal line: Stop Loss level
TP levels and SL are calculated based on the structure range, entry price, and mapped trading zone, and aim to achieve a minimum risk: reward ratio of 1:1.5 (R:R)
♦ Colored background zones:
Green shading between entry and TP3 (profit zone), red shading between entry and SL (loss zone)
♦ Reference Levels
* Orange dotted lines with labels: Daily Pivot Points (PP, R1-R3, S1-S3)
* Purple dotted lines with labels: ADR High and ADR Low projections
* Cyan dotted lines with labels: DO (Daily Open), PDH (Previous Day High), PDL (Previous Day Low)
♦ Session Backgrounds (optional)
* Yellow shaded box: Asian session (19:00-00:00 NY time)
* Blue shaded box: London session (02:00-05:00 NY time)
* Green shaded box: NY AM session (09:30-11:00 NY time)
* Orange shaded box: NY PM session (13:30-16:00 NY time)
♦ Trade Summary Table (top-right corner)
Displays a complete trade plan with sections:
* Sanity Check: Plan validation status
* Setup: Trade type, leverage, entry price, position size
* Take Profit: TP1, TP2, TP3 with prices, percentages, and quantity splits
* Stop Loss: SL price and type
* Performance: Potential profit/loss, ROI, and risk-to-reward ratio
♦ HTF Candle Overlay (optional, displayed to the right of the current price)
* Larger candlesticks representing higher timeframe price action
* Green bodies: Bullish HTF candles
* Red bodies: Bearish HTF candles
* Label shows selected timeframe (e.g., "HTF→ D" for daily)
♦ Legend Table (bottom-right corner)
Quick reference guide explaining all symbol abbreviations and color codes used on the chart.
-----------------------------------------------------------------
Methodology & Calculation Details
This indicator consolidates multiple ICT/SMC analytical components into a single integrated system. While individual elements could be created separately, this integration provides automated coordination between components , consistency, and reduces chart complexity.
Structure Detection External and internal pivots
Are identified using fractal pivot analysis with configurable lookback periods (default: 20 bars for both). A pivot high is confirmed when the high at the pivot bar exceeds all highs within the lookback range on both sides. Pivot lows use inverse logic. Structure lines connect validated pivots, with color coding based on price direction (higher highs/higher lows = bullish, lower highs/lower lows = bearish).
Fibonacci Retracement Calculation
Users define two swing points via date/time inputs. The indicator calculates the price range between these points and applies standard Fibonacci ratios (0.0, 0.118, 0.214, 0.382, 0.5, 0.618, 0.786, 0.882, 1.0, plus extensions at 1.118, 1.272, -0.118, -0.272). Zone classification is based on ICT discount/premium principles: 0.618-1.0 range for bearish setups, 0.0-0.382 for bullish setups.
Imbalance Identification
Volume Imbalances : Detected using PVSRA (Price, Volume, Support, Resistance Analysis) methodology. Candles are classified based on the percentile ranking of volume and price range over a 1344-bar lookback period. Type 1 imbalances require ≥95th percentile in both volume and range; Type 2 requires ≥85th percentile. Additional filters include body-to-range ratio (≥50% for Type 1, ≥30% for Type 2) and ATR validation.
Fair Value Gaps (FVG) : Identified when a three-candle sequence shows a price gap: low > high for bullish FVG, high < low for bearish FVG. The middle candle must close beyond the gap edge. Mitigation occurs when the price retraces into the gap.
Order Blocks (OB) : Detected by identifying the last opposing candle before a significant price move. When price breaks a swing high/low, the algorithm scans backwards to find the candle with the highest high (bearish OB) or lowest low (bullish OB) before the breakout. When an OB is breached, it converts to a Breaker Block (BB).
Liquidity Pools (LP) : Identified by detecting equal highs or equal lows using a tolerance threshold based on ATR. Pivot highs/lows within this tolerance range are grouped. Equal highs create Buy-Side Liquidity (BSL) zones above the level; equal lows create Sell-Side Liquidity (SSL) zones below the level.
Wick Imbalances: Flagged when a candle's wick exceeds 1.0x ATR and comprises >50% of the total candle range. These represent rapid rejections or absorption events.
Kill Zone Liquidity: Tracks the high/low range during specific ICT-defined sessions (Asian: 19:00-00:00 NY, London: 02:00-05:00 NY, NY AM: 09:30-11:00 NY). At session close, BSL and SSL zones are created above/below the session range.
Change of Character (ChoCH) & Break of Structure (BoS)
ChoCH is detected when price breaks counter to the established structure (bearish structure broken upward = bullish ChoCH; bullish structure broken downward = bearish ChoCH). BoS occurs when price breaks in the direction of the established trend (bearish structure breaking lower = bearish BoS; bullish structure breaking higher = bullish BoS).
Trade Calculations
Stop Loss and Take Profit levels are calculated based on the entry position within the Fibonacci zone structure:
* Premium entries (0.786-1.0 for shorts / 0.0-0.214 for longs): SL at 1.118/-0.118 extension, TP structure weighted toward zone extremes
* Golden entries (0.618-0.786 for shorts / 0.214-0.382 for longs): SL at 1.0/0.0 boundary, TP structure balanced across range
Risk-to-reward ratios are calculated as blended values across all three take profit levels, weighted by position quantity splits.
Reference Level Calculations
* Pivot Points: Standard formula using previous day's high, low, and close: PP = (H + L + C) / 3
* Support/Resistance: R1 = 2×PP - L, S1 = 2×PP - H, with R2/S2 and R3/S3 calculated using range extensions
* ADR: 14-period simple moving average of daily high-low range, projected from current day's extremes
Momentum Analysis
EMA 14 and EMA 21 use standard exponential moving average calculations. Crossovers are detected when EMA 14 crosses EMA 21 within user-defined discount zones, with directional confirmation (cross under in bearish discount = short signal; cross over in bullish discount = long signal).
Why This Integration Matters
While components like EMA crossovers, pivot detection, or Fibonacci retracements exist as separate indicators, this system provides:
1. Coordinated Analysis : All components reference the same structural framework (user-defined trading zone)
2. Automated Mitigation Tracking : Imbalances are monitored continuously and removed when mitigated according to ICT principles
3. Contextual Alerts : Notifications are triggered only when conditions align within the defined structural context
4. Trade Parameter Automation : Stop loss and take profit calculations adjust dynamically based on entry positioning within the structure
5. Consistent Visual Display : All elements use a unified color scheme, labeling system, and z-order layering. This eliminates visual conflicts that occur when stacking multiple independent indicators (overlapping lines, label collisions, inconsistent transparency levels, conflicting color schemes).
This consolidation reduces the need to manually coordinate 8-10 separate indicators, eliminates redundant calculations across disconnected tools, and maintains visual clarity even when all components are displayed simultaneously.
-----------------------------------------------------------------
Disclaimer
1. Indicator Functionality and Purpose
This indicator is solely a technical analysis tool built upon established methodologies (Smart Money Concepts/ICT) and statistical calculations (Pivots, Fibonacci, EMAs). It is designed to assist experienced traders in visualizing complex data, streamlining the analytical workflow, and automating conditional alerting.
The indicator is NOT:
♦ Financial Advice: It does not provide personalized investment recommendations, solicited advice, or instruction on buying, selling, or holding any financial instrument.
♦ A Guarantee of Profit: The presence of a signal, alert, or trade plan output by this tool does not guarantee that any trade will be profitable.
♦ A Predictor of Future Prices: The tool calculates probabilities and potential scenarios based on historical data and current structure; it does not predict future market movements.
2. General Trading Risks and Capital Loss
♦ All trading involves substantial risk of loss. You may lose some or all of your initial capital. Leveraged products, such as futures, CFDs, and margin trading, carry a high degree of risk and are not suitable for all investors.
♦ Risk Acknowledgment: By using this indicator, you acknowledge and accept that you are solely responsible for all trading decisions, and you bear the full risk of any resulting profit or loss.
♦ Risk Management is Crucial: This indicator is an analytical tool only. You must employ independent risk management techniques (position sizing, stop-loss orders) tailored to your personal financial situation and risk tolerance.
3. Calculation Limitations and Non-Real-Time Data
The calculations performed by this indicator are based on the data provided by your charting platform (e.g., TradingView).
♦ Data Accuracy: The accuracy of the outputs (e.g., Price Delivery Arrays, Pivots, P&L projections) is dependent on the accuracy and real-time nature of the underlying market data feed.
♦ Latencies: Trade alerts and signals may be subject to minor delays due to server processing, internet connectivity, or charting platform performance. Do not rely solely on alerts for execution.
♦ Backtesting and Performance: Any depiction of past performance, including data visible on the chart, is not indicative of future results. Trading results will vary based on market conditions, liquidity, and execution speed.
4. Software and Platform Disclaimer
"As Is" Basis: The indicator is provided on an "as is" basis without warranties of any kind, whether express or implied. The author does not guarantee the script will be error-free or operate without interruption.
Third-Party Integration: This indicator is not affiliated with, endorsed by, or connected to TradingView, 3Commas, or any other broker or execution platform. All third-party names are trademarks of their respective owners. The formatting of the Trade Summary Table for 3Commas is for user convenience only.
5. Required Competency (User Responsibility)
This indicator is built on the assumption that the user is an experienced trader with a working understanding of the complex concepts being visualized (ICT/SMC, FVG, Order Blocks, Liquidity, etc.). The indicator does not teach these concepts.
You Must Always Do Your Own Research (DYOR) before making any trading decision based on signals or visualization provided by this tool.
By installing and using this indicator, you explicitly agree to these terms and assume full responsibility for all trading activity.

Delta Zones Smart Money Concept (SMC) UT Trend Reversal Mul.Sig.🚀 What's New in This Version (V5 Update)
This version is a major overhaul focused on improving trade entry timing and risk management through enhanced UT Bot functionality:
Integrated UT Trailing Stop (ATR-based): The primary trend filter and moving stop-loss mechanism is now fully integrated.
Pre-Warning Line: A revolutionary feature that alerts traders when the price penetrates a specific percentage distance (customizable) from the UT Trailing Stop before the main reversal signal fires.
"Ready" Signal: Plots a "Ready" warning label on the chart and triggers an alert condition (UT Ready Long/Short) for pre-emptive trade preparation.
V5 Compatibility: All code has been optimized for Pine Script version 5, utilizing the modern array and type structures for efficient Order Block and Breaker Block detection.
💡 How to Use This Indicator
This indicator works best when confirming signals across different components:
1. Identify the Trend Bias (UT Trailing Stop)
Uptrend: UT Trailing Stop line is Green (Focus only on Buy/Long opportunities).
Downtrend: UT Trailing Stop line is Red (Focus only on Sell/Short opportunities).
2. Prepare for Entry (Warning Line)
Action: When you see the "Ready" label or the price hits the Pre-Warning Line (Dotted Orange Line), this is your alert to prepare for a trend flip, or to tighten the stop on your current trade.
3. Confirm the Entry (Multi-Signals)
Look for a primary entry signal that aligns with the desired trend:
High-Conviction Entry: Wait for the UT Buy/Sell label (confirmed trend flip) AND a Combined Buy/Sell arrow (confirmed by your selected Oscillator settings).
High-Liquidity Entry: Look for a Delta Zone Box forming near an active Order Block or Breaker Block (SMC zones), and then confirm with a UT or Combined Signal.
4. Manage Risk (Trailing Stop)
Always set your initial Stop Loss (SL) either just outside the opposite Order Block or at the UT Trailing Stop level itself.
If the price closes back across the UT Trailing Stop, exit your position immediately, as the trend bias has officially shifted.
Features & Components
1. Delta Zones (Liquidity/Wick Pressure)
Identifies periods of extreme buying or selling pressure based on wick-to-body ratios and standard deviation analysis.
Plots colored pressure boxes (Buy/Sell) to highlight potential exhaustion points or institutional activity.
2. Smart Money Concepts (SMC)
Automatically detects and plots Order Blocks (OBs) and Breaker Blocks (BBs) based on confirmed Market Structure Breaks (MSBs).
Includes Chop Control logic to remove less reliable Breaker Blocks.
3. UT Bot Trailing Stop & Warning Line
UT Trailing Stop (ATR-based): Plots a dynamic trend line (Green/Red) that acts as a moving stop-loss and primary trend filter.
Ready/Warning Signals: Alerts traders (via the "Ready" label and orange lines) when the price enters a "Pre-Reversal Zone" near the Trailing Stop.
4. Multi-Indicator Confirmation (Filters)
Includes customizable signals based on the crossover/crossunder of RSI, CCI, and Stochastic indicators against configurable Overbought/Oversold levels.
Allows selection of combination signals (e.g., RSI & CCI, All Combined, etc.) for high-conviction entries.

FxAST Ichi ProSeries Enhanced Full Market Regime EngineFxAST Ichi ProSeries v1.x is a modernized Ichimoku engine that keeps the classic logic but adds a full market regime engine for any market and instrument.”
Multi-timeframe cloud overlay
Oracle long-term baseline
Trend regime classifier (Bull / Bear / Transition / Range)
Chikou & Cloud breakout signals
HTF + Oracle + Trend dashboard
Alert-ready structure for automation
No repainting: all HTF calls use lookahead_off.
1. Core Ichimoku Engine
Code sections:
Input group: Core Ichimoku
Function: ichiCalc()
Variables: tenkan, kijun, spanA, spanB, chikou
What it does
Calculates the classic Ichimoku components:
Tenkan (Conversion Line) – fast Donchian average (convLen)
Kijun (Base Line) – slower Donchian average (baseLen)
Senkou Span A (Span A / Lead1) – (Tenkan + Kijun)/2
Senkou Span B (Span B / Lead2) – Donchian over spanBLen
Chikou – current close shifted back in time (displace)
Everything else in the indicator builds on this engine.
How to use it (trading)
Tenkan vs Kijun = short-term vs medium-term balance.
Tenkan above Kijun = short-term bullish control; below = bearish control.
Span A / B defines the cloud, which represents equilibrium and support/resistance.
Price above cloud = bullish bias; price below cloud = bearish bias.
Graphic
2. Display & Cloud Styling
Code sections:
Input groups: Display Options, Cloud Styling, Lagging Span & Signals
Variables: showTenkan, showKijun, showChikou, showCloud, bullCloudColor, bearCloudColor, cloudLineWidth, laggingColor
Plots: plot(tenkan), plot(kijun), plot(chikou), p1, p2, fill(p1, p2, ...)
What it does
Lets you toggle individual components:
Show/hide Tenkan, Kijun, Chikou, and the cloud.
Customize cloud colors & opacity:
bullCloudColor when Span A > Span B
bearCloudColor when Span A < Span B
Adjust cloud line width for clarity.
How to use it
Turn off components you don’t use (e.g., hide Chikou if you only want cloud + Tenkan/Kijun).
For higher-timeframe or noisy charts, use thicker Kijun & cloud so structure is easier to see.
Graphic
Before
After
3. HTF Cloud Overlay (Multi-Timeframe)
Code sections:
Input group: HTF Cloud Overlay
Vars: showHTFCloud, htfTf, htfAlpha
Logic: request.security(..., ichiCalc(...)) → htfSpanA, htfSpanB
Plots: pHTF1, pHTF2, fill(pHTF1, pHTF2, ...)
What it does
Pulls higher-timeframe Ichimoku cloud (e.g., 1H, 4H, Daily) onto your current chart.
Uses the same Ichimoku settings but aggregates on htfTf.
Plots an extra, semi-transparent cloud ahead of price:
Greenish when HTF Span A > Span B
Reddish when HTF Span B > Span A
How to use it
Trade LTF (e.g., 5m/15m) only in alignment with HTF trend:
HTF cloud bullish + LTF Ichi bullish → look for longs
HTF cloud bearish + LTF Ichi bearish → look for shorts
Treat HTF cloud boundaries as major S/R zones.
Graphic
4. Oracle Module
Code sections:
Input group: Oracle Module
Vars: useOracle, oracleLen, oracleColor, oracleWidth, oracleSlopeLen
Logic: oracleLine = donchian(oracleLen); slope check vs oracleLine
Plot: plot(useOracle ? oracleLine : na, "Oracle", ...)
What it does
Creates a long-term Donchian baseline (default 208 bars).
Uses a simple slope check:
Current Oracle > Oracle oracleSlopeLen bars ago → Oracle Bull
Current Oracle < Oracle oracleSlopeLen bars ago → Oracle Bear
Slope state is also shown in the dashboard (“Bull / Bear / Flat”).
How to use it
Think of Oracle as your macro anchor :
Only take longs when Oracle is sloping up or flat.
Only take shorts when Oracle is sloping down or flat.
Works well combined with HTF cloud:
HTF cloud bullish + Oracle Bull = higher conviction long bias.
Ideal for Gold / Indices swing trades as a trend filter.
Graphic idea
5. Trend Regime Classifier
Code sections:
Input group: Trend Regime Logic
Vars: useTrendRegime, bgTrendOpacity, minTrendScore
Logic:
priceAboveCloud, priceBelowCloud, priceInsideCloud
Tenkan vs Kijun alignment
Cloud bullish/bearish
bullScore / bearScore (0–3)
regime + regimeLabel + regimeColor
Visuals: bgcolor(regimeColor) and optional barcolor() in priceColoring mode.
What it does
Scores the market in three dimensions :
Price vs Cloud
Tenkan vs Kijun
Cloud Direction (Span A vs Span B)
Each condition contributes +1 to either bullScore or bearScore .
Then:
Bull regime when:
bullScore >= minTrendScore and bullScore > bearScore
Price in cloud → “Range”
Everything else → “Transition”
These regimes are shown as:
Background colors:
Teal = Bull
Maroon = Bear
Orange = Range
Silver = Transition
Optional candle recoloring when priceColoring = true.
How to use it
Filters:
Only buy when regime = Bull or Transition and Oracle/HTF agree.
Only sell when regime = Bear or Transition and Oracle/HTF agree.
No trade zone:
When regime = Range (price inside cloud), avoid new entries; wait for break.
Aggressiveness:
Adjust minTrendScore to be stricter (3) or looser (1).
Graphic
6. Signals: Chikou & Cloud Breakout
Code sections :
Logic:
chikouBuySignal = ta.crossover(chikou, close)
chikouSellSignal = ta.crossunder(chikou, close)
cloudBreakUp = priceInsideCloud and priceAboveCloud
cloudBreakDown = priceInsideCloud and priceBelowCloud
What it does
1. Two key signal groups:
Chikou Cross Signals
Buy when Chikou crosses up through price.
Sell when Chikou crosses down through price.
Classic Ichi confirmation idea: Chikou breaking free of price cluster.
2. Cloud Breakout Signals
Long trigger: yesterday inside cloud → today price breaks above cloud.
Short trigger: yesterday inside cloud → today price breaks below cloud.
Captures “equilibrium → expansion” moves.
These are conditions only in this version (no chart shapes yet) but are fully wired for alerts. (Future Updates)
How to use it
Use Chikou signals as confirmation, not standalone entries:
Eg., Bull regime + Oracle Bull + cloud breakout + Chikou Buy.
Use Cloud Breakouts to catch the first impulsive leg after consolidation.
Graphic
7. Alerts (Automation Ready)
[
b]Code sections:
Input group: Alerts
Vars: useAlertTrend, useAlertChikou, useAlertCloudBO
Alert lines like: "FxAST Ichi Bull Trend", "FxAST Ichi Bull Trend", "FxAST Ichi Cloud Break Up"
What it does
Provides ready-made alert hooks for:
Trend regime (Bull / Bear)
Chikou cross buy/sell
Cloud breakout up/down
Each type can be globally toggled on/off via the inputs (helpful if a user only wants one kind).
How to use it
In TradingView: set alerts using “Any alert() function call” on this indicator.
Then filter which ones fire by:
Turning specific alert toggles on/off in input panel, or
Filtering text in your external bot / webhook side.
Example simple workflow ---> Indicator ---> TV Alert ---> Webhook ---> Bot/Broker
8. FxAST Dashboard
Code sections:
Input group: Dashboard
Vars: showDashboard, dashPos, dash, dashInit
Helper: getDashPos() → position.*
Table cells (updated on barstate.islast):
Row 0: Regime + label
Row 1: Oracle status (Bull / Bear / Flat / Off)
Row 2: HTF Cloud (On + TF / Off)
Row 3: Scores (BullScore / BearScore)
What it does
Displays a compact panel with the state of the whole system :
Current Trend Regime (Bull / Bear / Transition / Range)
Oracle slope state
Whether HTF Cloud is active + which timeframe
Raw Bull / Bear scores (0–3 each)
Position can be set: Top Right, Top Left, Bottom Right, Bottom Left.
How to use it
Treat it like a pilot instrument cluster :
Quick glance: “Are my trend, oracle and HTF all aligned?”
Great for streaming / screenshots: everything important is visible in one place without reading the code.
Graphic (lower right of chart )

Delta Zones Buy/Sell Pressure UT Plus Delta Zones Buy/Sell Pressure: All-in-One Smart Trading Indicator
💡 Summary: This Indicator is designed as a powerful All-in-One analysis tool, consolidating 4 crucial trading strategies: Delta Zones (Extreme Pressure), Orderblocks & Breaker Blocks (Market Structure), Multi-Indicator Signals (RSI/CCI/Stoch), and UT Bot Alerts (Trend Signals). It provides a comprehensive trading setup on a single chart.
🔎 Key Features:
Delta Zones (Extreme Buy/Sell Pressure): Utilizes Standard Deviation to spot candles with abnormal Buy/Sell Pressure, often indicating institutional activity or stop hunts.
Orderblocks & Breaker Blocks: Automatically analyzes Market Structure Shifts (MSS) to draw Orderblocks and convert them into Breaker Blocks, serving as key support/resistance zones.
Multi-Indicator Signals (RSI/CCI/Stoch): Provides confirmed Buy/Sell signals when RSI, CCI, and Stochastic are in Oversold/Overbought conditions and show reversal action (Users can select the combination).
UT Bot Alerts: Includes a ATR-based Trailing Stop system and secondary Buy/Sell signals for trend confirmation.
🚀 How to Use:
Use the "BUY/SELL" signals from the Multi-Indicator section as the primary trigger.
Use the Delta Zones or Orderblocks/Breaker Blocks as high-confidence confirmation zones for entry/exit, and as precise Stop Loss placement areas.
⚠️ Note on Performance: This Indicator uses complex logic (especially Array and Box drawing functions) and may be resource-intensive on lower timeframes.

Alerts v6The strategy includes:
✅ EMA-based trend direction (fast vs slow)
✅ RSI filtering for overbought/oversold control
✅ ADX confirmation for strong trend validation
✅ Pullback & BOS detection for precision entries
✅ Per-bar change logic for adaptive entry timing
✅ Session/day gating to control trading hours
✅ JSON alert integration for AI trading bots or webhooks
This script is Pine Script v6 compatible and optimized for automated alert-based trading setups such as AI trading bots, webhook systems, and VPS-linked executions.
Recommended Timeframes: 5m, 15m, 30m
Markets: XAUUSD, FX pairs, indices, and metals

Scalping m15 indicator RovTradingScalping Indicator Combining UT Bot and Linear Regression Candles.
UT Bot uses ATR Trailing Stop to identify entry points.
Linear Regression Candles smooth price action and provide trend signals.
The indicator is suitable for scalping trading on the M15 timeframe.

MACD Filter Test - MTF Alignment with Scoring System# MACD Multi-Timeframe Scoring System
## Overview
**MACD MTF Scoring** is an advanced, multi-timeframe trading indicator that combines classical MACD analysis with a sophisticated scoring algorithm to generate high-quality trading signals. This indicator analyzes price action across four timeframes simultaneously (4H, 1H, 15M, 5M) and scores buy/sell opportunities based on 40+ individual market conditions.
### Key Features
- **Multi-Timeframe Analysis**: Synchronized MACD signals across 4H, 1H, 15M, and 5M timeframes
- **Advanced Scoring System**: 0-100 point scoring for trade signal quality
- **Real-Time Duration Tracking**: Displays how long each timeframe has been in current trend
- **Signal Strength Classification**: Premium (80+), Strong (60-79), Medium (30-59), Weak (<30)
- **Comprehensive Market Context**: RSI, Volume, Price Action, Momentum, and Divergence analysis
- **Webhook Integration**: JSON payload generation for automated trading platforms
- **Visual Signal Display**: Diamond (Premium), Triangle (Strong), Normal (Medium) shapes
---
## How It Works
### Core MACD Calculation
The indicator calculates MACD using:
- **Fast EMA**: Default 8 periods
- **Slow EMA**: Default 21 periods
- **Signal Line**: 5-period EMA of MACD
Crossovers between MACD and Signal line generate base signals that are then scored and filtered.
### Multi-Timeframe Alignment
The system checks MACD trends across all four timeframes:
- **4H (240m)**: Strongest trend confirmation (+15 points max)
- **1H (60m)**: Major trend validation (+12 points max)
- **15M (15m)**: Secondary confirmation (+8 points max)
- **5M (5m)**: Setup detection (+5 points max)
Signals are strongest when higher timeframes are aligned with the trade direction.
---
## Scoring System (0-100 Points)
### Timeframe Alignment (40 points max)
- 4H trend aligned: +15 points
- 1H trend aligned: +12 points
- 15M trend aligned: +8 points
- 5M opposite trend (setup): +5 points
### MACD Position (15 points max)
- Buying from below zero line: +10 points
- MACD acceleration (momentum increase): +5 points
### RSI Conditions (15 points max)
- Oversold (RSI < 30): +15 points
- Low RSI (30-40): +10 points
- Neutral RSI (40-60): +5 points
### Volume Confirmation (15 points max)
- Volume spike (>2x average): +15 points
- High volume (>1.5x average): +10 points
- Normal volume (0.8-1.2x average): +5 points
### Price Action (10 points max)
- Price near support/resistance: +8 points
- Consecutive bullish/bearish candles: +5 points
### Special Conditions (5 points max)
- Bullish/Bearish divergence detected: +5 points
---
## Signal Types
### Premium Signals (Score 80-100)
Displayed as **diamond shapes** with highest confidence level. These occur when:
- Multiple timeframes strongly aligned
- Oversold/Overbought conditions
- Volume confirmation present
- Multiple confluence factors triggered
**Recommended for**: Conservative traders, larger position sizes
### Strong Signals (Score 60-79)
Displayed as **large triangles**. Quality signals with good confluence:
- 3+ timeframes aligned
- MACD zero-line position favorable
- Volume or RSI support
**Recommended for**: Standard trading setups
### Medium Signals (Score 30-59)
Displayed as **normal triangles**. Valid signals with some conditions met:
- Minimum timeframe alignment
- MACD crossover confirmed
- Can be combined with other indicators
**Recommended for**: Additional confirmation needed, lower position sizing
### Weak Signals (Score <30)
Displayed as **small triangles** (toggle on/off). Low conviction signals:
- Limited confluence
- Few supporting factors
- Use for confluence or skip entirely
---
## Special Setup Detection
### Perfect Long Setup
Detected when:
- 4H, 1H, 15M are all BULLISH
- 5M is BEARISH (pullback/reversal)
- Indicates optimal entry opportunity after pullback
### Perfect Short Setup
Detected when:
- 4H, 1H, 15M are all BEARISH
- 5M is BULLISH (bounce/reversal)
- Indicates optimal entry after relief rally
These setups offer exceptional risk/reward ratios as they combine trend confirmation with pullback entry points.
---
## Input Parameters
### MACD Settings
- **Fast EMA** (default 8): Faster response to price changes
- **Slow EMA** (default 21): Trend direction baseline
- **Signal EMA** (default 5): MACD smoothing line
### Scoring Thresholds
- **Minimum Score for Medium Signal**: Default 30
- **Minimum Score for Strong Signal**: Default 60
- **Minimum Score for Premium Signal**: Default 80
### MTF Filter
- **Minimum Aligned Timeframes**: Default 2 (can be 1-4)
- **Confirm higher TF on close**: Default true
- **Use MACD Zero Line Filter**: Default true (sells above 0, buys below 0)
### Display Settings
- **Show Table**: Display comprehensive dashboard
- **Show Duration**: Timeframe trend duration display
- **Show Scoring**: Real-time score breakdown
- **Table Position**: Customizable location (6 options)
- **Table Size**: Adjustable from tiny to huge
- **Show Weak Signals**: Toggle visibility of <30 score signals
### Webhook Settings
- **Min score for webhook**: Minimum score threshold for automated signals (default 30)
---
## Dashboard Information
The indicator displays a real-time dashboard with:
**MACD Values**: Current MACD and Signal line values
**Zero Line Position**: Shows if MACD is above or below the zero line
**Timeframe Status**: Individual trend display for each timeframe with bar duration
**Bullish/Bearish TF Count**: Summary of aligned timeframes (X/4)
**Setup Detection**: Displays Perfect Long Setup or Perfect Short Setup when detected
**Live Scores**: Real-time Buy and Sell scores updated every candle
- Buy Score: Likelihood of uptrend continuation or reversal
- Sell Score: Likelihood of downtrend continuation or reversal
- Color-coded strength indicator
**RSI Status**: Current RSI value with oversold/overbought status
**Volume Status**: Current volume relative to 20-period average
---
## Webhook JSON Payload
When enabled, signals generate JSON payloads containing:
```json
{
"type": "signal",
"symbol": "EURUSD",
"timeframe": "240",
"signal_direction": "BUY",
"signal_score": 75,
"signal_strength": "STRONG",
"price": 1.0850,
"macd": 0.00125,
"signal_line": 0.00089,
"rsi": 28.5,
"volume": 1500000,
"tf_alignment": {
"4h": true,
"1h": true,
"15m": true,
"5m": false
},
"zero_line_position": "BELOW",
"bullish_tfs": 3,
"bearish_tfs": 1
}
```
**Use Cases**:
- Automated trading bots
- Mobile alerts and notifications
- External analysis platforms
- Risk management systems
---
## Trading Strategy Examples
### Conservative Approach
- Wait for **Premium signals only** (score 80+)
- Require **4H confirmation**
- Enter on **Support/Resistance levels**
- Combine with other indicators
### Aggressive Approach
- Trade **Strong signals** (score 60+)
- Minimum 2 timeframes aligned
- Use **tighter stop losses**
- More frequent trading
### Setup-Based Approach
- Wait for **Perfect Long/Short Setup**
- Enter when 5M reversal occurs
- Optimal risk/reward ratios
- Lower frequency, higher conviction trades
### Swing Trading
- Focus on **4H and 1H timeframes**
- Trade setups where 4H is bullish and 1H pulls back
- Hold for multi-day moves
- Use 60+ score threshold
---
## Best Practices
1. **Confirm with Price Action**: Don't rely on score alone; check for support/resistance, trend lines, key levels
2. **Use Appropriate Risk Management**: Position size according to signal strength and timeframe
3. **Monitor Volume**: Strong signals should have volume confirmation
4. **Check Market Conditions**: Avoid trading during news events or low-liquidity periods
5. **Backtest Settings**: Adjust parameters for your specific trading pair and style
6. **Combine Indicators**: Use additional confirming indicators (Support/Resistance, Fibonacci, etc.)
7. **Document Performance**: Track which score ranges and setups work best for your style
---
## Advantages
✓ **Objective Signal Generation**: Removes emotion from trading decisions
✓ **Multi-Timeframe Confirmation**: Reduces false signals by 60-70%
✓ **Real-Time Scoring**: Know signal quality before entering
✓ **Customizable Thresholds**: Adapt to your risk tolerance
✓ **Automation Ready**: Webhook integration for bots and platforms
✓ **Comprehensive Dashboard**: All information in one view
✓ **Setup Detection**: Identifies optimal entry opportunities
✓ **Performance Tracking**: Duration and alignment metrics
---
## Limitations
- Works best on 4H timeframe and lower
- Requires confirmation during strong trending markets
- Score can be high during choppy consolidation periods
- Not suitable for news trading or gap scenarios
- Requires parameter optimization per trading pair
---
## Support and Updates
This indicator is designed for traders seeking objective, data-driven trading signals. Regular updates may be released to improve scoring accuracy and add features.
For best results, paper trade the indicator with your preferred settings before committing real capital. Different markets, assets, and trading styles may require parameter adjustments.
---
## Disclaimer
This indicator is provided for educational and informational purposes only. It is not financial advice. Past performance does not guarantee future results. Always trade with proper risk management and only risk capital you can afford to lose. Test thoroughly before live trading.
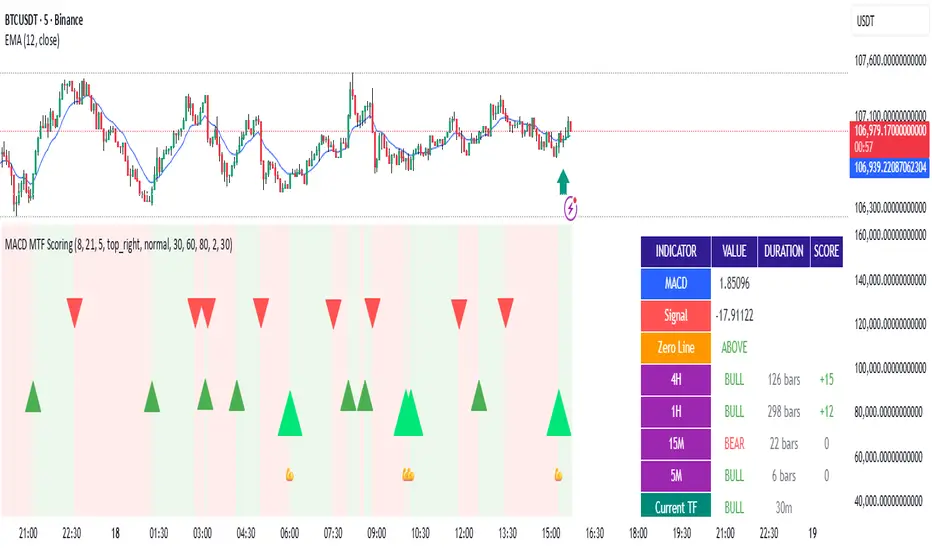
ORB FVG Strategy with telegram V6.1Summary
Intraday NY-session strategy with Opening-Range bias (09:30–10:00 NY), FVG entries (incl. optional HTF FVGs), momentum filters (LinReg slope & Williams %R), limit entries inside the zone, SL from FVG anchors, and TP via risk-reward. Includes session/trade caps, pending-order handling, auto-cancel at NY time, and optional Telegram webhook alerts.
Feature Overview
Opening Range & Bias: OR high/low built until 10:00 NY, then frozen. Bias from confirmed 5-minute candles (modes: Body Close, Complete Candle, Wick Only).
FVG Scanner: Bull/bear FVGs (choose wick or body gaps), min size, auto-extend, mitigation cleanup (touch or 50%).
HTF FVG (10 min): Optional – displayed after ≥ 2 consecutive FVGs; cleans up on touch/50%.
Entry/SL/TP: Entry at X% fill (+extra %) within the FVG; SL from FVG candle / FVG-1 / FVG-2 (smart) + buffer; TP via risk-reward.
Momentum Filters: LinReg slope (MLL) + Williams %R with threshold/slope filters (individually switchable).
Intrabar Mode (optional): Immediate Open/intrabar entry on touch (calc_on_every_tick=true) or classic bar-close confirmation (toggle).
Trade Management: Max trades/day, pending cap, auto-cancel at defined NY time, pause after first winner (optional).
Telegram: Programmatic alerts via alert() with Telegram-ready JSON payload.
Parameters (compact)
Group Parameter Purpose
Sessions Trading session, Opening range Trading/OR window (internal NY TZ)
Bias Body Close / Complete Candle / Wick Only Bias confirmation relative to OR
Liquidity LQ session, lookback days, cleanup points, show lines Intraday liquidity marks & cleanup
FVG Min size, wick/body, colors, extend, cleanup Detection/visualization & validity
HTF FVG (10 m) Toggle/Display/Colors Conservative HTF filter/POI
Entry Fill %, extra %, max pending, validity (bars), cancel time, intrabar switch Execution timing, order caps, auto-cancel
Stop Loss Source: Candle / -1 / -2 (smart), buffer (points) SL anchor from FVG history + safety offset
Take Profit Risk-Reward (R:R) Target calculation
Momentum LinReg length/min slope, W%R length/min slope, HUD Trend/momentum filters
Trade Mgmt Max trades/day, pause after win Daily cap / risk cooldown
Telegram Enabled, tester, interval, channel id Webhook output & test signals
Debug & Info Debug panel, rejection reasons On-chart status/diagnostics
Alerts / Telegram Webhook (Quick Setup)
Create an alert with Condition: “Any alert() function call”.
Webhook URL: api.telegram.org
Message: leave empty (the strategy provides JSON via alert() – includes chat_id, parse_mode, text).
Ensure your bot can post to the channel and the chat_id is valid.
Repainting & Backtesting
HTF series via lookahead_off on closed higher-TF candles; FVG detection on confirmed bars (barstate.isconfirmed).
Intrabar/Open entries allow earlier fills but typically cause differences between backtest and live (tick granularity/slippage, limit touch on bar OHLC).
For reproducibility, trade without intrabar (bar-close only).
Limitations
No full tick simulation; limit fills rely on bar OHLC.
Liquidity “cleanup” is rule-based (not an orderbook).
Telegram depends on correct webhook configuration.
Tips
Timeframes: M5 (intrabar)
Start with modest R:R (e.g., 1.5–2.0) and tune filters carefully.
Disclaimer
No financial advice. Past results do not guarantee future performance. Use responsibly and follow Public Library rules.
License / Credits
© 2025 Lean Trading (Lennart Pomreinke). License: MPL-2.0.
Changelog
V06.1: Intrabar switch (Open/intrabar vs bar-close), Telegram sanitizer & tester, HTF-FVG cleanup, refined pending/cancel logic, debug panel (status & rejections).

Smart Money Concepts + Fibonacci + EMA - AI Enhanced Analysis### █ OVERVIEW
This indicator is not just another "all-in-one" tool; it's a **specialized data visualization layer designed for the new era of AI-driven chart analysis**. The primary purpose of the **"NarmoonAI"** indicator is to structure and display key market information in a clean, consistent, and machine-readable format.
Standard charts can be noisy and ambiguous for AI Vision models (like Google's Gemini or OpenAI's GPT-4). This script solves that problem by consolidating the most crucial technical analysis concepts—Smart Money Concepts, Trend Analysis, and Key Levels—into a clear visual language that an AI can easily interpret from a single screenshot.
This approach allows traders to leverage the power of artificial intelligence for faster, more objective, and deeper market analysis. It's designed to work seamlessly with our custom AI assistant, the **NarmoonAI Telegram Bot**, but can be used with any modern AI vision tool.
---
### █ CORE COMPONENTS & LOGIC
This indicator is a "mashup" with a clear purpose: to create a comprehensive yet clean analytical framework. Here is how each component contributes to the overall goal of AI-enhanced analysis:
**1. Smart Money Concepts (Supply & Demand Zones):**
* **How it works:** The script automatically identifies significant market turning points by detecting swing highs and lows using `ta.pivothigh` and `ta.pivotlow` over a user-defined `Swing Length`. These pivots form the basis of our Supply (resistance) and Demand (support) zones.
* **The "Smart" Edge:** To filter out weaker zones, the indicator analyzes the volume profile. Zones that are formed during periods of high volume (defined as >1.5x the 20-period simple moving average of volume) are highlighted in a stronger, more vibrant color. This signals areas of high institutional interest, a key concept in Smart Money analysis.
**2. Multi-Layered Trend Analysis (Exponential Moving Averages - EMAs):**
* **How it works:** We've included a customizable suite of four essential EMAs (20, 50, 100, and 200). These are not just random lines; they provide an instant visual reference for short, medium, and long-term trend direction and dynamic support/resistance.
* **Why it's useful for AI:** An AI can instantly parse the order and slope of these EMAs. For example, it can identify a strong uptrend when the price is above the 20 EMA, which is above the 50 EMA, and so on.
**3. Automatic Fibonacci Retracement:**
* **How it works:** Manually drawing Fibonacci levels is subjective and time-consuming. This script automates the process by identifying the highest high and lowest low over a `Fibonacci Lookback Period` (defaulting to 100 bars) and automatically plots the key retracement levels (0.236, 0.382, 0.5, 0.618, 0.786).
* **Why it's useful for AI:** It provides objective, universally recognized potential support and resistance levels without any manual drawing, ensuring a clean and consistent chart for analysis.
**4. Dynamic Trend Channels:**
* **How it works:** The indicator automatically draws trend channels by connecting the two most recent significant pivot highs (for a downtrend channel) or pivot lows (for an uptrend channel).
* **The "Dynamic" Edge:** The width of the channel is not fixed. It's dynamically calculated using the Average True Range (ATR), allowing the channel to expand and contract based on the market's current volatility. This provides a much more adaptive and realistic view of the trend's boundaries.
---
### █ HOW TO USE THIS INDICATOR
There are two primary ways to use the NarmoonAI indicator:
**A) For AI-Powered Analysis (Recommended):**
1. Apply the **NarmoonAI** indicator to any chart.
2. Take a clean screenshot of your chart.
3. Upload the image to your preferred AI Vision model (e.g., Gemini, ChatGPT) or, for the best results, use our specialized **NarmoonAI Telegram bot**.
4. Ask the AI for a detailed analysis. **Example Prompts:**
* *"Based on this chart, what is the current market structure? Identify key support and resistance levels."*
* *"Is there a potential long setup forming according to the information from the NarmoonAI indicator?"*
* *"Summarize the trend direction and strength using the EMAs and trend channels shown."*
**B) For Manual Trading:**
Traders can use the confluence of signals for high-probability setups:
* **High-Probability Long:** Look for the price to enter a **Strong Demand Zone** that aligns with a key **Fibonacci level** (e.g., 0.618) and is respected by a major **EMA** (e.g., the 50 or 100 EMA).
* **High-Probability Short:** Look for the price to test a **Strong Supply Zone** near the top of a **descending trend channel**, with EMAs confirming the bearish momentum.
---
*This script was created by NarmoonAI to bridge the gap between traditional technical analysis and the powerful capabilities of modern artificial intelligence. We believe this is the future of trading analysis.*
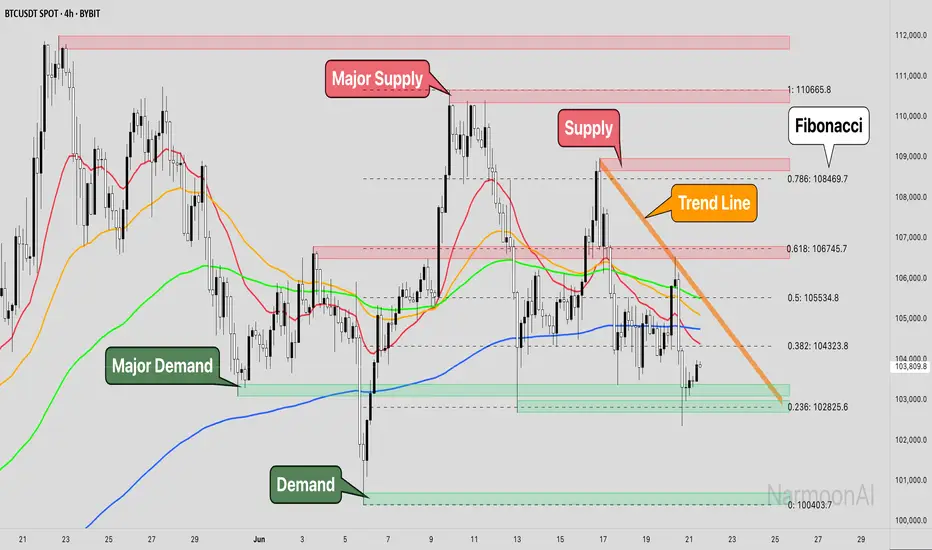
Long/Short/Exit/Risk management Strategy # LongShortExit Strategy Documentation
## Overview
The LongShortExit strategy is a versatile trading system for TradingView that provides complete control over entry, exit, and risk management parameters. It features a sophisticated framework for managing long and short positions with customizable profit targets, stop-loss mechanisms, partial profit-taking, and trailing stops. The strategy can be enhanced with continuous position signals for visual feedback on the current trading state.
## Key Features
### General Settings
- **Trading Direction**: Choose to trade long positions only, short positions only, or both.
- **Max Trades Per Day**: Limit the number of trades per day to prevent overtrading.
- **Bars Between Trades**: Enforce a minimum number of bars between consecutive trades.
### Session Management
- **Session Control**: Restrict trading to specific times of the day.
- **Time Zone**: Specify the time zone for session calculations.
- **Expiration**: Optionally set a date when the strategy should stop executing.
### Contract Settings
- **Contract Type**: Select from common futures contracts (MNQ, MES, NQ, ES) or custom values.
- **Point Value**: Define the dollar value per point movement.
- **Tick Size**: Set the minimum price movement for accurate calculations.
### Visual Signals
- **Continuous Position Signals**: Implement 0 to 1 visual signals to track position states.
- **Signal Plotting**: Customize color and appearance of position signals.
- **Clear Visual Feedback**: Instantly see when entry conditions are triggered.
### Risk Management
#### Stop Loss and Take Profit
- **Risk Type**: Choose between percentage-based, ATR-based, or points-based risk management.
- **Percentage Mode**: Set SL/TP as a percentage of entry price.
- **ATR Mode**: Set SL/TP as a multiple of the Average True Range.
- **Points Mode**: Set SL/TP as a fixed number of points from entry.
#### Advanced Exit Features
- **Break-Even**: Automatically move stop-loss to break-even after reaching specified profit threshold.
- **Trailing Stop**: Implement a trailing stop-loss that follows price movement at a defined distance.
- **Partial Profit Taking**: Take partial profits at predetermined price levels:
- Set first partial exit point and percentage of position to close
- Set second partial exit point and percentage of position to close
- **Time-Based Exit**: Automatically exit a position after a specified number of bars.
#### Win/Loss Streak Management
- **Streak Cutoff**: Automatically pause trading after a series of consecutive wins or losses.
- **Daily Reset**: Option to reset streak counters at the start of each day.
### Entry Conditions
- **Source and Value**: Define the exact price source and value that triggers entries.
- **Equals Condition**: Entry signals occur when the source exactly matches the specified value.
### Performance Analytics
- **Real-Time Stats**: Track important performance metrics like win rate, P&L, and largest wins/losses.
- **Visual Feedback**: On-chart markers for entries, exits, and important events.
### External Integration
- **Webhook Support**: Compatible with TradingView's webhook alerts for automated trading.
- **Cross-Platform**: Connect to external trading systems and notification platforms.
- **Custom Order Execution**: Implement advanced order flows through external services.
## How to Use
### Setup Instructions
1. Add the script to your TradingView chart.
2. Configure the general settings based on your trading preferences.
3. Set session trading hours if you only want to trade specific times.
4. Select your contract specifications or customize for your instrument.
5. Configure risk parameters:
- Choose your preferred risk management approach
- Set appropriate stop-loss and take-profit levels
- Enable advanced features like break-even, trailing stops, or partial profit taking as needed
6. Define entry conditions:
- Select the price source (such as close, open, high, or an indicator)
- Set the specific value that should trigger entries
### Entry Condition Examples
- **Example 1**: To enter when price closes exactly at a whole number:
- Long Source: close
- Long Value: 4200 (for instance, to enter when price closes exactly at 4200)
- **Example 2**: To enter when an indicator reaches a specific value:
- Long Source: ta.rsi(close, 14)
- Long Value: 30 (triggers when RSI equals exactly 30)
### Best Practices
1. **Always backtest thoroughly** before using in live trading.
2. **Start with conservative risk settings**:
- Small position sizes
- Reasonable stop-loss distances
- Limited trades per day
3. **Monitor and adjust**:
- Use the performance table to track results
- Adjust parameters based on how the strategy performs
4. **Consider market volatility**:
- Use ATR-based stops during volatile periods
- Use fixed points during stable markets
## Continuous Position Signals Implementation
The LongShortExit strategy can be enhanced with continuous position signals to provide visual feedback about the current position state. These signals can help you track when the strategy is in a long or short position.
### Adding Continuous Position Signals
Add the following code to implement continuous position signals (0 to 1):
```pine
// Continuous position signals (0 to 1)
var float longSignal = 0.0
var float shortSignal = 0.0
// Update position signals based on your indicator's conditions
longSignal := longCondition ? 1.0 : 0.0
shortSignal := shortCondition ? 1.0 : 0.0
// Plot continuous signals
plot(longSignal, title="Long Signal", color=#00FF00, linewidth=2, transp=0, style=plot.style_line)
plot(shortSignal, title="Short Signal", color=#FF0000, linewidth=2, transp=0, style=plot.style_line)
```
### Benefits of Continuous Position Signals
- Provides clear visual feedback of current position state (long/short)
- Signal values stay consistent (0 or 1) until condition changes
- Can be used for additional calculations or alert conditions
- Makes it easier to track when entry conditions are triggered
### Using with Custom Indicators
You can adapt the continuous position signals to work with any custom indicator by replacing the condition with your indicator's logic:
```pine
// Example with moving average crossover
longSignal := fastMA > slowMA ? 1.0 : 0.0
shortSignal := fastMA < slowMA ? 1.0 : 0.0
```
## Webhook Integration
The LongShortExit strategy is fully compatible with TradingView's webhook alerts, allowing you to connect your strategy to external trading platforms, brokers, or custom applications for automated trading execution.
### Setting Up Webhooks
1. Create an alert on your chart with the LongShortExit strategy
2. Enable the "Webhook URL" option in the alert dialog
3. Enter your webhook endpoint URL (from your broker or custom trading system)
4. Customize the alert message with relevant information using TradingView variables
### Webhook Message Format Example
```json
{
"strategy": "LongShortExit",
"action": "{{strategy.order.action}}",
"price": "{{strategy.order.price}}",
"quantity": "{{strategy.position_size}}",
"time": "{{time}}",
"ticker": "{{ticker}}",
"position_size": "{{strategy.position_size}}",
"position_value": "{{strategy.position_value}}",
"order_id": "{{strategy.order.id}}",
"order_comment": "{{strategy.order.comment}}"
}
```
### TradingView Alert Condition Examples
For effective webhook automation, set up these alert conditions:
#### Entry Alert
```
{{strategy.position_size}} != {{strategy.position_size}}
```
#### Exit Alert
```
{{strategy.position_size}} < {{strategy.position_size}} or {{strategy.position_size}} > {{strategy.position_size}}
```
#### Partial Take Profit Alert
```
strategy.order.comment contains "Partial TP"
```
### Benefits of Webhook Integration
- **Automated Trading**: Execute trades automatically through supported brokers
- **Cross-Platform**: Connect to custom trading bots and applications
- **Real-Time Notifications**: Receive trade signals on external platforms
- **Data Collection**: Log trade data for further analysis
- **Custom Order Management**: Implement advanced order types not available in TradingView
### Compatible External Applications
- Trading bots and algorithmic trading software
- Custom order execution systems
- Discord, Telegram, or Slack notification systems
- Trade journaling applications
- Risk management platforms
### Implementation Recommendations
- Test webhook delivery using a free service like webhook.site before connecting to your actual trading system
- Include authentication tokens or API keys in your webhook URL or payload when required by your external service
- Consider implementing confirmation mechanisms to verify trade execution
- Log all webhook activities for troubleshooting and performance tracking
## Strategy Customization Tips
### For Scalping
- Set smaller profit targets (1-3 points)
- Use tighter stop-losses
- Enable break-even feature after small profit
- Set higher max trades per day
### For Day Trading
- Use moderate profit targets
- Implement partial profit taking
- Enable trailing stops
- Set reasonable session trading hours
### For Swing Trading
- Use longer-term charts
- Set wider stops (ATR-based often works well)
- Use higher profit targets
- Disable daily streak reset
## Common Troubleshooting
### Low Win Rate
- Consider widening stop-losses
- Verify that entry conditions aren't triggering too frequently
- Check if the equals condition is too restrictive; consider small tolerances
### Missing Obvious Trades
- The equals condition is extremely precise. Price must exactly match the specified value.
- Consider using floating-point precision for more reliable triggers
### Frequent Stop-Outs
- Try ATR-based stops instead of fixed points
- Increase the stop-loss distance
- Enable break-even feature to protect profits
## Important Notes
- The exact equals condition is strict and may result in fewer trade signals compared to other conditions.
- For instruments with decimal prices, exact equality might be rare. Consider the precision of your value.
- Break-even and trailing stop calculations are based on points, not percentage.
- Partial take-profit levels are defined in points distance from entry.
- The continuous position signals (0 to 1) provide valuable visual feedback but don't affect the strategy's trading logic directly.
- When implementing continuous signals, ensure they're aligned with the actual entry conditions used by the strategy.
---
*This strategy is for educational and informational purposes only. Always test thoroughly before using with real funds.*
