Multi-indicator Signal Builder [Skyrexio]Overview
Multi-Indicator Signal Builder is a versatile, all-in-one script designed to streamline your trading workflow by combining multiple popular technical indicators under a single roof.
It features a single-entry, single-exit logic, intrabar stop-loss/take-profit handling, an optional time filter, a visually accessible condition table, and a built-in statistics label.
Traders can choose any combination of 12+ indicators (RSI, Ultimate Oscillator, Bollinger %B, Moving Averages, ADX, Stochastic, MACD, PSAR, MFI, CCI, Heikin Ashi, and a “TV Screener” placeholder) to form entry or exit conditions.
This script aims to simplify strategy creation and analysis , making it a powerful toolkit for technical traders.
Indicators Overview
RSI (Relative Strength Index)
Measures recent price changes to evaluate overbought or oversold conditions on a 0–100 scale.
Ultimate Oscillator (UO)
Uses weighted averages of three different timeframes, aiming to confirm price momentum while avoiding false divergences.
Bollinger %B
Expresses price relative to Bollinger Bands, indicating whether price is near the upper band (overbought) or lower band (oversold).
Moving Average (MA)
Smooths price data over a specified period. The script supports both SMA and EMA to help identify trend direction and potential crossovers.
ADX (Average Directional Index)
Gauges the strength of a trend (0–100). Higher ADX signals stronger momentum, while lower ADX indicates a weaker trend.
Stochastic
Compares a closing price to a price range over a given period to identify momentum shifts and potential reversals.
MACD (Moving Average Convergence/Divergence)
Tracks the difference between two EMAs plus a signal line, commonly used to spot momentum flips through crossovers.
PSAR (Parabolic SAR)
Plots a trailing stop-and-reverse dot that moves with the trend. Often used to signal potential reversals when price crosses PSAR.
MFI (Money Flow Index)
Similar to RSI but incorporates volume data. A reading above 80 can suggest overbought conditions, while below 20 may indicate oversold.
CCI (Commodity Channel Index)
Identifies cyclical trends or overbought/oversold levels by comparing current price to an average price over a set timeframe.
Heikin Ashi
A type of candlestick charting that filters out market noise. The script uses a streak-based approach (multiple consecutive bullish or bearish bars) to gauge mini-trends.
TV Screener
A placeholder condition designed to integrate external buy/sell logic (like a TradingView “Buy” or “Sell” rating). Users can override or reference external signals if desired.
Unique Features
Multi-Indicator Entry and Exit
You can selectively enable any subset of 12+ classic indicators, each with customizable parameters and conditions. A position opens only if all enabled entry conditions are met, and it closes only when all enabled exit conditions are satisfied, helping reduce false triggers.
Single-Entry / Single-Exit with Intrabar SL/TP
The script supports a single position at a time. Once a position is open, it monitors intrabar to see if the price hits your stop-loss or take-profit levels before the bar closes, making results more realistic for fast-moving markets.
Time Window Filter
Users may specify a start/end date range during which trades are allowed, making it convenient to focus on specific market cycles for backtesting or live trading.
Condition Table and Statistics
A table at the bottom of the chart lists all active entry/exit indicators. Upon each closed trade, an integrated statistics label displays net profit, total trades, win/loss count, average and median PnL, etc.
Seamless Alerts and Automation
• Configure alerts in TradingView using “Any alert() function call.”
• The script sends JSON alert messages you can route to your own webhook.
• The indicator can be integrated with Skyrexio alert bots to automate execution on major cryptocurrency exchanges.
Optional MA/PSAR Plots
For added visual clarity, optionally plot the chosen moving averages or PSAR on the chart to confirm signals without stacking multiple indicators.
Methodology
Multi-Indicator Entry Logic
When multiple entry indicators are enabled (e.g., RSI + Stochastic + MACD), the script requires all signals to align before generating an entry. Each indicator can be set for crossovers, crossunders, thresholds (above/below), etc. This “AND” logic aims to filter out low-confidence triggers.
Single-Entry Intrabar SL/TP
• One Position At a Time: Once an entry signal triggers, a trade opens at the bar’s close.
• Intrabar Checks: Stop-loss and take-profit levels (if enabled) are monitored on every tick. If either is reached, the position closes immediately, without waiting for the bar to end.
Exit Logic
All Conditions Must Agree: If the trade is still open (SL/TP not triggered), then all enabled exit indicators must confirm a closure before the script exits on the bar’s close.
Time Filter
Optional Trading Window: You can activate a date/time range to constrain entries and exits strictly to that interval.
Justification of Methodology
Indicator Confluence: Combining multiple tools (RSI, MACD, etc.) can reduce noise and false signals.
Intrabar SL/TP: Capturing real-time spikes or dips provides a more precise reflection of typical live trading scenarios.
Single-Entry Model: Straightforward for both manual and automated tracking (especially important in bridging to bots).
Custom Date Range: Helps refine backtesting for specific market conditions or to avoid known irregular data periods.
How to Use
Add the Script to Your Chart
• In TradingView, open Indicators , search for “Multi-indicator Signal Builder” .
• Click to add it to your chart.
Configure Inputs
• Time Filter: Set a start and end date for trades.
• Alerts Messages: Input any JSON or text payload needed by your external service or bot.
• Entry Conditions: Enable and configure any indicators (e.g., RSI, MACD) for a confluence-based entry.
• Close Conditions: Enable exit indicators, along with optional SL (negative %) and TP (positive %) levels.
Set Up Alerts
• In TradingView, select “Create Alert” → Condition = “Any alert() function call” → choose this script.
• Entry Alert: Triggers on the script’s entry signal.
• Close Alert: Triggers on the script’s close signal (or if SL/TP is hit).
• Skyrexio Alert Bots: You can route these alerts via webhook to Skyrexio alert bots to automate order execution on major crypto exchanges (or any other supported broker).
Visual Reference
• A condition table at the bottom summarizes active signals.
• Statistics Label updates automatically as trades are closed, showing PnL stats and distribution metrics.
Backtesting Guidelines
Symbol/Timeframe: Works on multiple assets and timeframes; always do thorough testing.
Realistic Costs: Adjust commissions and potential slippage to match typical exchange conditions.
Risk Management: If using the built-in stop-loss/take-profit, set percentages that reflect your personal risk tolerance.
Longer Test Horizons: Verify performance across diverse market cycles to gauge reliability.
Example of statistic calculation
Test Period: 2023-01-01 to 2025-12-31
Initial Capital: $1,000
Commission: 0.1%, Slippage ~5 ticks
Trade Count: 680 (varies by strategy conditions)
Win rate: 75.44% (varies by strategy conditions)
Net Profit: +90.14% (varies by strategy conditions)
Disclaimer
This indicator is provided strictly for informational and educational purposes.
It does not constitute financial or trading advice.
Past performance never guarantees future results.
Always test thoroughly in demo environments before using real capital.
Enjoy exploring the Multi-Indicator Signal Builder! Experiment with different indicator combinations and adjust parameters to align with your trading preferences, whether you trade manually or link your alerts to external automation services. Happy trading and stay safe!
"bot" için komut dosyalarını ara

BURAK KRİPTO AL - SAT BOTUBURAK CRYPTO BUY-SELL BOT — Designed for high performance in crypto markets!This strategy is built on a powerful algorithm optimized with years of real trading experience. It follows trends while perfectly catching buy-at-the-bottom and sell-at-the-top opportunities.Main Features:
Trend direction detection with EMA + SMA combination
Overbought/oversold filters using RSI and Stochastic
Volume confirmation (volume breakout filter included)
ATR-based dynamic stop loss and take profit
Sideways market filter — prevents unnecessary trades
Works on all cryptocurrencies (BTCUSDT, ETHUSDT, SOLUSDT, XRPUSDT, etc.)
Both long and short signals (can be turned off separately)
High win rate and excellent profit factor in backtests Who is it for?Daily and swing traders
Spot and futures traders
Those who want to run fully automated bots (easily connected via alerts to 3Commas, Pionex, Bitsgap, etc.)
How to use:Add the script to your chart
Create an alert → “Alert on BURAK CRYPTO BUY-SELL BOT”
In the alert message field, write: For buy: BUY {{ticker}}
For sell: SELL {{ticker}}
Connect to your bot and let it do the rest automatically!
Disclaimer: No strategy guarantees 100% profit. Always apply your own risk management. Past performance is not indicative of future results.If you like it, don’t forget to hit the Like button and leave a comment! ♡
Any questions? Drop them in the comments — I reply as fast as possible!#crypto #bitcoin #tradingbot #tradingview #signals #altsat

3x ORB Alerts (JSON webhook, 3 ORBs)2× ORB Alerts (JSON Webhook, ORB4 + ORB5) is a clean, lightweight multi-session Opening Range Breakout (ORB) alert engine designed for automated trading systems using TradingView webhooks.
This indicator provides up to 3 independent ORB windows, each with:
Custom session time
Custom cutoff time (HHMM or HH:MM)
First-close breakout detection (Up or Down)
Dedicated alert conditions
Persistent ORB range + breakout price
Full JSON webhook output for bots
No boxes, no lines, no visual clutter (performance-optimized)
✔️ What this indicator does
Tracks ORB high/low during the selected session
Locks the range once the session ends
Waits for a valid breakout (close > high or close < low)
Triggers alerts only once per ORB per day
Sends a clean JSON payload to your trading bot
✔️ Webhook JSON includes
Symbol
Timeframe
ORB window number (1–3)
Breakout direction
Break price
ORB range
ATR (optional filtering)
Close price
Timestamp
Custom API key
✔️ Why this script exists
This indicator is built specifically for automated ORB trading bots, where reliability, clean signals, and low-latency alerts are critical.
No repainting, no noise — just clear breakout confirmations for fully automated systems.
✔️ Use Cases
Futures (GC, NQ, ES, CL, FDAX, etc.)
Forex session breakout strategies
Crypto ORB systems (BTC, ETH)
Multi-session automated strategies
Proprietary trading automation
✔️ How to use
Set up 1,2,3 ORB sessions
Add corresponding alert conditions
Select "Once per bar close"
Paste your webhook URL
Your trading bot receives a JSON package on every breakout

2x ORB Alerts (JSON webhook, ORB4 + ORB5)2× ORB Alerts (JSON Webhook, ORB4 + ORB5) is a clean, lightweight multi-session Opening Range Breakout (ORB) alert engine designed for automated trading systems using TradingView webhooks.
This indicator provides 2 independent ORB windows, each with:
Custom session time
Custom cutoff time (HHMM or HH:MM)
First-close breakout detection (Up or Down)
Dedicated alert conditions
Persistent ORB range + breakout price
Full JSON webhook output for bots
No boxes, no lines, no visual clutter (performance-optimized)
✔️ What this indicator does
Tracks ORB high/low during the selected session
Locks the range once the session ends
Waits for a valid breakout (close > high or close < low)
Triggers alerts only once per ORB per day
Sends a clean JSON payload to your trading bot
✔️ Webhook JSON includes
Symbol
Timeframe
ORB window number (4&5)
Breakout direction
Break price
ORB range
ATR (optional filtering)
Close price
Timestamp
Custom API key
✔️ Why this script exists
This indicator is built specifically for automated ORB trading bots, where reliability, clean signals, and low-latency alerts are critical.
No repainting, no noise — just clear breakout confirmations for fully automated systems.
✔️ Use Cases
Futures (GC, NQ, ES, CL, FDAX, etc.)
Forex session breakout strategies
Crypto ORB systems (BTC, ETH)
Multi-session automated strategies
Proprietary trading automation
✔️ How to use
Set up to 4&5 ORB sessions
Add corresponding alert conditions
Select "Once per bar close"
Paste your webhook URL
Your trading bot receives a JSON package on every breakout

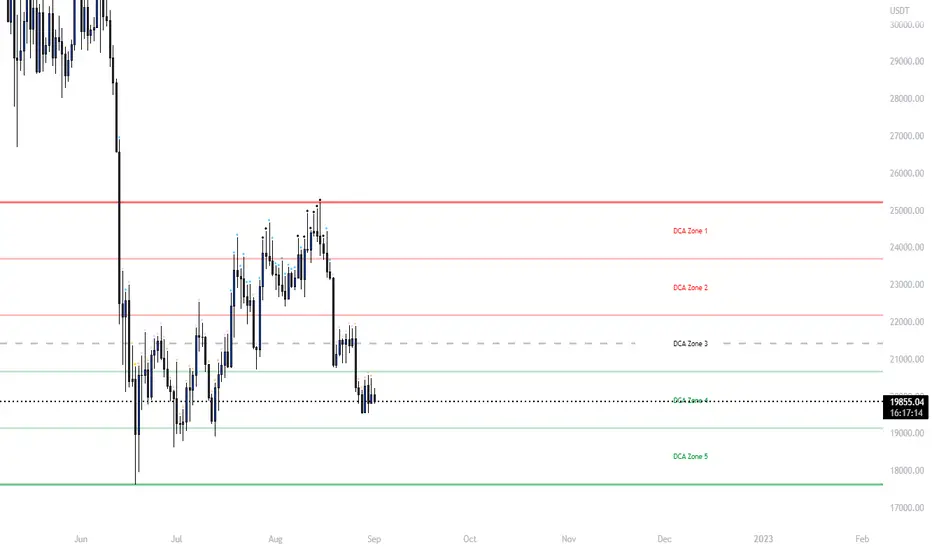
BTC Risk Metric DCA Adapter (3Commas Webhook Strategy)Risk Metric DCA Adapter (3Commas Webhook Strategy) - WORK IN PROGRESS
This Pine Script strategy, originally inspired by the Risk Metric Indicator, is fundamentally engineered as an Adapter to interface with external trading bots like 3Commas via Webhooks. It calculates a dynamic market risk score and translates that score into specific dollar-cost averaging (DCA) entry levels and tiered profit-taking exits.
Key Features & Logic
Risk Metric Calculation (Credit to The Trading Parrot):
The strategy incorporates a complex, multi-timeframe Risk Metric calculation based on daily and weekly moving averages (SMA) and standard deviation (StDev). This metric aims to quantify the current market overextension or compression relative to long-term historical data. The resulting score dictates the level of conviction for a new trade.
Tiered DCA Entry Sizing:
The strategy defines three distinct Buy Levels (L1, L2, L3) corresponding to increasingly favorable (lower) Risk Metric scores.
L1 (Base): Risk is moderate, initiating the minimum defined trade amount.
L2 (Scaled): Risk is low, initiating L1 amount + L2 amount.
L3 (Aggressive): Risk is very low, initiating L1 + L2 + L3 amounts.
Tiered Profit-Taking Exits:
The strategy implements a staggered, partial profit-taking approach based on the Risk Metric rising:
Sell L1 & L2: Closes a percentage of the current position when the Risk Metric reaches defined high thresholds, locking in partial profits.
Sell L3 (Full Exit): Closes the remaining position when the Risk Metric reaches the highest defined threshold.
The Adapter Function (Webhook Integration)
This script is unique because it uses the Pine Script strategy() function to trigger Order Fills, which are necessary to access powerful placeholders in the TradingView alert system.
Trigger Type: The alert must be set to trigger on Any order fill.
Dynamic Webhook Data: Instead of using fixed alert() commands, the strategy generates dynamic labels (e.g., BUY_ENTRY_L3_USD_1000 or SELL_L1_PCT_25) using the strategy.entry and strategy.close commands.
Data Transfer: The alert message then uses the placeholder {{strategy.order.comment}} to pass these dynamic labels to the 3Commas bot, allowing the bot to execute the precise action (e.g., start_deal_with_volume_in_quote_currency or close_deal_at_market_percentage).
Full Strategy Webhook payload
{
"secret": "YOUR_3COMMAS_SECRET_KEY",
"max_lag": "300",
"timestamp": "{{timenow}}",
"trigger_price": "{{close}}",
"tv_exchange": "{{exchange}}",
"tv_instrument": "{{ticker}}",
"action": "{{strategy.order.action}}",
"bot_uuid": "YOUR_BOT_UUID",
"strategy_info": {
"market_position": "{{strategy.market_position}}",
"market_position_size": "{{strategy.market_position_size}}",
"prev_market_position": "{{strategy.prev_market_position}}",
"prev_market_position_size": "{{strategy.prev_market_position_size}}"
},
"order": {
"amount": "{{strategy.order.contracts}}",
"currency_type": "base",
"comment": "{{strategy.order.comment}}"
}
}
Disclaimer: This script is an adapter tool and does not guarantee profit. Trading requires manual configuration of risk settings, bot parameters, and adherence to platform-specific setup instructions.

SWRSI Trends (Source Out)Overview SWRSI Trends is a specialized momentum indicator based on the Relative Strength Index (RSI). While it functions as a visual trading aid with bar coloring and signal shapes, its primary purpose is to serve as a modular signal provider for other strategies and backtesting bots on TradingView.
It detects trend reversals by monitoring RSI crossovers at specific custom levels (Default: 60 and 40), rather than the standard 70/30 extreme zones.
Key Features
1. External Source Outputs (Connect to Bots) This script includes hidden plot outputs specifically designed to interface with other scripts.
RSI LONG SIGNAL (Source): Outputs a value of 1 when a Long condition is met, 0 otherwise.
RSI SHORT SIGNAL (Source): Outputs a value of 1 when a Short condition is met, 0 otherwise.
Usage: You can select these outputs as the "Entry Source" in compatible Strategy scripts or Backtest Bots without needing to copy-paste code.
2. Signal Logic
Long Signal: Triggered when the RSI line crosses OVER the Lower Threshold (Default: 40). This indicates momentum is recovering from the lower zone.
Short Signal: Triggered when the RSI line crosses UNDER the Upper Threshold (Default: 60). This indicates momentum is cooling off from the upper zone.
3. Visual Aids
Bar Coloring: Candles change color based on RSI position (Green above 60, Red below 40).
Dynamic Line: The RSI line changes color to reflect the current zone.
Settings
RSI Length: The lookback period for calculation (Default: 14).
Short Threshold: Level for bearish crossover (Default: 60).
Long Threshold: Level for bullish crossover (Default: 40).
Color Bars: Toggle candle painting on/off.
How to Connect to Another Indicator
Add SWRSI Trends to your chart.
Open the settings of your Target Strategy/Bot (e.g., SwietcherBot).
In the "Source" or "External Signal" input field, select "SWRSI Trends: RSI LONG SIGNAL" or "RSI SHORT SIGNAL" from the dropdown menu.
Kaito Box with RSI Div(Dynamic Adjustment + MA + Long)The script implements a dynamic trading strategy that combines box range detection, RSI divergence signals, and moving average trend analysis. It is designed for use on OKX Signal Bots and includes features for dynamic position scaling and partial position closing. Below is a summary of its key functionalities:
Key Features:
Box Range Detection:
The script identifies price ranges using the highest high and lowest low of a configurable boxLength period.
These levels are plotted on the chart to visualize the price range.
RSI Divergence Detection:
The script calculates RSI using a configurable rsiLength.
Detects bullish divergence when price makes a lower low, but RSI makes a higher low.
Detects bearish divergence when price makes a higher high, but RSI makes a lower high.
Includes separate left and right lookback periods (leftLookback, rightLookback) for precise local extrema detection.
Customizable Moving Averages:
Supports multiple types of Moving Averages (SMA, EMA, SMMA, WMA, VWMA).
Calculates and plots MA20, MA50, MA100, and MA200 on a user-defined timeframe (custom_timeframe).
Identifies uptrends and downtrends based on the alignment of the moving averages and price levels.
Dynamic Position Scaling:
Implements dynamic position sizing for long entries and partial position closing for exits.
The percentage of position size added or closed is based on the difference between the current price and the average position price (avgPrice), with configurable minimum thresholds (minEnterPercent, minExitPercent).
Signal Integration for OKX Bots:
Sends buy/sell signals to OKX Signal Bots using the configured signalToken.
Supports market or limit orders with configurable price offsets and investment types.
Trend-Based Signal Filtering:
Only triggers long signals during downtrends and short signals during uptrends, ensuring trades align with the overall market context.
Visual Annotations:
Plots bullish and bearish divergence signals on the chart.
Displays labels showing dynamic position size adjustments and current average price during trades.
How It Works:
Long Signals:
Triggered when the price breaches the lower box range, and a bullish RSI divergence is detected.
Additional filtering ensures long trades are executed only during downtrend conditions.
Dynamically adjusts the position size based on the price difference from the average entry price.
Short Signals:
Triggered when the price breaches the upper box range, and a bearish RSI divergence is detected.
Additional filtering ensures short trades are executed only during uptrend conditions.
Dynamically closes portions of the position based on price movement relative to the average entry price.
Alerts:
Generates actionable alerts formatted for OKX bots, including order type, signal token, and dynamically calculated position sizes.
Use Case:
This strategy is well-suited for automated trading on platforms like OKX, where it can:
Exploit price ranges and RSI divergences for precise entries and exits.
Dynamically manage position sizes to optimize risk-reward.
Adapt to different market conditions using configurable parameters like moving averages, divergence lookbacks, and trend filters.
This script provides a robust foundation for traders looking to automate their strategies while maintaining flexibility and control over their trading logic.

Breakout Patterns Detector: Triangle & Wedge [Splirus]This indicator identifies Breakout Patterns such as Ascending Triangles , Descending Triangles , Symmetric Triangles , Ascending Wedges , and Descending Wedges , using candlestick charts and Trendlines. It provides visual cues, stop-loss (SL), and take-profit (TP) levels, alongside a detailed dashboard to evaluate performance. The indicator supports two alert modes: Manual Mode for trader notifications and Bot Mode for automated trading signals.
To achieve optimal results, users are encouraged to experiment with indicator parameters and analyze the dashboard summary to find the perfect configuration for each timeframe, pair, and market condition.
Pattern Identification
The indicator detects the following breakout patterns based on pivot highs and lows:
Ascending Triangle : Flat upper trendline, rising lower trendline.
Descending Triangle : Flat lower trendline, declining upper trendline.
Symmetric Triangle : Converging trendlines with similar slopes (within a user-defined threshold).
Ascending Wedge : Both trendlines slope upward, converging.
Descending Wedge : Both trendlines slope downward, converging.
Patterns are identified using configurable left and right bars for small and big patterns, with slope thresholds normalized by ATR. A trend confirmation filter ensures breakouts align with market direction, and users can adjust breakout confirmation bars to validate signals.
The goal is to fine-tune these settings to suit specific timeframes and pairs, as each combination may require a unique setup for optimal performance.
Stop-Loss Calculation
Stop-loss levels are calculated dynamically based on pattern type and breakout direction:
Symmetric Triangle : SL is set at the first pivot of the opposite trendline, adjusted by a buffer percentage.
Ascending/Descending Triangle : SL is placed at the breakout trendline’s price, plus the buffer.
Ascending/Descending Wedge : SL is set at the second pivot of the opposite trendline, adjusted by the buffer.
The indicator calculates leverage based on a user-defined risk tolerance percentage. Users should adjust the SL buffer and risk tolerance to balance risk and reward, monitoring the dashboard to assess how these settings impact performance across different timeframes and pairs.
Take-Profit Calculation
Three take-profit levels ( TP1 , TP2 , TP3 ) are calculated using pattern height and user-defined multipliers:
For Ascending/Descending Triangles, height is the difference between the max and min prices within the pattern.
For Symmetric Triangles and Wedges, height is the vertical distance between trendlines at the pattern’s start.
TP levels are set as:
TP1 = Breakout price ± (Height × TP1 Multiplier).
TP2 = Breakout price ± (Height × TP2 Multiplier).
TP3 = Breakout price ± (Height × TP3 Multiplier, with a 1.5x adjustment for Wedges).
Experiment with TP multipliers to optimize the risk-reward ratio, using the dashboard to evaluate TP hit rates and overall profitability for each configuration.
Symmetric Triangle:
Ascending/Descending Wedge:
Ascending/Descending Triangles:
Finding the Perfect Configuration
The indicator’s dashboard provides a comprehensive summary of performance metrics, including total trades, TP1/TP2/TP3 hits, SL hits, profit/loss percentages, and win rates for bullish, bearish, and combined trades. These metrics are crucial for identifying the ideal parameter settings:
Timeframe and Pair Variability : Each timeframe (e.g., 15m, 30min, 1H, 4H, Daily) and pair (e.g., BTC/USD, EUR/USD) behaves differently. Adjust parameters like left/right bars, minimum pattern length, and breakout confirmation bars to match the volatility and trend characteristics of the chosen pair and timeframe.
Parameter Tuning : Modify slope thresholds, trend confirmation filters, and bars inside the pattern to filter out false breakouts. For example, a higher breakout confirmation bar setting may reduce signals but increase reliability on longer timeframes.
Dashboard Analysis : Focus on the dashboard’s win rate, profit/loss ratio, and TP/SL hit frequencies. A “Perfect” win rate (>66%) or high TP hit rate indicates a strong configuration. If the SL hit rate is high, consider tightening the trend confirmation filter or increasing the SL buffer.
Iterative Testing : Test different combinations of settings (e.g., small vs. big patterns, aggressive vs. conservative breakout confirmation) and compare dashboard results over time. The goal is to find a balance where the indicator consistently delivers high win rates and profitability for your specific trading setup.
Alert Modes
The indicator supports two alert modes to suit different trading styles:
Manual Mode : Generates alerts for breakouts with entry price, SL, TP1/TP2/TP3, and leverage, tailored for Crypto or Forex markets. Use this mode to manually evaluate signals while refining configurations.
Bot Mode : Sends automated trading signals. To avoid conflicts, Bot Mode ensures no short position alert is triggered while a long position is active, and vice versa. This mode is ideal once you’ve identified an optimal configuration via the dashboard.
Additional Features
Historical Patterns : Displays past trendlines with customizable transparency and extension, helping users analyze how patterns performed under different settings.
Customizable Settings : Adjust pattern size, breakout confirmation, trend filters, and visual preferences (colors, dashboard location) to match your trading style.
Market Compatibility : Supports Crypto and Forex markets across all timeframes, but requires careful tuning for each market type.
Usage Notes
Start with default settings and monitor the dashboard to establish a baseline performance for your chosen timeframe and pair.
Gradually adjust one parameter at a time (e.g., left/right bars, TP multipliers) and compare dashboard results to identify improvements.
Use historical pattern analysis to understand how past breakouts performed under different configurations, guiding your optimization process.
Once a high win rate and profitability are achieved, consider automating trades with Bot Mode for consistent execution.
Disclaimer
This indicator is intended for educational purposes only and should not be considered financial advice. Trading involves significant risk, and past performance is not indicative of future results. Users are strongly advised to thoroughly test and validate the indicator’s signals in a demo environment before using it in live trading. The author is not responsible for any financial losses incurred while using this indicator. Always conduct your own research and consult with a qualified financial advisor before making trading decisions.

All-in-One BB Stoch RSI + PSAR + Keltner + ADX + Trailing StopThis invite-only indicator combines multiple advanced tools into a single script, generating buy/short signals alongside comprehensive alerts. Priced at just $25/month, it’s ideal for both manual trading and integration with bots.
Key Features & Alerts
Buy & Short Signals
Quickly identify potential long or short entries.
Three Take-Profit (TP) Lines
Long: After a BUY signal, three lines appear (TP1, TP2, TP3), allowing you to take partial profits—e.g., 30%, 30%, 30%—and keep the remaining 10% to trail.
Short: Similarly, after a SHORT signal, three TP lines help you scale out as price moves in your favor.
Stop-Loss Line (Based on Bollinger Width)
Precisely calculates a stop-loss distance using Bollinger Band width (a percentage below for longs or above for shorts).
Trailing Stop-Loss
Any remaining position can be trailed under (or above) Parabolic SAR, Keltner Channels, and Bollinger, with an extra 0.2% margin for added caution.
ADX + Stoch RSI + RSI (MA)
Filter out weak trends, gauge volatility, and confirm overbought/oversold regions in real time.
Compatible With Trading Bots
Built-in alerts can be connected to bot logic (via webhooks), enabling automated management of entries, TPs, stop-losses, and trailing stops.
Why Use This Indicator?
All-in-One Script: Eliminates chart clutter by merging multiple indicators into one.
Partial Take-Profits: Clearly defined TP1, TP2, TP3 lines help you lock in gains progressively.
Enhanced Risk Control: Stop-loss and trailing stop lines update automatically, keeping your trades protected.
Easy Bot Integration: Perfect for traders wanting direct alerts or automated trading setups.
Invite-Only for Exclusive Access: Maintain a competitive edge with protected source code.
How to Use:
Add to Chart
After access is granted, go to Indicators → Invite-Only Scripts and select this script.
Enable Specialized Alerts
Receive notifications for Buy/Short signals, the three TP lines, Stop-Loss, and Trailing Stop events.
Scale Out or Automate
Manually close partial positions at the TP lines (e.g., 30% each time) and let the remaining 10% trail for bigger moves.
Or link these alerts to a trading bot for fully automated position management.
Price: $25/month
Interested? Contact me (via direct message or email) for more details and to subscribe. Experience clearer charts, timely signals, and robust risk management in one invite-only package!
Pineconnector Strategy Template (Connect Any Indicator)Hello traders,
If you're tired of manual trading and looking for a solid strategy template to pair with your indicators, look no further.
This Pine Script v5 strategy template is engineered for maximum customization and risk management.
Best part?
It’s optimized for Pineconnector, allowing seamless integration with MetaTrader 4 and 5.
This powerful tool gives a lot of power to those who don't know how to code in Pinescript and are looking to automate their indicators' signals on Metatrader 4/5.
IMPORTANT NOTES
Pineconnector is a trading bot software that forwards TradingView alerts to your Metatrader 4/5 for automating trading.
Many traders don't know how to dynamically create Pineconnector-compatible alerts using the data from their TradingView scripts.
Traders using trading bots want their alerts to reflect the stop-loss/take-profit/trailing-stop/stop-loss to break options from your script and then create the orders accordingly.
This script showcases how to create Pineconnector alerts dynamically.
Pineconnector doesn't support alerts with multiple Take Profits.
As a workaround, for 2 TPs, I had to open two trades.
It's not optimal, as we end up paying more spreads for that extra trade - however, depending on your trading strategy, it may not be a big deal.
TRADINGVIEW ALERTS
1) You'll have to create one alert per asset X timeframe = 1 chart.
Example: 1 alert for EUR/USD on the 5 minutes chart, 1 alert for EUR/USD on the 15-minute chart (assuming you want your bot to trade the EUR/USD on the 5 and 15-minute timeframes)
2) Select the Order fills and alert() function calls condition
3) For each alert, the alert message is pre-configured with the text below
{{strategy.order.alert_message}}
Please leave it as it is.
It's a TradingView native variable that will fetch the alert text messages built by the script.
4) Don't forget to set the Pineconnector webhook URL in the Notifications tab of the TradingView alerts UI.
You’ll find the URL on the Pineconnector documentation website.
EA CONFIGURATION
1) The Pyramiding in the EA on Metatrader must be set to 2 if you want to trade with 2 TPs => as it's opening 2 trades.
If you only want 1 TP, set the EA Pyramiding to 1.
Regarding the other EA settings, please refer to the Pineconnector documentation on their website.
2) In the EA, you can set a risk (= position size type) in %/lots/USD, as in the TradingView backtest settings.
KEY FEATURES
I) Modular Indicator Connection
* plug in your existing indicator into the template.
* Only two lines of code are needed for full compatibility.
Step 1: Create your connector
Adapt your indicator with only 2 lines of code and then connect it to this strategy template.
To do so:
1) Find in your indicator where the conditions print the long/buy and short/sell signals.
2) Create an additional plot as below
I'm giving an example with a Two moving averages cross.
Please replicate the same methodology for your indicator, whether it's a MACD , ZigZag , Pivots , higher-highs, lower-lows, or whatever indicator with clear buy and sell conditions.
//@version=5
indicator("Supertrend", overlay = true, timeframe = "", timeframe_gaps = true)
atrPeriod = input.int(10, "ATR Length", minval = 1)
factor = input.float(3.0, "Factor", minval = 0.01, step = 0.01)
= ta.supertrend(factor, atrPeriod)
supertrend := barstate.isfirst ? na : supertrend
bodyMiddle = plot(barstate.isfirst ? na : (open + close) / 2, display = display.none)
upTrend = plot(direction < 0 ? supertrend : na, "Up Trend", color = color.green, style = plot.style_linebr)
downTrend = plot(direction < 0 ? na : supertrend, "Down Trend", color = color.red, style = plot.style_linebr)
fill(bodyMiddle, upTrend, color.new(color.green, 90), fillgaps = false)
fill(bodyMiddle, downTrend, color.new(color.red, 90), fillgaps = false)
buy = ta.crossunder(direction, 0)
sell = ta.crossunder(direction, 0)
//////// CONNECTOR SECTION ////////
Signal = buy ? 1 : sell ? -1 : 0
plot(Signal, title = "Signal", display = display.data_window)
//////// CONNECTOR SECTION ////////
Important Notes
🔥 The Strategy Template expects the value to be exactly 1 for the bullish signal and -1 for the bearish signal
Now, you can connect your indicator to the Strategy Template using the method below or that one.
Step 2: Connect the connector
1) Add your updated indicator to a TradingView chart
2) Add the Strategy Template as well to the SAME chart
3) Open the Strategy Template settings, and in the Data Source field, select your 🔌Connector🔌 (which comes from your indicator)
Note it doesn’t have to be named 🔌Connector🔌 - you can name it as you want - however, I recommend an explicit name you can easily remember.
From then, you should start seeing the signals and plenty of other stuff on your chart.
🔥 Note that whenever you update your indicator values, the strategy statistics and visuals on your chart will update in real-time
II) Customizable Risk Management
- Choose between percentage or USD modes for maximum drawdown.
- Set max consecutive losing days and max losing streak length.
- I used the code from my friend @JosKodify for the maximum losing streak. :)
Will halt the EA and backtest orders fill whenever either of the safeguards above are “broken”
III) Intraday Risk Management
- Limit the maximum intraday losses both in percentage or USD.
- Option to set a maximum number of intraday trades.
- If your EA gets halted on an intraday chart, auto-restart it the next day.
IV) Spread and Account Filters
- Trade only if the spread is below a certain pip value.
- Set requirements based on account balance or equity.
V) Order Types and Position Sizing
- Choose between market, limit, or stop orders.
- Set your position size directly in the template.
Please use the position size from the “Inputs” and not the “Properties” tab.
Reason : The template sends the order on the same candle as the entry signals - at those entry signals candles, the position size isn’t computed yet, and the template can’t then send it to Pineconnector.
However, you can use the position size type (USD, contracts, %) from the “Properties” tab for backtesting.
In the EA, you can define the position size type for your orders in USD or lots or %.
VI) Advanced Take-Profit and Stop-Loss Options
- Choose to set your SL/TP in either pips or percentages.
- Option for multiple take-profit levels and trailing stop losses.
- Move your stop loss to break even +/- offset in pips for “risk-free” trades.
VII) Logger
The Pineconnector commands are logged in the TradingView logger.
You'll find more information about it in this TradingView blog post .
WHY YOU MIGHT NEED THIS TEMPLATE
1) Transform your indicator into a Pineconnector trading bot more easily than before
Connect your indicator to the template
Create your alerts
Set your EA settings
2) Save Time
Auto-generated alert messages for Pineconnector.
I tested them all, and I checked with the support team what could/can’t be done
3) Be in Control
Manage your trading risks with advanced features.
4) Customizable
Fits various trading styles and asset classes.
REQUIREMENTS
* Make sure you have your Pineconnector license ID.
* Create your alerts with the Pineconnector webhook URL
* If there is any issue with the template, ask me in the comments section - I’ll answer quickly.
BACKTEST RESULTS FROM THIS POST
1) I connected this strategy template to a dummy Supertrend script.
I could have selected any other indicator or concept for this script post.
I wanted to share an example of how you can quickly upgrade your strategy, making it compatible with Pineconnector.
2) The backtest results aren't relevant for this educational script publication.
I used realistic backtesting data but didn't look too much into optimizing the results, as this isn't the point of why I'm publishing this script.
This strategy is a template to be connected to any indicator - the sky is the limit. :)
3) This template is made to take 1 trade per direction at any given time.
Pyramiding is set to 1 on TradingView.
The strategy default settings are:
* Initial Capital: 100000 USD
* Position Size: 1 contract
* Commission Percent: 0.075%
* Slippage: 1 tick
* No margin/leverage used
WHAT’S COMING NEXT FOR YOU GUYS?
I’ll make the same template for ProfitView, then for AutoView, and then for Alertatron.
All of those are free and open-source.
I have no affiliations with any of those companies - I'm publishing those templates as they will be useful to many of you.
Dave

Ultimate Grid Tool + Alerts (DCA & Limit Orders) [enzedengineer]Overview
The "Ultimate Grid Tool + Alerts" script works much like a grid bot from automated trading services such as 3Commas making it a good free alternative with some extra utility.
How it works
The user is prompted to set up a grid by manually defining a lower and upper range and then by selecting how many grid segments they want (max 20). The script will automatically create equally spaced grids within this defined range. The script has built in alerts which are intended to be used in conjunction with a third-party application to execute buy and sell orders on an exchange.
The script has two alert functionalities to choose between:
Limit orders (like traditional grid bots) or;
DCA zones (time-based)
DCA zones:
This is the default selection. Each zone has its own alert condition which is triggered if the price closes within that zone. The frequency of the alert is determined by the user's chart resolution, therefore you can have the alert trigger every day, or 4 hours, or 30 minutes and so on. This allows for flexibility, for example, you could go from DCA'ing at $20 per day at higher prices to $100 per day as the price drops into the lower end of your grid range.
Limit orders:
This mode is selected by checking the "Limit Order" box. As mentioned earlier, this mode works like traditional grid bots with each grid line representing a limit order. The alert condition is met when ta.cross(close, gridline) = true.
Buy and Sell:
This mode is selected by checking the "Buy and Sell" box. This is a visual modification only which changes the colour of the grids to help plan the user's trading. Please note, there is no buying or selling logic within the script itself - this should be built into the alert message to be used with a third-party application for exchange order execution.
Use case: The author of this script has been using it with the default settings to DCA into Bitcoin in the current bear market. Using a chart resolution of 15 minutes the script purchases x-amount of Bitcoin every 15 minutes (Alertatron executes the exchange orders). This method provides a well blended average price and takes away the internal conundrum of "should I buy some today". No matter what, the bot will make a purchase within at least 15 minutes of the ultimate Bitcoin bottom and arguably this gives a psychological edge and reduces FOMO (fear of missing out).
MPF EMA Cross Strategy (8~13~21) by Market Pip FactoryThis script is for a complete strategy to win maximum profit on trades whilst keeping losses at a minimum, using sound risk management at no greater than 1.5%
The 3x EMA Strategy uses the following parameters for trade activation and closure.
1/ Daily Time Frame for trend confirmation
2/ 4 Hourly Time Frame for trend confirmation
3/ 1 Hourly Time Frame for trend confirmation AND trade execution
4/ 3x EMAs (Exponential Moving Averages)
* EMA#1 = 8 EMA (Red Color)
* EMA#2 = 13 EMA (Blue Color)
* EMA#3 = 21 EMA (Orange Color)
5/ Fanning of all 3x EMAs and CrossOver/CrossUnder for Trend Confirmation
6/ Price Action touching an 8 EMA for trade activation
7/ Price Action touching a 21 EMA for trade cancellation BEFORE activation
* For LONG trades: 8 EMA would be ABOVE 21 EMA
* For SHORT trades: 8 EMA would be BELOW 21 EMA
* For trade Cancellation, price action would touch the 21 EMA before trade is activated
* For trade Entry, price action would touch 8 EMA
Once trigger parameter is identified, entry is found by:
a) Price action touches 8 EMA (Candle must Close for confirmed Trade preparation)
b) Trade preparation can be cancelled before trade is activated if price action touches 21 EMA
c) Trailing Stop Loss can be used (optional) by counting back 5 candles from current candle
CLOSURE of a Trade is identified by:
e) 8 EMA crossing the 21 EMA, then close trade, no matter LONG or SHORT
f) Trail Stop Loss
IMPORTANT:
g) No more than ONE activated trade per EMA crossover
h) No more than ONE active trade per pair
NOTE: This strategy is to be used in conjunction with Cipher Twister (my other indicator) to reduce trades on
sideways price action and market trends for super high win ratio.
NOTE: Enabling of LONGs and SHORTs Via Cipher Twister is done by using the previous
green or red dot made. Additionally, when the trend changes, so do the dot's validity based
on being above or below the 0 centerline.
----------------------------
Strategy and Bot Logic
----------------------------
.....::: FOR SHORT TRADES ONLY :::.....
The Robot must use the following logic to enable and activate the SHORT trades:
Parameters:
$(crossunder)=8EMA,21EMA=Bearish $(crossover)=8EMA,21EMA=Bullish $entry=SELL STOP ORDER (Short)
$EMA#1 = 8 EMA (Red Color) $EMA#2 = 13 EMA (Blue Color) $EMA#3 = 21 EMA (Orange Color)
Strategy Logic:
1/ Check Daily Time Frame for trend confirmation if:
(look back up to 50 candles - find last cross of EMAs)
$(chart)=daily and trend=$(crossunder) then goto 2/ *Means: crossunder = ema21 > ema8
$(chart)=daily and trend=$(crossover) then stop (No trades) *Means: crossover = ema8 > ema21
NOTE: This function is switchable. 0=off and 1=on(active). Default = 1 (on)
2/ Check 4 Hourly Time Frame for trend confirmation if:
(look back up to 50 candles - find last cross of EMAs)
$(chart)=4H and trend=$(crossunder) then goto 3/ *Means: crossunder = ema21 > ema8
$(chart)=4H and trend=$(crossover) then stop (No trades) *Means: crossover = ema8 > ema21
NOTE: This function is switchable. 0=off and 1=on(active). Default = 1 (on)
3/ 1 Hourly Time Frame for trend confirmation AND trade execution if:
(look back up to 50 candles - find last cross of EMAs)
$(chart)=1H and trend=$(crossunder) then goto 4/ *Means: crossunder = ema21 > ema8
$(chart)=1H and trend=$(crossover) then stop (No trades) *Means: crossover = ema8 > ema21
4/ Trade preparation:
* if Next (subsequent) candle touches 8EMA, then set STOP LOSS and ENTRY
* $stoploss=3 pips ABOVE current candle HIGH
* $entry=3 pips BELOW current candle LOW
5/ Trade waiting (ONLY BEFORE entry is hit and trade activated):
* if price action touches 21 EMA then cancel trade and goto 1/
Note: Once trade is active this function does not apply !
6/ Trade Activation:
* if price activates/hits ENTRY price, then bot activates trade SHORTs market
7/ Optional Trailing stop:
* if active, then trailing stop 3 pips ABOVE previous HIGH of previous 5th candle
or * Move Stop Loss to Break Even after $X number of pips
NOTE: This means count back and apply accordingly to the 5th previous candle from current candle.
NOTE: This function is switchable. 0=off and 1=on(active). Default = 0 (off)
8/ Trade Close ~ Take Profit:
* Only TP when
$(chart)=1H and trend=$(crossover) then close trade ~ Or obviously if Stop Loss is hit if 7/ is activated.
----------END FOR SHORT TRADES LOGIC----------
.....::: FOR LONG TRADES ONLY :::.....
The Robot must use the following logic to enable and activate the LONG trades:
Parameters:
$(crossunder)=8EMA,21EMA=Bearish $(crossover)=8EMA,21EMA=Bullish $entry=BUY STOP ORDER (Long)
$EMA#1 = 8 EMA (Red Color) $EMA#2 = 13 EMA (Blue Color) $EMA#3 = 21 EMA (Orange Color)
Strategy Logic:
1/ Check Daily Time Frame for trend confirmation if:
(look back up to 50 candles - find last cross of EMAs)
$(chart)=daily and trend=$(crossover) then goto 2/ *Means: crossover = ema8 > ema21
$(chart)=daily and trend=$(crossunder) then stop (No trades) *Means: crossunder = ema21 > ema8
NOTE: This function is switchable. 0=off and 1=on(active). Default = 1 (on)
2/ Check 4 Hourly Time Frame for trend confirmation if:
(look back up to 50 candles - find last cross of EMAs)
$(chart)=4H and trend=$(crossover) then goto 3/ *Means: crossover = ema8 > ema21
$(chart)=4H and trend=$(crossunder) then stop (No trades) *Means: crossunder = ema21 > ema8
NOTE: This function is switchable. 0=off and 1=on(active). Default = 1 (on)
3/ 1 Hourly Time Frame for trend confirmation AND trade execution if:
(look back up to 50 candles - find last cross of EMAs)
$(chart)=1H and trend=$(crossover) then goto 4/ *Means: crossover = ema8 > ema21
$(chart)=1H and trend=$(crossunder) then stop (No trades) *Means: crossunder = ema21 > ema8
4/ Trade preparation:
* if Next (subsequent) candle touches 8EMA, then set STOP LOSS and ENTRY
* $stoploss=3 pips BELOW current candle LOW
* $entry=3 pips ABOVE current candle HIGH
5/ Trade waiting (ONLY BEFORE entry is hit and trade activated):
* if price action touches 21 EMA then cancel trade and goto 1/
Note: Once trade is active this function does not apply !
6/ Trade Activation:
* if price activates/hits ENTRY price, then bot activates trade LONGs market
7/ Optional Trailing stop:
* if active, then trailing stop 3 pips BELOW previous LOW of previous 5th candle
or * Move Stop Loss to Break Even after $X number of pips
NOTE: This means count back and apply accordingly to the 5th previous candle from current candle.
NOTE: This function is switchable. 0=off and 1=on(active). Default = 0 (off)
8/ Trade Close ~ Take Profit:
* Only TP when
$(chart)=1H and trend=$(crossunder) then close trade ~ Or obviously if Stop Loss is hit if 7/ is activated.
----------END FOR LONG TRADES LOGIC----------
IMPORTANT:
* If an existing trade is already open for that same pair, & price action touches 8EMA, do NOT open a new trade..
* bot must continuously check if a trade is currently open on the pair that triggers
* New trades are to be only opened if there is no active trade opened on current pair.
* Only 1 trade per pair rule !
* 5 simultaneous open trades (not same pairs) default = 5 but value can be changed accordingly.
* Maximum risk management must not exceed 1.5% on lot size
*** Some features are not yet available autoated, they will be added in due course in subsequent version updates ***

Dual Fibonacci Zone & Ranged Vol DCA Strategy - R3c0nTraderWhat does this do?
This is for educational purposes and allows one to backtest two Fibonacci Zones simultaneously. This also includes an option for Ranged Volume as a parameter.
Pre-requisites:
First off, this is a Long only strategy as I wrote it with DCA in mind. It cannot be used for shorting. Shorting defeats the purpose of a DCA bot which has a goal that is Long a position not Short a position. If you want to short, there are plenty of free scripts out there that do this.
You must have some base knowledge or experience with Fibonacci trading, understanding what is ADX, +DI (and -DI), etc.
You can use this script without a 3Commas account and see how 3Commas DCA Bot would perform. However, I highly recommend inexperienced uses get a free account and going through the tutorials, FAQ's and knowledgebase. This would give you a base understanding of the settings you will see in this strategy and why you will need to know them. Only then should you try testing this strategy with a paper bot.
Background
After I had created and released "Fibonacci Zone DCA Strategy", I began expanding and testing other ideas.
The first idea was to add Ranged Volume to the Fibonacci Zone DCA strategy which I wanted for providing further confirmation before entering a trade. The second idea was to add a second Fibonacci Zone that was just as configurable as the first Fibonacci Zone. I managed to add both and they can be easily enabled or disabled via the strategy settings menu.
Things Got Real Interesting
Things got real interesting when I started testing strategies with two Fibonacci zones. Here's a quick list of what I found I was able to do:
Mix and match exit strategies. I could set the Fib-1 zone strategy to exit with a take profit % and separately set the Fib-2 zone strategy to exit when the price crosses the top-high fib border
Trade the trend. A common phrase amongst traders is "the Trend is your friend" and with the help of an additional Fib Zone, I was able to trade the trend more often by using two different Fib Zone strategies which if configured properly can shorten time to re-deploy capital, increase number of closed trades, and in some cases increase net profit.
Trade both bull market uptrends and bear market downtrends in the same strategy. I found I could configure one Fib Zone strategy to be really good in uptrends and another Fib Zone strategy to be really good in downtrends. In some cases, with both Fib Zone strategies enabled together in a single strategy I got better results than if the strategies were backtested separately.
There are many other trade strategies I am finding with this. One could be to trade a convergence or divergence of the two different Fib Zones. This could possibly be achieved by setting one strategy to have different Fibonacci length.
Credits:
Thank you "EvoCrypto" for granting me permission to use "Ranged Volume" to create this strategy
Thank you "eykpunter" for granting me permission to use "Fibonacci Zones" to create this strategy
Thank you "junyou0424" for granting me permission to use "DCA Bot with SuperTrend Emulator" which I used for adding bot inputs, calculations, and strategy

Fibonacci Zone DCA Strategy - R3c0nTraderCredits:
Thank you "eykpunter" for granting me permission to use "Fibonacci Zones" to create this strategy
Thank you "junyou0424" for granting me permission to use "DCA Bot with SuperTrend Emulator" which I used for adding bot inputs, calculations, and strategy
Pre-requisites:
You can use this script without a 3Commas account and see how 3Commas DCA Bot would perform. However, I highly recommend signing up for their free account, going through their training, and testing this strategy with a paper bot. This would give you a base understanding of the settings you will see in this strategy and why you will need to know them.
What can this do?
First off, this is a Long only strategy as I wrote it with DCA in mind. It cannot be used for shorting. Shorting defeats the purpose of a DCA bot which has a goal that is Long a position not Short a position. If you want to short, there are plenty of free scripts out there that do this.
I created this script out of curiosity and I wanted to see how a strategy based on “Fibonacci” levels would work with a 3Commas DCA bot. I came across "eykpunter’s" "Fibonacci Zones" study and in TradingView and I found it to be a very interesting concept. The "Fib Zones" in his study are basically a "Donchian Channel" of 4 Fibonacci lines. These are the High @ 0.236, Center High @ 0.382, Center Low @ 0.618, and Low @ 0.764.
The Fib Zones in this strategy can be used as conditions to open a trade as well as closing a trade. There is also the option to close a trade based on a Target Take Profit (%).
Advanced Fibonacci trading is also supported by specifying additional parameters for Trade Entry and Exit.
For example, for order entry, you can increase the minimum trend strength to open an order via the "minimum ADX value" option. You can also further limit order entry by selecting the option to "Only open trades on bullish +DI" (Positive Directional Index).
Or you can play the contrarian. For example, I would look for "buying the dip" opportunities by doing the following under "Trade Entry Settings":
Set the "Min ADX value to open trade" to zero
Set the option "Open a trade when the price moves" to "1-To the bottom of Downtrend Fib zone" or "2-Higher than the top of the Downtrend Fib zone"
Uncheck option "Only open trades on bullish +DI"
Set the 'Min ADX value to open trade' to Zero
Set the 'Max +DI value to open trade' to a value between 10-20.
For Trade Exit settings, I can use a "Target Take Profit (%)" or one of the High Fib levels to close the trade.
Here's an example result when using a Contrarian-Fibonacci-Zone-DCA strategy:
Explanation of Chart lines and colors on chart
Six Options for Entering a Fibonacci Trade
Open a trade when the price moves:
1-To the bottom of Downtrend Fib zone
2-Higher than the top of the Downtrend Fib zone
3-Higher than the bottom of Ranging Fib Zone
4-Higher than the top of Ranging Fib Zone
5-Higher than the bottom of Uptrend Fib Zone
6-To the top of Uptrend Fib Zone
Three Options for Exiting a Fibonacci Trade
Take profit using:
"Target Take Profit (%)"
"High Fibonacci Border-1"
"High Fibonacci Border-2"

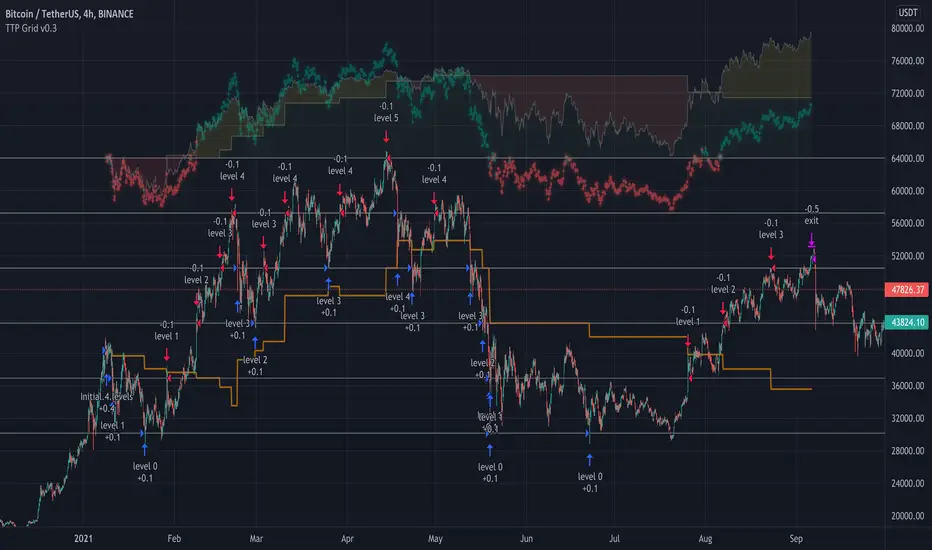
TTP Grid BacktesterThis pine script strategy allows to backtest Grid bots.
This initial version offers the following features:
- Set the top and bottom limits of the grid
- Plots the average position price, realised and unrealised profits
- Set the value to invest
- This script is a strategy so you can check each individual buy/sell, stats and all included with strategies
What does it do:
- Depending where is located the initial close price relative to the grid (above, below, inside) it will buy for as many levels are above the price.
- It will disable a level that recently filled an order (in the way grids bot do)
- When the grid starts it will disable the closest grid level
- It places limit orders in the active levels and many levels can be filled in a single candle
- You can activate recalculate on each order filled, which will allow to fill further needed orders if the price swings up and down crossing multiple times multiple grid levels but I have found that doing this can compromise the accuracy of the price used on those levels (there are minor gaps between the filled price and the original level price)
How to use it:
- When you add this strategy to the chart you will be asked to select the top and bottom limits of the grid
- Notice you can always select the strategy in the chart and drag and drop the limits to adjust the grid
- Once the grid is in place, you can use either lower chart timeframes for higher accuracy of the stats, or higher timeframes if you want to privilege longer periods of testing
How to set the correct "initial capital"
In order to prevent getting wrong stats you need to make sure you are using the correct initial capital. If you put less than what you are actually using your results will be over inflated. If you set an initial capital below what the bot requires, your results will be smaller than they should.
- If you want to use exactly 100% of the capital for the grid use then first select what amount per level you want to use. Set this value in the settings of the indicator (if you are trading BTCUSD pair, how much BTC you want to use per level, 0.01 for example).
- Once you have set this value, then open the TradingView "Data Window" to be able to visualise the calculation of cash required to run the grid that the strategy is giving you. In our example with BTCUSD this value will be given in USD.
- Enter this amount in the "Properties" tab, "Initial Capital". If you enter the exact amount you will be using all for the grid usage.
- The grid first action will be to buy 0.01 for each level that is above the current price in the first candle of the chart. If there are no levels above it won't do any initial investment.
- The rest of the cash will be use to buy levels below if the price goes to the lower range of the grid later
Intention of this script
I built this script to help me understand better how grid bots work.
Understanding the flow of realised vs unrealised profits in a grid can help me understand why sometimes even if you are in red on unrealised profits, you can still compensate with realised profits and many other tricky scenarios with grids.
Sometimes I'm running a grid bot and would like to simulate how much better (or worst) it would have been to run it using different limits.
Future work and ideas
Initially I'm focusing on confirming that the grid behaves correctly and that the stats are as accurate as possible.
That is the first priority.
Once I feel more confident with the accuracy I will consider adding some of the following ideas (not in any particular order):
- Table with stats including: price of each level, times the level filled an order, times it was use for selling/buying, etc. Time it took to become in realised profit. Comparison against profits from buy & hold.
- Trailing TP/SL
- Entry/exit price
- Trading time window: only trade between the specified dates/times
- Alerts
MoonFlag DailyThis is a useful indicator as it shows potential long and short regions by coloring the AI wavecloud green or red.
There is an option to show a faint white background in regions where the green/red cloud parts are failing as a trade from the start position of each region.
Its a combination of 3 algos I developed, and there is an option to switch to see these individually, although this has lots of info and is a bit confusing.
It does have alerts and there are text boxes in the indicator settings where a comment can be input - this is useful for webhooks bots auto trading.
Most useful in this indicator is that at the end of each green/long or red/short region there is a label that shows the % gain or loss for a trade.
The label at the end of the chart shows the % of winning longs/shorts and the average % gain or loss for all the longs/shorts within the set test period (set in settings)
So, I generally set the chart initially on a 15min timeframe with the indicator timeframe (in settings) set to run on say 30min or 1hour. I then select a long test period (several plus months) and then optimize the wavelcloud length (in settings) to give the best %profit per trade. (Longs always seem to give better results than shorts)
I then, change the chart timeframe to much faster, say 1min or 5min, but leave the indicator timeframe at 1 hour. In this manner - the label only shows a few trades however, the algo is run at every bar close and when this is set to 1min, this means that losses will be minimised at the bot exits quickly. In comparison - if the chart is on a 15min timeframe - it can take this amount before the bot will exit a trade and by then there could be catastrophic losses.
It is quite hard to get a positive result - although with a bit of playing around - just as a background indicator - I find this useful. I generally set-up on say 4charts all with different timeframes and then look for consistency between the long/short signal positions. (Although when I run as a bot I use a fast timeframe)
Please do leave some comments and get in touch.
MoonFlag (Josef Tainsh PhD)

3Commas TA Start Conditions Indicator v1.0Introduction
The indicator attempts to implement the "Technical Analysis Starting Conditions" found in the 3Commas DCA trading bot settings.
How is it original and useful and how does it compare to other scripts in the Public Library?
This indicator is unique in that it's the only one (as of the initial publications) that can handle 5 signal indicator types at the same time as well as output the signal values either to the chart or the data window. The indicator supports all of the following 3Commas built-in indicators on the 3 minute, 5 minute, 15 minute, 30 minute, 1 hour, 2 hour, and 4 hour time frames:
RSI-7
ULT-7-14-2
BB-20-1-LB (Long)
BB-20-2-LB (Long)
MFI-14 crosses 40 (Long)
MFI-14 crosses 20 (Long)
CCI-40 crosses -200 (Long)
BB-20-1-UB (Short)
BB-20-2-UB (Short)
MFI-14 crosses 65 (Short)
CCI-40 crosses 0 (Short)
CCI-40 crosses 100 (Short)
What does it do and how does it do it?
When applied to the chart for the first time, the default settings are completely blank, so the only chart element you will see is the "Start Condition Result" line in orange. Once you start applying settings in the "DEAL START CONDITION" section, the indicator will redraw and display the new values for the "Start Condition Result" line. A value of 1 indicates that the results of the condition(s) is "passing". Conversely, a value of 0 indicates that the results of the condition(s) is NOT passing. If you desire to dig deeper into why the indicator is producing the results, you can enable the "Show TA Indicator # Plot" to visually see the values on the price chart or simply open the Data Window panel to see their values as you hover over the candles in the price chart.
This indicator can be used with any indicator in the Public Library that seeks to emulate the 3Commas Technical Analysis Starting Conditions for a signal provider. For example, this indicator can be used our own 3Commas DCA Bot Strategy v1.0 to aid in your backtesting analysis and build confidence that your bot will perform given historical market data that TradingView provides. When you do so, make sure that the "Strategy" input has the same values with the two indicator settings.
Enjoy! 😊👍
How to obtain access to the script?
You have two choices:
Use the "Website" link below to obtain access to this indicator, or
Send us a private message (PM) in TradingView itself.
[ADOL_]ARVIS 3ENG) This is version 3 of ARVIS BOT. ARVIS 3
Since it is a new version with a completely different identity from Trend Break, we do not use the name Trend Break.
It is a version made lighter in the existing version and newly created logic.
Existing ARVIS users can use versions 1, 2, 3 and 3R auxiliary tools to be added without additional rights.
Optional use is possible.
principle)
Features of the new core logic:
It was created considering the relative strength RSI and the ICHIMOKU moving average.
Identify the trend strength to generate a long and short reversal signal at the reversal of the trend.
By using HTF signal, it is possible to bring the signal of the upper time to the smaller time.
By using HTF, the candle splits and the standard maintains the flow of time.
A method was used to reduce the whipsaw of frequent signal appearances.
option)
A volatility warning notification has been included. A function that alerts you before volatility increases.
It is indicated in the form of ■ at the bottom of the chart.
You can optionally set the signal range.
Dynamic Fibonacci moving along the candlestick was applied. 0.5 is used as a criterion for determining a large trend.
By combining the RSI and the moving average, you can apply a background that utilizes the RSI as a sensitivity.
By combining RSI and Stochastic, the overbought/oversold section was output as the background.
You can output overbought/oversold at the desired time as a background.
Up/down divergence included as background.
Black is downward divergence and white is upward divergence.
In the lower right corner, an indicator for the probability of a long is added by combining the multiple moving averages and the figures analyzed for the convergence trend.
50% is used as a reference point for long/short conversion, 10~20% is considered oversold section, and 80~90% is considered overbought section.
It can be used as a reference point for counter-trend trading. Probability indicators allow you to increase your judgment with visualized numbers.
principle example)
time frame)
Recommended time frame: 15-minute peaks >> 1-hour peaks > 1.3-minute peaks = 4 hour peaks = daily
alarm)
Various alert functions are available. based on the alert signal
When trading, various signals help to set specific conditions.
- HTF Long Short , Alert
- Volatility warning alert
- Basic long and short alerts
- Up/down divergence alert
trading method)
1. Utilize SIGNAL1 L,S signals. It is a similar approach to the existing manual bot mode.
2.SIGNAL2's , signals can bring high-time signals to buy and sell. This is a similar approach to the existing autobot mode.
If you bring a high time signal to a small time, you can refine the hit point, so in this case, use SIGNAL2 of 15 minutes or longer.
SIGNAL2 15-minute view at 3-minute peak, SIGNAL 1 hour view at 15-minute peak, and SIGNAL 4 hour view at 1-hour peak are recommended values.
3-1. Entry criteria/stop loss criteria (when trading hands and bots)
- entry criteria; Follow the signal.
- Stop loss criteria;
Use fixed stop loss: Set 1% fixed stop loss section from signal generation. (% is set individually)
Use Candle Stop Loss: Set a stop loss when the low or high point of the signal generating bar collapses.
Use flow stop loss: Set the stop loss considering the flow of the wave.
3-2. Entry criteria/stop loss criteria (in case of signal-based bot trading)
- It is not recommended to use more than 3x magnification. The above entry requires manual intervention and risk management.
It switches every time the opposite signal appears after entering without setting the stop loss separately.
Example of using the 15-minute HTF signal in the 3-minute scale
4. Note
You are solely responsible for any trading decisions you make.
ARVIS 3R indicator will be updated. Required for use of ARVIS 3
This is an additional feature. It is created as an indicator at the bottom, not as a candle chart.
5. How to use
It is set to be available only to invited users. When invited,
Tap Add Indicator to Favorites at the bottom of the indicator.
If you click the indicator at the top of the chart screen and look at the left tab, there is a Favorites tab.
Add an indicator by clicking the indicator name in the Favorites tab.
KOR) ARVIS BOT의 3버전입니다. ARVIS 3
Trend Break와 정체성을 완전히 달리한 신버전이므로
더이상 Trend Break 의 명칭을 쓰지 않습니다.
기존버전을 경량화하고 로직을 새롭게 만든 버전입니다.
기존의 ARVIS 이용자는 추가 권한 없이 1,2,3버전과 추가될 3R보조도구의
선택 활용이 가능합니다.
원리)
새로운 핵심적인 로직의 기능 :
상대강도인 RSI와 ICHIMOKU 이평선을 고려하여 만들어졌습니다.
추세강도를 파악해 추세의 전환자리에서 롱과 숏의 전환 신호를 발생시키도록 합니다.
HTF신호를 이용하여 상위 시간의 신호를 작은 시간대로 가져올 수 있습니다.
HTF를 활용함으로써 캔들은 쪼개고 기준은 상위 시간의 흐름을 유지해
잦은 신호출현의 휩쏘를 줄이는 방법을 사용하였습니다.
옵션)
변동성 경고 알림이 포함되었습니다. 변동성이 커지기 전에 미리 알려주는 기능으로
차트하단에 ■ 형태로 표기됩니다.
시그널의 범위를 옵션으로 설정할 수 있습니다.
캔들을 따라 움직이는 동적 피보나치가 적용되었습니다. 0.5를 큰 추세 판단 기준으로 활용합니다.
RSI와 이평선을 결합하여 RSI를 민감도로 활용한 배경을 적용할 수 있습니다.
RSI와 스토캐스틱을 결합하여 과매수/과매도구간을 배경으로 출력하였습니다.
원하는 시간의 과매수/과매도를 배경으로 출력할 수 있습니다.
상승/하락 다이버전스가 배경으로 포함되었습니다.
검은색은 하락다이버전스, 흰색은 상승다이버전스입니다.
우측하단에 다중이평선과 수렴추세를 분석한 수치를 종합하여 롱의 확률에 대한 표시기가 추가되었습니다.
50%는 롱/숏의 전환 기준점으로 활용하며, 10~20%는 과매도 구간, 80~90%는 과매수 구간으로 간주하여
역추세 매매의 기준점으로 활용할 수 있습니다. 확률 표시기를 통해 가시화된 수치로 판단을 높일 수 있습니다.
원리 예시)
타임프레임)
추천타임프레임 : 15분봉 >> 1시간봉 > 1,3분봉 = 4시간봉 = 일봉
알람)
다양한 얼러트 기능을 사용할 수 있습니다. 얼러트 신호를 기반으로
매매시 다양한 신호는 구체적 조건 설정에 도움이 됩니다.
- HTF 롱숏🥵,🥶 얼러트
- 변동성 경고 얼러트
- 기본 롱,숏 얼러트
- 상승/하락 다이버전스 얼러트
매매방법)
1. SIGNAL1 L,S 신호를 활용합니다. 기존의 수동봇 모드와 비슷한 접근입니다.
2.SIGNAL2의 🥵,🥶 신호는 높은 시간의 신호를 가져와 매매할 수 있습니다. 기존의 자동봇 모드와 비슷한 접근입니다.
높은 시간대의 신호를 작은시간으로 가져오면 타점을 정교화 할 수 있으므로, 이와같은 경우 15분 이상의 SIGNAL2를 활용합니다.
3분봉에서 SIGNAL2 15분 보기, 15분봉에서 SIGNAL 1시간 보기, 1시간봉에서 SIGNAL 4시간 보기가 추천값입니다.
3-1. 진입기준/손절기준(손,봇 매매시)
- 진입기준; 시그널을 따릅니다.
- 손절기준;
고정손절가 이용 : 시그널 발생으로부터 1% 고정 손절가 구간을 설정합니다.(%는 개별로 설정)
캔들손절가 이용 : 시그널 발생봉의 저점이나 고점이 무너지면 손절을 설정합니다.
흐름손절가 이용 : 파동의 흐름을 고려하여 손절을 설정합니다.
3-2. 진입기준/손절기준(신호기반 봇 매매시)
- 3배율 이상을 권장하지 않습니다. 이상의 진입은 수동개입으로 리스크관리가 필요합니다.
손절가를 따로 설정하지 않고 진입후 반대신호가 뜰때마다 스위칭을 합니다.
3분봉에서 15분HTF 신호사용의 예시
4. 참고
귀하가 내리는 모든 거래 결정은 전적으로 귀하의 책임입니다.
ARVIS 3R 지표가 업데이트 예정입니다. ARVIS 3의 활용에 필요한
부가적인 기능입니다. 캔들차트가 아닌 하단의 지표로 생성됩니다.
5. 사용방법
초대된 사용자만 사용할 수 있도록 설정이 되어있습니다. 초대를 받을 경우,
지표 하단의 즐겨찾기에 인디케이터 넣기를 누릅니다.
차트화면 상단에 지표를 눌러서 왼쪽탭에 보면 즐겨찾기 탭이 있습니다.
즐겨찾기 탭에서 지표이름을 눌러서 지표를 추가합니다.

ComboTrade V.2.1 (BuySell Signals,Take profit,4MA,Fibo,Ichi+QL)A WORD WITH ESTEEMED TRADERS:
The type of indicator that a trader uses to create a strategy depends on the type of strategy he intends to employ; this is related to the trading style and the trader's loss tolerance.
A trader looking for a long-term trade with high profits may adopt a follow-up strategy, and on the other hand, a trader who decides to make short-term trades with frequent but low profits may be eager to use a strategy based on price fluctuations. Different types of indicators can be used to confirm the results.
Indicators alone should not be used as a tool to make trading decisions. Instead, every trader should use indicators to receive trading signals and formulate trading strategies and determine his or her exact method.
Brief and essential description:
With the above description, traders are advised to use the ComboTrade indicator as a trading assistant. Using the tools embedded in this trading assistant makes it easy for traders and depending on the trading strategy, you can get the best result for positioning.
Note 1: The trading time frame for ComboTrade with over one hour (1H) will achieve best result. Checking out the lower time frame to buy or sell as a confirmation is recommended.
Note 2: At Trading View home screen choose “ Candles or ...” as “Bar’s Style”.
Once you added ComboTrade into to your chart, go to the setting gear of the ComboTrade indicator, which includes two sections: “Input” and “Style”.
The “Input” section is for the input values of the indicators and the “Style” section is for activating and deactivating the tools.
Activate Moving Average 7, 21, 50 and 200 with close (Default)
Activate Combo Cloud by tick the “Show ichimoku” if you use it (Default)
By activating ichimoku, three components will be added to the Como Cloud with below details:
1- The “Quality Line” shows the quality line (26 Kijun-sen future candlesticks) which helps the trader to understand the direction of the trend and will help the trader to make a decision.
2. The “Period Line” shows the 103-day period and can act as a support and resistance tool. In addition, this number can be changed.
3- The intersection of various Como cloud lines has also been installed.
The TP (Take Profit) signal indicates a similar buy or sell area using the RSI and Stochastic oscillators, and be sure to pay special attention to it. Be sure to tick the related box (TP) at “Style” section.
The “Trailing Stop” at “Style” section acts as a support and resistance line. It acts as a support when the price candle is placed above the Trailing Stop line and as a resistance if the price candle is placed below the Trailing Stop line.
At “Bot Key Value” in “Input” section, the number is adjustable from 0.25 to any number. According to the trader's strategy, the number of input and output signals in this section can be adjusted. The best number for BTC is 0.78 and for Altcoins is 0.78 to 1.
At “Bot ATR Period” in “Input” section, the best default number is 8. The best values for Altcoins is 8 to 10, which has a significant effect on the regulation of signaling and support and authority lines.
The “Bot Buy” and “Bot Sell” at “Style” section are the main and most important parts of the indicator that you must tick in order to active them both.
“Plot Background” can activate the Como Cloud and set it to green (ascending) and red (descending).
The “Labels” and “Lines” are related to the important Fibonacci tool, which by displaying the lines of the Fibonacci lines and by activating the label, the numbers related to the price and the Fibonacci numbers are displayed. It helps traders to extract data from the last few days.
DISCLAIMER:
ALL DECISIONS AND RISK MANAGEMENT, ETC. ARE THE FULL RESPONSIBILITY OF THE TRADER AND THE AUTHOR IS NOT RESPONSIBLE FOR THE POSITIONS AND THE RESULTS OF THE TRADES (POSSIBLE LOSSES) IN ANY WAYS. DO YOUR OWN RESEARCH (DYOR) BEFORE ENTERING/ EXISTING IN TO/ FROM ANY POSITIONS.
Please like and use your comments after using the indicator.
Always be Profitable!
JebraTrade
14 April 2021

Dankland Playground DCAing multi-strategy OPThis is essentially a script that I made for myself before deciding it may be good enough for you all as well.
How it works basically is this... you have 18 oscillators which can all be used as independently as you wish. That means there are 20 groups which they can be split amongst as you choose.
When in separate groups they should not be able to sell eachothers positions without triggering a stop loss. Every single oscillator has its own position sizing and exit sizing which can be stated as either a percent of balance or a flat amount of contracts. Each oscillator has a minimum amount of profit you can tell it to sell it, which is calculated from the average cost of your current position, which does include all groups. This works out to help you average out better entry and exit prices, essentially a method of DCAing.
You can set the minimum sale amount, which is to keep it from placing orders below your exchanges minimum dollar trade cost.
The included oscillators are as follows:
Chande Momentum cross
Moving Average Cross
MACD cross
%B Bollinger cross
Stochastic cross + region filter
Stochastic RSI cross + region filter
SMII cross and region
Three RMIs
Standard RSI
LSMA-smoothed RSI
Know Sure Thing
RSI of KST
Coppock Curve
RSI of Curve
PPO
RSI of PPO
Trix
RSI of Trix
So the idea is that this is essentially multiple strategies combined into one backtestable house. Balance is calculated for all position sizes in order to try to prevent false entries that plague so many scripts (IE, you set pyramiding to 2, each buy $1000, initial balance $1000, and yet it buys two orders off the bat for $2000 total and nets 400% profit because the second was considered free)/
You tune each side and position size them so that they work together as well as you can and in doing so you are able to create a single backtest that is capable of running a bot, essentially, between multiple strategies - you can run a slower Moving Average cross, a faster SMI cross or MACD, or Bollinger that grabs big moves only, all the while having MACD trade small bonuses along the way. This way you can weight the Risk to Reward of each against eachother.
I will not try to claim this is something you can open and with no work have the best bot on the planet. This scripts intention is to take a lot of relatively common trading strategies and combine them under on roof with some risk management and the ability to weigh each against eachother.
If you are looking for a super advanced singular algorithm that tries to capture every peak and valley exactly on the dot, this is not for you. If you are looking for a tool with a high level of customizability, with a publisher who intends to update it to the best of his ability in accordance to seeking to make the best product that I personally can make for both myself and the community (because I will be using this myself of course!) that was specifically designed with the intention of performing well in spot markets by averaging low entry costs and high exit costs, this is for you! That is the exact intention here.
I do not trade margin currently, I trade spot. I am sure this script can be tuned to work on margin but this is not my intention or area so if this is you and there is something you need for margin specifically implemented, ask, because I likely don't know what you need yet.
The current backtest shown is hand-optimized by myself for BTC/USD 1hr market with NO stop loss enabled and all sales weighed to be around 0% minimum profit from the total average entry cost.
I chose to run it myself with no stop losses because Bitcoin is so bullish to me. The stop losses can still be very profitable, but not 1495% net profit. This style of automation is not for everyone as when running with no stop loss and the requirement every sale is somewhat profitable, or at least no very noticeable loss, you wind up relying on yourself to manually stop out if things crash too much and the bot has to stop trading to wait for market to go back up. The thing to do here if you are playing without a stop loss is to have your own alerts set at your fear level, a % drop in a period of time or something like that, and when you reach that point I would consider resetting the bot so it continues to take trades. I personally will accept a temporary drop in USD as long as I can keep my BTC holdings up overall as the goal should always be to have as many BTC as possible by the start and end of the bull run.

[astropark] 4h Crypto/USDT Strategy [alarms]Dear Followers,
today a new Swing and Scalper Tool , which works great for Cryptocurrencies on the USDT market on 4h timeframe .
This tool has some cool features:
it works on many timeframes, but best one is 4H timeframe : so you can enjoy both manual and bot trading by using a 24/7 running bot;
it comes in three working mode : default, alternative and high frequency ;
auto-stoploss: you can enable an stoploss in trade, bot will follow
It's always suggested to use a proper money and risk management in trades. This is not the "Holy Grail", it does not exist.
Strategy results are calculated from the beginning of 2018 till now, so more than 2 years, using 10000$ as initial capital and working at 1x leverage (no leverage at all!) and 0.1% trading fee already applied.
You can always DM me if you need any help to configure it on your preferred chart or if you want a customization of this bot for a specific pair.
This script will let you set all notification alerts you may need in order to be alerted on each triggered signals.
The one for backtesting purpose can be found by searching for the astropark's "4h Crypto/USDT Strategy" and then choosing the indicator with "strategy" suffix in the name, or you can find here below
This is a premium indicator , so send me a private message in order to get access to this script.
Theft Indicator - BOOM Buy/Sell SignalsWhat is our indicator?
Theft Indicator - BOOM is a script that shows entry levels on a condition that is met with our special algo. The algo consists of crossovers, which are not visible but we take pride in the effort we have put to make this indicator have a high success rate as long as you have a scalping target price set.
Does it Repaint?
Our indicator does NOT re-paint. Although while setting an alert it may pop up the repaint alert, please take into consideration that once a signal is fired on a "CLOSED BAR", our signal will never disappear, they do not repaint.
What Markets is it usable with?
You can use it in any market, Forex, Stocks, Crypto, Indices. All time frames work, not all trades will be profitable (this is how trading is, you can take a loss sometimes). But the Majority is profitable if you use a stop loss and target price.
How to use:
Simple plug and play it to your chart, in addition to a few other indicators we will recommend to you (we still have not published them yet), and this will confirm your trades. You can also connect TV alerts with a bot and let it run. Please be aware that SLIPPAGE time is important, If you run a bot on this indicator you HAVE to know that the buy/sell price will be on the bar AFTER the Candle close (For example: the BUY/SELL alert is on a candle, the buy/sell your bot or you will execute WILL be in the following candle depending on your trading system. We advise you to not leave the bot to trade on its own, you have to monitor and have a specific syntax that we will help you with creating according to your trading style.
P.S: This is not financial advice, we are just sharing our indicator that we know has good results, and it will take time for people in -ve profiles to recover losses and for the profiting to be more profitable. We use a specific trading method that only works with it
You can contact me for more information about the indicator, Goodluck :)

Theft Indicator - Pip GainerWhat is our indicator?
Theft Indicator - Pip Gainer is one of our recent published scripts that shows price action on a certain period of time (We Use a modified version of ATR). We take pride in enabling trading to become easier for the experienced and the non-experienced traders around the globe. Buy & Sell alerts will be fired once a condition in our algo is met.
Does it Repaint?
Our indicator does NOT re-paint. Although while setting an alert it may pop up the repaint alert, please take into consideration that once a signal is fired on a "CLOSED BAR", our signal will never disappear, they do not repaint.
What Markets is it usable with?
This version is dedicated to FOREX markets, we encourage using it for low timeframes starting the 3 minute to the 15 minute timeframe. WE RECOMMEND USING THIS IN THE FOREX MARKET, ESPECIALLY WITH CURRENCY PAIRS.
How to use:
Simple plug and play it to your chart, in addition to a few other indicators we will recommend to you (we still have not published them yet), and this will confirm your trades. You can also connect TV alerts with a bot and let it run. Please be aware that SLIPPAGE time is important, If you run a bot on this indicator you HAVE to know that the buy/sell price will be on the bar AFTER the Candle close (For example: the BUY/SELL alert is on a candle, the buy/sell your bot or you will execute WILL be in the following candle depending on your trading system. We advise you to not leave the bot to trade on its own, you have to monitor and have a specific syntax that we will help you with creating according to your trading style.
How are the Buy/Sell Alerts fired?
We use the simple ATR (Average True Range) indicator. However we have modified the indicator to serve our trading system. Check below for a definition of what ATR is:
What is Average True Range - ATR?
The average true range (ATR) is a technical analysis indicator that measures market volatility by decomposing the entire range of an asset price for that period. Specifically, ATR is a measure of volatility introduced by market technician J. Welles Wilder Jr. The true range indicator is taken as the greatest of the following: current high less the current low; the absolute value of the current high less the previous close; and the absolute value of the current low less the previous close. The average true range is then a moving average, generally using 14 days, of the true ranges.
Why is our indicator special and different from the normal ATR indicators?
We have modified the mathematical equation and changed it slightly to give more accurate signals, we do not promise all trades are profitable, the use of this indicator is up to your own judgement and liability. We believe that we have an indicator like no other ATR.
P.S: This is not financial advice, we are just sharing our indicator that we know has good results, and it will take time for people in -ve profiles to recover losses and for the profiting to be more profitable. We use a specific trading method that only works with it
You can contact me for more information about the indicator, Goodluck :)
