"bot" için komut dosyalarını ara

SG_Bot_for_TradingSaurabh Goyal Bot for Trading Buy on Buy Blast and Sl on Low , Buy on high with Proper Risk Management and Enjoy

Intenza Trading Technologies - MS Bias + shifts&zonesIntenza MS Bias Indicator - Professional Market Structure Tool
What does this indicator do?
This indicator combines Market Structure, PDH/PDL levels, and BOS/CHoCH detection to give you a clear trading bias and eliminate guesswork in your trading decisions.
Perfect for Martingale EA traders, scalpers, and swing traders who need crystal-clear direction signals.
---
Key Features
🟢 BIAS ZONES (Background Colors)
- Green Zone = STRONG BUY - Trade only long positions
- Red Zone = STRONG SELL - Trade only short positions
- Yellow Zone = NEUTRAL - NO TRADING (ranging market)
Why this matters:
Eliminates 70% of dangerous ranging periods where most traders lose money. Perfect for protecting Martingale strategies from choppy markets.
📈 Market Structure Detection
- HH/HL (Higher Highs/Higher Lows)** = Bullish structure
- LH/LL (Lower Highs/Lower Lows)** = Bearish structure
- Choose **any timeframe** for structure calculation (15M, 1H, 4H recommended)
🔄 BOS & CHoCH Indicators
- BOS (Break of Structure)** = Continuation of current trend
- CHoCH (Change of Character)** = Trend reversal signal
- Fully customizable pivot settings for sensitivity control
📍 Key Levels
- PDH/PDL (Previous Day High/Low) - Daily support/resistance
- PWH/PWL (Previous Week High/Low) - Weekly support/resistance
- Automatic level detection and plotting
🌍 Trading Sessions
- Asia Session (00:00-08:00 UTC)
- London Session (08:00-17:00 UTC)
- NY Session (13:00-22:00 UTC)
- Customizable colors and timezone offset
---
⚙️ Settings Explained
Structure Timeframe
Choose which timeframe to use for Market Structure analysis:
- Leave *empty* = Current chart timeframe
- *15* = 15-minute structure (recommended for 1M-5M charts)
- *60* = 1-hour structure (recommended for 15M-30M charts)
- *240* = 4-hour structure (recommended for 1H+ charts)
💡 Pro tip: Use higher timeframe structure even on lower timeframe charts for cleaner signals!
Bias Mode
Three modes available:
1. PDH/PDL Only (Default)
- Uses daily levels + market structure
- Best for intraday trading
2. Weekly + Daily
- **VERY STRONG** signals when both weekly AND daily align
- **STRONG** signals when only daily aligns
- More conservative, higher quality setups
3. Weekly Only
- Uses weekly levels only
- Best for swing trading
- Fewer but stronger signals
Pivot Left/Right Bars
- Controls BOS/CHoCH detection sensitivity
- **Lower values** (2-3) = More signals, faster detection
- **Higher values** (5-10) = Fewer signals, more reliable
---
📖 How to Use
For Manual Trading:
1. Wait for bias zone (green or red background)
2. Confirm with BOS/CHoCH for entry timing
3. Use PDH/PDL as targets and stop-loss levels
4. Exit when zone turns yellow (neutral)
For EA/Bot Trading:
```
Green Zone → Set EA to BUY mode only
Red Zone → Set EA to SELL mode only
Yellow Zone → Stop EA, close positions, wait
```
Perfect for Martingale EAs - prevents trading in dangerous ranging markets!
---
🎨 Customization
- Toggle BOS/CHoCH - Show only BOS, only CHoCH, or both
- Color themes - Customize all colors to your preference
- Session backgrounds - Show/hide trading sessions
- Level visibility - Toggle PDH/PDL and PWH/PWL independently
---
🔔 Alerts Available
- Strong Buy/Sell Bias activated
- PDH/PDL breaks
- PWH/PWL breaks
- Customizable alert messages
---
💡 Pro Tips
1. Use HTF structure on LTF charts- Set structure to 15M-1H even when trading on 1M
2. Disable what you don't need - Cleaner charts = better decisions
3. Combine bias modes - Start with "PDH/PDL Only", upgrade to "Weekly + Daily" for conservative trading
4. Respect the yellow zone - No trading in neutral = protecting your capital
---
📊 Best Suited For
✅ Scalpers (1M - 15M)
✅ Day traders (15M - 4H)
✅ Martingale EA users
✅ Smart Money traders
✅ Structure-based traders
---
⚠️ Disclaimer
This indicator is a tool to assist in trading decisions. It does not guarantee profits.
Always use proper risk management and test thoroughly on demo accounts before live trading.
---
📞 Support & Updates
For questions, suggestions, or bug reports, please use the comments section below.
© 2025 Intenza Trading Technologies
---
Like this indicator? Please leave a 🌟 rating and boost!

RTI x MA fully backtested by AT A smart trading indicator that combines the strength of the RTI trend and its moving averages with practical trade management. It accurately identifies entry and exit points via the RTI×MA crossover with adjustable sensitivity, and supports DCA reinforcement, dynamic stop-loss, and phased partial take-profit. It plots trade lines in their true length and highlights the entry/partial/reinforcement/stop zones with clear, easy-to-read colors. It includes a detailed performance summary box (profit percentages, average holding, best/worst trade, return on investment, etc.), with ready-made alerts, a demo mode (Close×MA), and dollar pricing for capital management. Suitable for timeframes, bots, and backtesting. Visually simple… Functionally powerful

Webhook Candle Sender (OHLCV)This indicator sends OHLCV (Open, High, Low, Close, Volume) candle data via webhook on every confirmed bar close.
It is designed to integrate TradingView with an external trading or analytics system (e.g. a local Flask server, paper trading engine, or algorithmic agent).
Features:
• Sends data only on bar close (no repainting)
• Works on any symbol (stocks, crypto, forex)
• Works on any timeframe
• Outputs structured JSON suitable for APIs and bots
• Uses TradingView alert() function for webhook delivery
Typical use cases:
• Algorithmic trading research
• Paper trading systems
• Backtesting external strategies
• Educational and learning purposes
This script does NOT place trades, manage risk, or provide trading signals.
It only transmits candle data.
No financial advice is provided.

NQ/MNQ 5min BotThis invite-only strategy is built for traders who want a systematic approach to Nasdaq futures (NQ/MNQ). It combines VWAP (Volume Weighted Average Price), EMA (Exponential Moving Average), and ATR (Average True Range) filters to identify high-probability intraday setups.
🔑 Key Features
Trend Confirmation: Multi-timeframe EMA signals for directional bias.
VWAP Integration: Anchored VWAP zones act as dynamic support/resistance.
ATR-Based Risk Management: Stops and targets adapt to market volatility.
Intraday Focus: Designed for day traders and scalpers in NQ/MNQ futures.
Backtested Logic: Strategy has been optimized with robust historical testing.
✅ Who This Is For
Futures traders looking for consistency on Nasdaq contracts.
Traders who want clear entry and exit rules without second-guessing.
Those seeking scalable risk management that adapts to volatility.

Al Brooks Price Action ProIntroduction
Al Brooks Price Action Pro v4.0 is an institutional-grade Pine Script indicator designed to faithfully implement the price action trading methodology of Al Brooks. This tool translates complex, discretionary concepts from the "Trading Price Action" books (Trends, Ranges, Reversals) into precise algorithmic signals.
The indicator is designed to be a "Head-Up Display" for the serious price action trader. It automates the detection of setups so you can focus on Context and Execution.
--------------------------------------------------------------------------------
Signal Reference Guide (Comprehensive Glossary)
The indicator displays signal labels directly on the chart using short abbreviations. Below is the complete key to understanding every signal.
1. Trend Pullback Signals (The "With-Trend" Entries)
These are the most common signals, designed for entering in the direction of an established trend.
H1 / L1 - High 1 / Low 1 The first pullback in a trend.
H1 (Bull): First time a bar's high goes above the prior bar's high in a bull pullback.
Trigger: Aggressive entry. High failure rate in weak trends.
H2 / L2 - High 2 / Low 2 The Gold Standard. A second attempt to resume the trend after the H1/L1 fails.
Logic: Counter-trend traders (bears in a bull trend) try once (L1) and fail, then try twice (L2) and fail. When they cover their losses, the trend resumes.
H3 / L3 - High 3 / Low 3 Often a wedge bull flag. A third push down in a pullback.
Setup: Acts like a wedge pattern within a trend.
H4 / L4 - High 4 / Low 4 Rare. If a pullback extends this long, the trend might be transitioning to a trading range.
M2B / M2S - MA Two-Legged Pullback M2B (Buy): A two-legged pullback that touches the 20 EMA for the first time.
Logic: "Buy the dip" or "Sell the rally" at the average price. Great for beginners.
20GAB - 20 Gap Bar High Probability. Price has stayed above the EMA for 20+ bars (strong trend), and finally touches it.
Setup: Bears are exhausted trying to reverse the trend for 20 bars. The first touch of moving average usually finds buyers.
BKP - Breakout Pullback Occurs shortly after a strong breakout.
Setup: Price breaks out, pulls back slightly (doesn't retrace deep), and then resumes.
------------------------------------------------------------------------------------
2. Reversal Signals (Counter-Trend)
Patterns that suggest the current trend is ending or reversing.
MTR - Major Trend Reversal Highest Probability Reversal. Requires 4 distinct steps:
Strong Trend
Trend Line Break (momentum loss)
Test of the Extreme (higher high or lower low)
Reversal Signal (the entry)
Logic: The trend structure is broken, and the "Second Leg" trap executes.
WDG - Wedge Three distinct pushes in a trend channel.
Logic: A sustainable trend usually corrects after 3 pushes. A "Rising Wedge" is a bear signal; "Falling Wedge" is a bull signal.
3P - Three Pushes Similar to a wedge, but focuses purely on the "3 drives" pattern in a channel.
V-TOP / V-BOT - V-Top / V-Bottom Violent Reversal. Occurs when a trend accelerates vertically (parabolic) and then violently reverses.
Logic: The "Climax" exhausts all buyers/sellers instantly.
HS - Head & Shoulders Classic reversal pattern.
Logic: Left Shoulder, Head (new extreme), Right Shoulder (lower high/higher low failure).
ET - Expanding Triangle A chaotic pattern of higher highs and lower lows.
Logic: Markets typically reverse after 5 swings in an expanding formation.
TCL - Trend Channel Line Overshoot Price breaks through the trend channel line (overshoots) and reverses.
Logic: An overshoot is a climax. The reversal back into the channel is the trade.
PW - Parabolic Wedge A focused wedge that forms quickly (3-4 bars) often at the end of a climatic move.
FBE - Fade Exhaustion Fade Bear/Bull Exhaustion.
Logic: A massive "Late Acceleration" bar appears after a long trend. The signal is to fade (go against) this move.
FFF - Final Flag Failure A small flag forms late in a trend. The breakout from this flag usually fails and reverses trend.
------------------------------------------------------------------------------------
3. Trading Range & Limit Order Signals
Signals specific to "Buy Low, Sell High" market conditions.
TRF - Trading Range Fade Buy Low / Sell High.
Logic: Detects if market is in a Trading Range. Signal fires only in the top 20% (Sell) or bottom 20% (Buy).
TRF2 - TR Fade 2nd Entry A second attempt to fade the trading range extreme. Higher probability than the first attempt.
LMT - Limit Order Setup Institutional Entry.
Setup: Buying at the low of the prior bar (in a bull trend). Requires conviction that the trend is strong enough to not stop you out.
LMC - Limit Micro Channel Entering on a limit order when a Micro Channel breaks (betting the breakout will fail).
FLG - Final Leg The "Final Leg" of a channel structure within a trading range. Betting on the reversal back to the middle.
--------------------------------------------------------------------------------------
4. Bar Patterns & Micro Structures
Short-term 1-3 bar patterns found on valid signal bars.
2BR - Two Bar Reversal A strong trend bar followed immediately by a strong bar in the opposite direction.
ioi - Inside-Outside-Inside A 3-bar "Breakout Mode" pattern. Price is compressing. Explosive move imminent.
ii / iii - Double Inside Bar Two (or three) consecutive inside bars. Extreme compression. "Coiled spring."
OB - Outside Bar A bar that completely engulfs the previous bar. Often a trap or a reversal.
MDB / MDT - Micro Double Bottom/Top Two consecutive bars with identical (or near identical) lows/highs. A "double bottom" on a 1-bar scale.
DBP / DTP - Double Bottom/Top Pullback A pullback that occurs specifically after a Double Bottom or Top pattern.
SHVD - Shaved Bar A bar with no tail (shaved head/bottom). Indicates extreme urgency/momentum.
FW - Failed Wedge A wedge pattern that broke out but immediately failed and reversed.
MW - Micro Wedge A tiny wedge pattern formed by 3 consecutive bars.
DBF / DTF - Double Bottom/Top Flag A continuation pattern. A flag that looks like a double bottom/top but functions as a trend resumption setup.
BKT - Breakout Test Price breaks a specific level (like a swing high) and comes back to test it perfectly before resuming.
DL - Dueling Lines Confluence. Signal occurs at a zone where multiple support levels (EMA, Trend Line, Prior Low) intersect.
--------------------------------------------------------------------------------------
Dashboard Guide
The glassmorphism dashboard (top-right) gives you a health check of the market. Here is how to read it:
Always-In:
LONG / SHORT: The dominant direction. Stick to signals that match this color.
Neutral: Market is confused/choppy. Stand aside.
Trend:
BULL / BEAR: Clear trending behavior.
RANGE: Market is going sideways. Use TRF signals; ignore H1/H2 trend signals.
Micro Channel:
Bull/Bear: Price is in a "Micro Channel" (4+ bars without a pullback). DO NOT FADE. Wait for the micro channel to break before taking counter-trend trades.
Barbwire:
AVOID: Major warning. The market is in a tight "Barbwire" trading range (dojis, overlapping bars). Most signals here will fail. Stop trading until it clears.
Signal Quality:
0-100% Score: The algorithm's confidence in the last signal.
> 80%: High conviction (Strong trend context, good signal bar, rejection tails).
< 50%: Weak signal (likely into resistance, bad signal bar, counter-trend).
----------------------------------------------------------------------------
Visual Elements Legend
Colors:
Green/Cyan: Bullish elements.
Red/Pink: Bearish elements.
Amber/Orange: Warnings (Traps, Climaxes).
Gray: Neutral contexts.
Markers:
⊘ (H1/L1/H2/L2): TRAP WARNING. This is NOT a signal to enter. It warns you that a standard setup is forming in the wrong context (e.g., selling a Low 1 in a strong Bull Trend).
⚡BC / ⚡SC: Buy/Sell Climax. The market has moved too far, too fast. Expect a pullback or pause.
◈: Trading Range Zone or important Price Action marker.
------------------------------------------------------------------------------------
Strategy "Cheatsheet"
Scenario A: Strong Bull Trend (Green Background / Always-In Long)
Look for: H1, H2, 20GAB, M2B.
Ignore: All Sell signals (MTR, WDG) unless they have "Two Reasons" (double confirmation).
Stop Loss: Below the signal bar low.
Scenario B: Trading Range (Gray Background / Dashboard "RANGE")
Look for: TRF (Trading Range Fade), TRF2.
Strategy: Sell high (red zone), Buy low (green zone).
Quick Profits: Scalp out quickly; do not hold for home runs.
Scenario C: Trend Reversal (Looking for Tops/Bottoms)
Look for: MTR, WDG, V-TOP.
Confirmation: Wait for a strong Signal Bar (good body, closing near extreme).
Trap: Don't short a strong bull trend just because it's "high." Wait for the Double Top or MTR.
--------------------------------------------------------------------------------------
Disclaimer :
This tool assumes you have a basic understanding of Al Brooks' glossary. It aids in real-time identification but does not replace trader discretion. Past performance is not indicative of future results.

Trader HQ - 6min Swing 51% WR2025 Results
51.7% WR on 6min timeframe
This strategy is designed for trend-following momentum trades and performs best on the 6-minute timeframe, where it balances signal quality with frequency.
It combines:
UT Bot ATR trailing stop logic for structural trend detection
ADX strength + rising momentum filter to avoid chop
Higher-timeframe trend confirmation to trade only in favorable market regimes
Long and short entries, aligned with dominant trend conditions
The result is a disciplined, rule-based system that filters out low-quality setups and focuses only on high-probability trend continuations, making it suitable for active swing and intraday traders.
📩 Access:
This strategy is private. To request access, email:
upswingtrading1@gmail.com
Best used on:
6-minute timeframe
Liquid instruments (SPY, QQQ, IWM, index futures, high-volume stocks)

RSI Ladder TP Strategy v1.0 Overview
This strategy is an RSI-based reversal entry system with a ladder-style take-profit mechanism.
It supports Long-only, Short-only, or Both directions and provides optional Average Entry Price, Stop Loss, and Take Profit reference lines on the chart.
Entry Rules
Long Entry: RSI crosses above the Oversold level (default: 20).
Short Entry: RSI crosses below the Overbought level (default: 80).
Optional: If enabled, the script will close the current position when an opposite signal appears before opening a new one.
Exit Rules (Ladder Take Profit)
Take profit is placed as a ladder using tpLevels and tpStepPct.
Example (default tpStepPct = 1%, tpLevels = 10):
TP1 at +1%, TP2 at +2%, … TP10 at +10% (relative to current average entry price).
Each TP level closes tpClosePct of the remaining position, meaning it scales out geometrically:
If tpClosePct = 50% → remaining position becomes 50%, then 25%, then 12.5%, etc.
Stop Loss
Optional stop loss is placed at slPct (%) away from the average entry price:
Long: avg * (1 - slPct%)
Short: avg * (1 + slPct%)
Visual Lines
Average Entry Price Line: current strategy.position_avg_price
Stop Loss Line: based on slPct
Next TP Line: shows the estimated next TP level based on current profit%
All TP Lines: optional (can clutter the chart)
==============================================================
Recommended Use
This strategy is best used on markets with strong mean-reversion behavior.
For exchanges/bots that do not support hedge mode in a single strategy, run two separate instances:
One set to Long Only
One set to Short Only

ZeroDegen Mega Pro Pack v2═══════════════════════════════════════════════════════════════════════════════
ZERODEGEN MEGA PRO PACK v2 — Multi-Mode Trading System
═══════════════════════════════════════════════════════════════════════════════
Professional trading indicator with 11 modes for crypto markets. Clear BUY/SELL signals, real-time market analysis, and institutional-grade filters.
🎯 WHAT IT DOES
Analyzes price action using multi-factor confirmation:
- EMA crossovers (9/21) for trend direction
- RSI momentum filtering
- ADX trend strength validation
- Volume confirmation
- Higher timeframe bias (1H trend filter)
- Institutional concepts: Liquidity sweeps, Fair Value Gaps
Generates clear BUY and SELL signals directly on your chart with a real-time status panel showing all market conditions at a glance.
📊 11 TRADING MODES
SCALP (15m): Standard, Aggressive, Conservative
TREND (1H-4H): Standard, Cloud, Institutional
INSTITUTIONAL: Liquidity Engine
MIXED: Pro, Reversal, Auto Engine, Automation + Confidence
Switch modes with one click to match market conditions.
⚡ KEY FEATURES
✓ Clear visual BUY/SELL/EXIT signals
✓ Real-time status panel with all indicators
✓ Smart filters (Volume, ADX, ATR, Range)
✓ HTF Bias display (1H trend direction)
✓ Institutional Confidence score
✓ Works on any crypto pair
✓ TradingView alert-ready
📈 RECOMMENDED USAGE
Timeframes: 15m (scalp), 1H (swing), 4H (trend)
Markets: BTC, ETH, SOL, and other liquid crypto pairs
🔐 HOW TO GET ACCESS
Visit: xeroc00l.org
- Monthly: $59/mo
- Quarterly: $149 (save 15%)
- Lifetime: $497 (one-time)
After payment, send your TradingView username to zerocool@xeroc00l.org — access granted within 24 hours.
🚀 COMING SOON
We're actively developing additional features including bot integration, automated execution, and a private trading community. Subscribe now and get access to all future updates.
Learn more: xeroc00l.org
⚠️ LEGAL DISCLAIMER
This indicator is provided for educational and entertainment purposes only. It is not financial advice and should not be construed as a recommendation to buy, sell, or hold any cryptocurrency or financial instrument.
Trading cryptocurrencies and leveraged products involves substantial risk of loss and is not suitable for all investors. Past performance is not indicative of future results. You should not trade with money you cannot afford to lose.
The creators of ZeroDegen are not licensed financial advisors, brokers, or dealers. By using this indicator, you acknowledge that all trading decisions are your own responsibility and you agree that ZeroDegen and its creators are not liable for any losses incurred.
Always do your own research and consider consulting a licensed financial professional before making investment decisions.
© 2025 ZeroDegen | For entertainment purposes only

SB A / A++ ALERT ENGINE (Alerts Only)SB A / A++ Alert Engine
Session-Based Level Rejection Strategy (Automation-Ready)
Overview
The SB A / A++ Alert Engine is a rules-based TradingView indicator designed to identify high-probability institutional-style reversal trades using Stacey Burke–inspired concepts such as previous day levels, session structure, opening ranges, and round numbers.
This tool is alerts-only by design, making it ideal for:
TradingView alerts
Webhook automation
Telegram / Discord signal delivery
External trade execution systems
It does not repaint and evaluates signals on confirmed bar close only.
---
Core Trading Idea
Price frequently reacts at important reference levels during active trading sessions.
This script looks for rejection + confirmation at those levels and grades setups based on confluence and candle quality.
Only A-grade and A++-grade setups are alerted.
---
What the Script Detects
📌 Key Levels (Confluence Engine)
Previous Day High / Low
Initial Balance (Mon–Tue range, active Wed–Fri)
Session Opening Range (first hour of London / NY)
Round Numbers (configurable tick spacing)
Each level touched contributes to confluence — without double-counting the same zone.
---
🕒 Session Control
Signals are only allowed during:
London Session
New York Session
Includes:
Session resets
Max alerts per session
Cooldown between signals
---
🔎 Candle Confirmation
Valid signals require clear rejection behavior, such as:
Bullish / Bearish Engulfing candle
Strong Pin Bar (wick ≥ 2× body)
---
🧠 Trade Grades
A Trade
Valid session
ATR percentile filter passed
≥ 1 level of confluence
Directional rejection
A++ Trade
All A-Trade rules
Strong confirmation candle (engulf or pin)
≥ 2 independent confluence zones
Grades are displayed visually and included in alert payloads.
---
📊 Volatility Filter (ATR Percentile)
Instead of fixed ATR thresholds, the script uses an ATR percentile rank, ensuring trades only trigger when volatility is above normal for that market.
This adapts automatically across:
Forex
Indices
Futures
Crypto
---
Visual Output
▲ Green / Lime triangles → LONG (A / A++)
▼ Orange / Red triangles → SHORT (A / A++)
Color intensity reflects trade grade
Optional session shading (if enabled)
---
Alerts & Automation
All alerts are webhook-ready and structured for automation.
Each alert includes:
Symbol
Timeframe
Direction (LONG / SHORT)
Trade grade (A or A++)
Confluence count
Entry price (close of signal bar)
Designed to integrate with:
Telegram bots
Trade execution bridges
Risk management engines
---
What This Script Is (and Is Not)
✅ IS
A high-quality signal engine
Non-repainting
Automation-friendly
Institutional level-based logic
❌ IS NOT
A scalping indicator
A prediction tool
A “trade every candle” system
This tool favors patience, structure, and quality over frequency.
---
Recommended Usage
Timeframes: M5 – M15
Best markets: FX majors, indices, liquid crypto
Combine with your own execution, risk, and trade management rules
---
⚠️ Disclaimer
This script is for educational and informational purposes only. It does not constitute financial advice. Always test on demo or paper trading before using live capital.

Multi-Timeframe ATR PanelThis indicator is designed to summarize information across popular timeframes for one of the most widely used and essential indicators — ATR and ATR% — presented in a table format.
I use it to configure my trading bots when I need to quickly check current values on higher timeframes as well as on my working timeframe (for example, 5 minutes for me).
P.S. This is my first experience creating indicators on TradingView, so please don't judge too harshly. I'm open to constructive feedback
-----------------------------------------------
Данный индикатор предназначен для обобщения информации на популярных тайм фреймах одного из самых популярных и необходимых трейдерам индикаторов ATR и ATR% в виде таблицы.
Я использую его для настройки своих ботов когда необходимо здесь и сейчас узнать значения на старших тайм фреймах и рабочем (мой допустим 5 минут).
P/S Это мой первый опыт создания индикаторов на TradingView если что просьба не судить строго, готов выслушать конструктивную критику


RunRox - Pairs Strategy🧬 Pairs Strategy is a new indicator by RunRox included in our premium subscription.
It is a specialized tool for trading pairs, built around working with two correlated instruments at the same time.
The indicator is designed specifically for pair trading logic: it helps track the relationship between two assets, identify statistical deviations, and generate signals for opening and managing long/short combinations on both legs of the pair.
Below in this description I will go through the core functions of the indicator and the main concepts behind the strategy so you can clearly understand how to apply it in your trading.
📌 CONCEPT
The core idea of pair trading is to find and trade correlated instruments that usually move in a similar way.
When these two assets temporarily diverge from each other, a trading opportunity appears.
In such moments, the relatively overvalued asset is sold (short leg), and the relatively undervalued asset is bought (long leg).
When the spread between them narrows and both instruments revert back toward their typical relationship (mean), the position is closed and the trader captures the profit from this convergence.
In practice, one leg of the pair can end up in a loss while the other generates a larger profit.
Due to the difference in performance between the two assets, the combined result of the pair trade can still be positive.
✅ KEY FEATURES:
2 deviation types (Z-Score and S-Score)
Invert signals mode
Hedge Coefficient (position size balancing between both legs)
6 hedge modes
Entries based on Score or RSI
Extra entries based on Score or Spread
Stop Loss
Take Profit
RSI Filter
RSI Pivot Mode
Built-in Backtester Strategy
Lower Timeframe Backtester Strategy
Live trade panel for current position
Equity curve chart
21 performance metrics in the backtester
2 alert types
*And many more fine-tuning options for pair trading
🔗 SCORE
Score is the core deviation metric between the two assets in the pair.
For example, if you are trading ETHUSDT/BTCUSDT, the indicator analyzes the relationship ETH/BTC, and when one leg temporarily diverges from the other, this difference is reflected in the Score value.
In other words, Score shows how much the current spread between the two instruments deviates from its typical state and is used as the main signal source for pair entries and exits.
In the screenshot above you can see how Score looks in our indicator.
Depending on how large the difference is between the two assets, the Score value can move in a range from −N to +N
When Score is in the −N zone, this is a 🟢 long zone for the first asset and a short zone for the second.
Using the ETH/BTC example: when Score is deeply negative, you open a long on ETH and a short on BTC at the same time, then close both legs when Score returns back to the 0 zone (balance between the two assets).
When Score is in the +N zone, this is a 🔴 short zone for the first asset and a long zone for the second.
In the same ETH/BTC example: when Score is strongly positive, you short ETH and long BTC, and again close both positions when Score comes back to the neutral 0 zone.
☯️ Z/S SCORE
Inside the indicator we added two different formulas for calculating the spread between the two legs of the pair: Z-Score and S-Score.
These approaches measure deviation in different ways and can produce slightly different signals depending on the chosen pair and its behavior.
This allows you to switch between Z-Score and S-Score and choose the method that gives more stable and cleaner signals for your specific instruments.
As you can see in the screenshot above, we used the same pair but applied different Score types to measure the spread and deviation from the norm.
🟣 Z-Score – generated 9 entry signals .
It reacts to price fluctuations more smoothly and usually stays within a range of approximately −8 to +8 .
🟠 S-Score – generated 5 entry signals .
It reacts to price changes more aggressively and produces wider deviations, often reaching −15 to +15 .
This gives traders the choice between a more sensitive but smoother model (Z-Score) and a more selective, stronger-deviation model (S-Score)
⁉️ HOW DOES THE STRATEGY WORK
Here is a basic example of how you can trade this pair trading strategy using our indicator and its signals.
In the classic approach the trade consists of one initial entry and several scale-ins (averaging) if the spread continues to move against the position.
The first entry is opened when Score reaches a standard deviation of −2 or +2.
If price does not revert to the mean and moves further against the position so that Score expands to −3 or +3, the strategy performs the first scale-in.
If Score extends to −4 or +4, a second scale-in is added.
If the spread grows even more and Score reaches −5 or +5, a third scale-in is executed.
In our indicator the number of averaging steps can be up to 4 scale-ins .
After that the position waits until Score returns back to the 0 level , where the whole pair position is closed.
This is the standard model of classical pair trading.
However there are many variations:
using Stop Loss and Take Profit,
exiting earlier or later than the 0 zone,
scaling in not by Score but by Spread, since Score is not linear while Spread is linear,
entering when RSI on both tickers shows opposite extremes, for example RSI 20 on one asset and RSI 80 on the other, and so on.
The number of possible trading styles for this strategy is very large.
We designed the indicator to cover as many of these variations as possible and added flexible tools so you can build your own pair trading logic on top of it.
Below is an example of a classic pair trade with two entries: one main entry and one extra entry (scale-in) .
The pair SUIUSDT / PENGUUSDT shows a high correlation, and on one of the trades the sequence looked like this:
A −2 Score deviation occurred into the long zone and triggered the Main Entry .
🔹 Main Entry
Long SUIUSDT – Margin: 5,000 USD, Entry price: 1.5708
Short PENGUUSDT – Margin: 5,000 USD, Entry price: 0.011793
Price then moved further against the position, Score went deeper into deviation, and the strategy added one extra entry.
🔸 Extra Entry
Long SUIUSDT – Margin: 5,000 USD, Entry price: 1.5938
Short PENGUUSDT – Margin: 5,000 USD, Entry price: 0.012173
The trade was closed when Score reverted back toward the 0 zone (mean reversion of the spread):
❎ Exit
SUIUSDT P&L: −403.34 USD, Exit price: 1.5184
PENGUUSDT P&L: +743.73 USD, Exit price: 0.011089
✅ Total P&L: +340.39 USD
With a total margin of 10,000 USD used per side (20,000 USD combined), this trade yielded around +1.7% on the deployed margin.
On different assets the size and speed of the spread movement will vary, but the principle remains the same.
This is just one example to illustrate how the strategy works in practice using simplified theoretical balances.
⚙️ MAIN SETTINGS
After explaining how the strategy works, we can move to the indicator settings and their logic.
The first block is Main Settings, which controls how the pair is built, how the spread is calculated, and how the backtest is performed.
The core idea of the indicator is to backtest historical data, generate entry signals, show open-position parameters, and provide all necessary metrics for both discretionary and algorithmic trading.
This is a complete framework for analyzing a pair of assets and building a trading system around them. Below I will go through the main parameters one by one.
🔹 Exclude Dates
Allows you to exclude abnormal periods in the pair’s history to remove outlier trades from the backtest.
This is useful when the market experienced extreme news events, listing spikes, or other non-typical situations that distort statistics.
🔹 Pair
Here you select the second asset for your pair.
For example, if your main chart is BTCUSDT, in this field you choose a correlated asset such as ETHUSDT, and the working pair becomes BTCUSDT / ETHUSDT.
The indicator then calculates spread, Score, and all related metrics based on this asset combination.
🔹 Lower Timeframe
This is a special mode for backtesting on a lower timeframe while using a higher timeframe chart to extend the history limit.
For example, if your TradingView plan provides only 5,000 bars of history on the current timeframe, you can switch your chart to a higher timeframe and select a lower timeframe in this setting.
The indicator will then reconstruct the pair logic using up to 99,000 bars of lower timeframe data for backtesting.
This allows you to test the pair on a much longer historical period and find more stable combinations of assets.
🔹 Method
Here you choose which deviation model you want to use: Z-Score or S-Score.
Both methods calculate spread deviation but use different formulas, which can give different signal behavior depending on the pair.
Examples of these two methods are shown earlier in this description.
🔹 Period
This parameter defines how many bars are used to calculate the average deviation for the pair.
If you set Period = 300, the indicator looks back 300 bars and calculates the typical spread deviation over that window.
For example, if the average deviation over 300 bars is around 1%, then a move to 2% or more will push Z/S Score closer to its boundary levels, since such a deviation is considered abnormal for that lookback period.
A larger Period means that only bigger deviations will be treated as anomalies.
A smaller Period makes the model more sensitive and treats smaller deviations as anomalies.
This allows you to tune how aggressive or conservative your pair trading signals should be.
🔹 Invert
This setting is used for negatively correlated pairs.
Some instruments have a positive correlation in the range from +0.8 to +1.0 (strong positive correlation), while others show a negative correlation from −0.8 to −1.0, meaning they usually move in opposite directions.
A classic example is the pair EURUSD and DXY.
As shown in the screenshot above, these instruments often have strong negative correlation due to macro factors and typically move in opposite directions: when EURUSD is rising, DXY is falling, and vice versa.
Such pairs can also be traded with our indicator.
To do this, we use the Invert option, which effectively flips one of the assets (as shown in the screenshot below). After inversion, both instruments are brought to a “same-direction” behavior from the model’s point of view.
From there, you trade the pair in the same way as a positively correlated one:
you open both legs in the same direction (both long or both short) depending on the spread and Score, and then wait for the spread between the inverted pair to converge back toward its mean.
🔀 HEDGE COEFFICIENT
The next block of settings is related to the hedge coefficient.
This defines how much margin is allocated to each leg of the pair.
The classic approach in pair trading is to split the position equally between both assets.
For example, if you allocate 100 USD to a trade , the standard model would open 50 USD long on one asset and 50 USD short on the other.
This works well for pairs with similar volatility , such as BTCUSDT / ETHUSDT
However, if you use a pair like BTCUSDT / DOGEUSDT , the volatility of these assets is very different.
They can still be correlated, but their amplitude is not the same. While Bitcoin might move 2% , Dogecoin can move 10% over the same period.
Because of that, for pairs with strongly different volatility, we can use a hedge coefficient and, for example, enter with 30 USD on one leg and 70 USD on the other, taking the volatility difference into account.
This is the main idea behind the Hedge Coefficient section and its primary use.
The indicator includes 6 methods of calculating the coefficient:
Cumulative RMA
Beta OLS
Beta TLS
Beta EMA
RMA Range
RMA Delta
Each method uses a different formula to compute the hedge coefficient and to size the position based on different metrics of the assets.
We leave it to the trader to decide which algorithm works best for their specific pair and style.
Below are the settings inside this section:
🔹 Method
When Auto Hedge is enabled, you can select which method to use from the list above.
The chosen method will automatically calculate the hedge coefficient between the two legs.
🔹 Hedge Coefficient
This is the manual hedge ratio per trade when Auto Hedge is disabled.
By default it is set to 1, which means the position is opened 50/50 between the two assets.
🔹 Min Allowed Hedge Coef.
This is the minimum allowed hedge coefficient.
By default it is 0.2, which means the model will not go below a 20% / 80% split between the legs.
🔹 MA Length
For methods that use moving averages (for example Beta EMA), this parameter sets the period used to calculate the hedge coefficient.
🛠️ STRATEGY SETTINGS
The next important block is Strategy Settings .
Here you define the core parameters used for backtesting: trading commission, position size, entry / exit logic, Stop Loss, Take Profit, and other rules that describe how you want the strategy to operate.
Below are all parameters with a detailed explanation.
🔸 Commission %
In this field you set your broker’s fee percentage per trade .
The indicator automatically calculates the correct commission for each leg of every trade. You only need to input the real commission rate that your broker charges for volume. No additional manual calculations are required.
🔸 Main Entry Mode
There are two options for the main entry:
Score - This is the primary entry method based on Z/S Score.
When Score reaches the deviation level defined in the settings below, the strategy opens the first position.
For example, if you set “Entry at 2 deviations”, the trade will be opened when Score hits ±2.
RSI Only - Alternative entry method based on RSI divergence between the two assets.
The exact RSI levels are defined in the RSI settings section below.
For example, if you set the entry threshold at 30, then when one asset has RSI below 30 and the second one has RSI above 70, the first entry will be triggered.
🔸 Extra Entries Mode
This defines how scale-ins (averaging) are executed. There are two modes:
Score - Works the same way as the main entry, but for additional entries.
For example, the main entry can be at 2 deviations, the first scale-in at 3, the second at 4, etc.
Spread - This mode uses the Spread (difference between the two assets) starting from the main entry moment.
As the spread continues to widen, the strategy can add extra entries based on spread growth rather than Score.
Since Score is a non-linear metric and Spread is linear, in some configurations averaging by Spread can produce better results than averaging by Score. This is pair- and strategy-dependent. 🔸 Entry parameters
Deviation / Spread threshold
Entry size
Main Entry – first field (deviation / spread), second field (position size)
Entry 2 – first field (deviation / spread), second field (position size)
Entry 3 – first field (deviation / spread), second field (position size)
Entry 4 – first field (deviation / spread), second field (position size)
This allows you to define up to four scaling steps with different triggers and different sizing.
🔸 Exit Level
This parameter defines at what Score level you want to exit the trade.
By default it is 0, which means the backtester closes the position when Score returns to the neutral (0) zone.
You can also use positive or negative values. Example:
Assume your main entry is configured at a 3 deviation.
You can exit at the 0 level, or you can set Exit Level = 2.
If your initial entry was at −3, the position will be closed when Score reaches +2.
If your initial entry was at +3, the position will be closed when Score reaches −2.
This approach can increase the profit per trade due to a larger captured spread, but it may also increase the holding time of the position.
🔸 Stop Loss
Here you define the maximum loss per trade in PnL units.
If a trade reaches the negative PnL value specified in this field and the Stop Loss option is enabled, the indicator will close the trade at a loss.
The Cooldown parameter sets a pause after a losing trade:
the strategy will wait a specified number of bars before opening the next trade.
🔸 Take Profit
Works similar to Stop Loss but for profit targets.
You set the desired PnL value you want to reach.
The trade will be closed when either the Take Profit target is hit or when Score reaches the exit level defined in the settings, whichever occurs first (depending on your configuration).
🔸 Show Qty in currency
When enabled, trade size is displayed in currency (USD) instead of token quantity.
This is useful for quickly understanding position size in monetary terms.
You will see this in the Current Trade panel, which is described later.
🔸 Size Rounding
Controls how many decimal places are used when rounding position size (from 0 to 10 digits after the decimal).
This is also used for the Current Trade panel so you can adjust how detailed or compact the size display should be.
📊 RSI FILTERS
This section is used for additional trade filtering.
RSI can be used in two ways:
as a primary entry signal,
or as an extra filter for entries based on Z/S Score.
If in the Strategy Settings the Main Entry Mode is set to RSI, then RSI becomes the main trigger for opening a position.
In this case a trade is opened when the RSI of the two assets reaches opposite zones.
Example:
If the threshold is set to 30, then:
when one asset has RSI below 30, and
the second asset has RSI above 70 (100 − 30),
the strategy opens the first entry.
All extra entries after that will be executed either by Spread or by Z/S Score, depending on your Extra Entries Mode.
Below are the parameters in this block:
RSI Length – standard RSI period setting.
RSI Pivot Mode – when enabled, RSI is used as an additional filter together with Z/S Score. The indicator looks for a reversal pattern on RSI (pivot behavior). If RSI forms a reversal structure, the trade is allowed to open. If not, the signal is skipped until a proper RSI pivot is formed.
Entry RSI Filter – here you define the RSI thresholds used for RSI-based entries. These are the same boundary levels described in the example above.
Overall, this section helps filter out lower-quality trades using additional RSI conditions or lets you build RSI-only entry logic based on extreme levels.
🎨 MAIN CHART STYLING
This section controls the visual appearance of trades on the main chart.
You can customize how the second asset line is drawn, as well as the icons for entries, scale-ins, and exits, including their size and style.
▫️ Price Line
This is the line that shows the price of the second asset and the relative difference between the two instruments.
You can adjust the line thickness and color to make it more readable on your chart.
▫️ Adjust Price Line by Hedge Coefficient
When this option is enabled, the second asset’s line is normalized by the hedge coefficient.
If you turn it off, the hedge coefficient will not be applied to the second asset’s line, and it will be displayed in raw form.
▫️ Entry Label
Here you can customize how the entry markers look:
choose the color, icon style, and size of the label that marks each trade entry and scale-in on the chart.
▫️ Exit Label
Similarly, you can define the color, icon style, and size of the label used for exits.
This helps visually separate entries and exits and makes it easier to read the trade history directly from the chart.
🎯 INDICATOR PANEL
This section controls the settings of the indicator panel, which works like an oscillator and allows you to visualize multiple metrics in one place.
You can flexibly enable, style, and scale each parameter.
🔹 Score
Displays the main deviation metric between the two assets.
You can customize the color and line thickness of the Score plot.
🔹 Spread
Shows the spread between the two assets.
It starts calculating from the moment the trade is opened.
You can adjust its color and thickness for better visibility.
🔹 Total Profit
Displays the cumulative profit for this pair and strategy as a line that grows (or falls) over time.
Color, opacity, and line thickness can be customized.
🔹 Unrealized PNL
Once a trade is opened, this line shows the current PnL of the active position.
It also lets you see historical drawdowns on the pair.
Color and thickness can be adjusted.
🔹 Released PNL
Shows the realized PnL of each closed trade as bars.
Useful for quickly evaluating the result of every individual trade in the backtest.
🔹 Correlation
Plots the correlation coefficient between the two assets as a graph, so you can visually track how stable or unstable the relationship between them is over time.
🔹 Hedge Coefficient
Shows the hedge coefficient as a line, which helps understand how the model is rebalancing exposure between the two legs depending on their behavior.
For each metric there is also a 📎 Stretch option.
Stretch allows you to compress or expand the scale of a specific line to visually align metrics with different ranges on the same panel and make the chart easier to read.
📈 PROFIT CHART
Since TradingView does not natively support proper backtesting for pair trading, this indicator includes its own profit curve for the pair.
You can visually see how the strategy performed over historical data: whether there were deep drawdowns, abnormal profit spikes, or stable equity growth over time. This makes it much easier to evaluate the quality of the pair and the strategy on history.
In the settings of this section you can flexibly customize how the profit chart is displayed:
labels, position of the panel, padding, and other visual details.
Everything depends on your personal preferences, so we give full control over styling:
you can adjust the look of the profit chart to match your layout or completely hide it from the chart if you do not need it.
📌 CURRENT TRADE
This section controls the current trade table.
When there is an active trade on the chart, the panel displays all key information for the open position:
direction for each ticker (long or short),
required position size for each leg,
entry price for both assets,
and real-time PnL for each leg separately,
so you always have a clear view of the current situation.
The main thing you can do with this table is customize its appearance:
you can change the size, position on the chart, background and text colors, as well as separate coloring for positive / negative PnL and different colors for long and short positions.
📅 BACKTEST RESULTS
The next key block is Backtest Results.
This results table with detailed metrics gives you an extended view of how the pair and strategy perform: win rate, profit factor, long/short breakdown, and more than 20 additional stats that help you evaluate the potential of your setup.
⚠️ First of all, it is important to note ⚠️
past performance does not guarantee future results.
Every trader must keep this in mind and factor these risks into their strategy.
The table shows metrics in three cuts:
All Entries
Main Entries
Extra Entries (scale-ins)
Core metrics:
Profit – total profit for each entry type.
Winrate – win rate for this pair.
Profit Factor – ratio of gross profit to gross loss for the strategy.
Trades – number of trades in the backtest.
Wins – number of winning trades.
Losses – number of losing trades.
Long Profit – profit generated by long positions.
Short Profit – profit generated by short positions.
Longs – total number of long trades.
Shorts – total number of short trades.
Avg. Time – average time spent in a trade.
Additional metrics for a deeper evaluation of the pair:
Correlation – current correlation between the two assets in the pair.
Bars Processed – number of bars used in the analysis.
Max Drawdown – maximum historical drawdown of the strategy.
Biggest Loss – the largest single losing trade in the backtest.
Recommended Hedge – recommended hedge coefficient based on historical behavior.
Max Spread – maximum positive spread observed in history.
Min Spread – maximum negative spread observed in history.
Avg. Max Spread – average of positive extreme spread values (above 0).
Avg. Min Spread – average of negative extreme spread values (below 0).
Avg Positive Spread – average positive spread across all trades (only values above 0).
Avg Negative Spread – average negative spread across all trades (only values below 0).
Current Spread – current spread between the assets when a trade is open.
These metrics together allow you to quickly assess how stable the pair is, how the risk/return profile looks, and whether the strategy parameters are suitable for live trading. You can fully customize this results table to fit your workflow:
hide metrics you don’t need, change colors, opacity, and other visual styles, and reorder the focus of the stats according to your trading style.
This way the backtest block can show only the metrics that matter to you most and remain clean and readable during analysis.
📣 ALERTS
The next section is dedicated to alerts.
Here you can configure all signals you need, both for manual trading and for full automation of this pair trading strategy. This block is designed to cover most practical use cases. The indicator supports two alert modes:
Single Alert – one universal custom alert for all events.
Two Alerts – separate alerts for each ticker so you can receive different messages per asset.
Available alert events:
Main Entry – when the main entry is triggered.
Entry 2 – when the first scale-in is executed.
Entry 3 – when the second scale-in is executed.
Entry 4 – when the third scale-in is executed.
Exit Alert – when the position is closed.
StopLoss Alert – when Stop Loss is hit.
TakeProfit Alert – when Take Profit is hit.
All alerts are fully customizable and support a set of placeholders for building structured messages or JSON payloads.
🔹1 Alert Type
List of supported placeholders: {{event}} – trigger name ('Entry 1', 'Exit').
{{dir_1}} – 'Long' or 'Short' for the main ticker.
{{dir_2}} – 'Long' or 'Short' for the other ticker.
{{action_1}} – 'Buy', 'Sell' or 'Close' for the main ticker.
{{action_2}} – 'Buy', 'Sell' or 'Close' for the other ticker.
{{price_1}} – price for the main ticker.
{{price_2}} – price for the other ticker.
{{qty_1}} – order size for the main ticker.
{{qty_2}} – order size for the other ticker.
{{ticker_1}} – main ticker (e.g. 'BTCUSD').
{{ticker_2}} – other ticker (e.g. 'ETHUSD').
{{time}} – candle open time in UTC.
{{timenow}} – signal time in UTC.
🔹2 Alert Type
List of supported placeholders: {{event}} – trigger name ('Entry 1', 'Exit', 'SL', 'TP').
{{action}} – 'Buy', 'Sell' or 'Close'.
{{price}} – order price.
{{qty}} – order size.
{{ticker}} – ticker (e.g. 'BTCUSD').
{{time}} – candle open time in UTC.
{{timenow}} – signal time in UTC. You can use these placeholders to build any JSON structure or custom alert text required by your trading bot, exchange API, or automation service.
In this post I’ve explained how the indicator works, the core concept behind this pair trading strategy, and shown practical examples of trades together with a detailed breakdown of each unique feature inside the tool.
We have invested a lot of work into building this indicator and we truly hope it will help you trade pair strategies more efficiently and more profitably by giving you structured, strategy-specific information that is difficult to obtain in any other way.
⚠️ Please also remember that past performance does not guarantee future results.
Always evaluate the risks, the robustness of your setup, and your own risk tolerance before entering any position, and make independent, well-considered decisions when using this or any other strategy.

AlgosPoint G&MPoint Breaking 2025 (MB&GB Breaking Point Pro)
What It Does:
A comprehensive TradingView indicator that combines multiple technical analysis tools to identify key market breakout points, support/resistance levels, and trading opportunities. It integrates Volume Profile analysis, AlphaTrend signals, and custom risk assessment metrics.
Key Features:
Volume Profile Analysis: Displays Point of Control (POC), Value Area High/Low (VAH/VAL), and volume distribution
Support & Resistance Detection: Automatically identifies key price levels based on volume or price action
AlphaTrend Signals: Generates BUY/SELL signals with visual labels on chart
Volume Spike Detection: Highlights unusual volume activity indicating potential exhaustion or breakout
High Volatility Alerts: Marks periods of increased market volatility using ATR
Risk Assessment Dashboard: Real-time panel showing:
Long/Short percentages (RSI-based)
Stop levels for both directions
Bot activity percentage
Csocy Signal status (Safe/Undecided/Risky)
How to Use:
Add to Chart: Apply indicator to any timeframe (works best on 15m-4H)
Configure Settings: Adjust parameters in grouped sections:
📊 General Settings (lookback periods)
🎯 Support & Resistance (line styles/colors)
💥 Volume Spike (threshold sensitivity)
⚡ High Volatility (ATR multiplier)
📈 Volume Profile (display options)
🔥 AlphaTrend (signal sensitivity)
Read Signals:
BUY label = Potential long entry when AlphaTrend crosses up
SELL label = Potential short entry when AlphaTrend crosses down
Dashboard colors: Green = bullish, Red = bearish, Yellow = neutral
Set Alerts: Built-in alerts for price crosses, volume spikes, and signal confirmations
Risk Management: Use displayed stop levels and Csocy Signal status to manage position sizing
Best For:
Day traders and swing traders
Crypto, Forex, and Stock markets
Identifying high-probability breakout zones
Volume-based trading strategies

Backtest any Indicator [Target Mode] StrategyUniversal Backtester Strategy with Sequential Logic
This strategy serves as a highly versatile, universal backtesting engine designed to test virtually any indicator-based trading system without requiring custom code for every new idea. It transforms standard indicator comparisons into a robust trading strategy with advanced features like sequential entry steps, dynamic target modes, and automated webhook alerts.
The core philosophy of this script is flexibility. Whether you are testing simple crossovers (e.g., MA Cross) or complex multi-stage setups (e.g., RSI overbought followed by a MACD flip), this tool allows you to configure logic via the settings panel and immediately see backtested results with professional-grade risk management.
Core Logic: Source vs. Target Mode
The fundamental building block of this strategy is the "Comparator" engine. Instead of hard-coding specific indicators, the script allows users to define logic slots (L1-L5 for Longs, S1-S5 for Shorts).
Each slot operates on a flexible comparison logic:
Source: The primary indicator you are testing (e.g., Close Price, RSI, Volume).
Operator: The condition to check (Equal/Cross, Greater Than, Less Than).
Target Mode:
Value Mode: Compares the Source against a fixed number (e.g., RSI > 70).
Source Mode: Compares the Source against another dynamic indicator (e.g., Close > SMA 200).
This "Target Mode" switch allows the strategy to adapt to almost any technical analysis concept, from oscillator levels to moving average trends.
Advanced Entry System: Sequential Steps (1-5)
Unlike standard backtesters that usually require all conditions to happen simultaneously (AND logic), this strategy implements a State Machine for sequential execution. Each of the 5 entry slots (L1-L5 / S1-S5) is assigned a "Step" number.
The logic flows as follows:
Stage 1: The strategy waits for all conditions assigned to "Step 1" to be true.
Latch & Wait: Once Step 1 is met, the strategy "remembers" this and advances to Stage 2. It waits for a subsequent bar to satisfy Step 2 conditions.
Trigger: The actual trade entry is only executed once the highest assigned step is completed.
Example Use Case:
Step 1: Price closes below the Lower Bollinger Band (Dip).
Step 2: RSI crosses back above 30 (Confirmation).
Execution: Buy Signal triggers on the Step 2 confirmation candle.
This creates a realistic "Setup -> Trigger" workflow common in professional trading, preventing premature entries.
Exit Logic & Risk Management
The strategy employs a dual-layer exit system to maximize profit retention and protect capital.
1. Signal-Based Exits (OR Logic) There are 5 configurable exit slots (LX1-LX5 / SX1-SX5). Unlike entries, these operate on "OR" logic. If any enabled exit condition is met (e.g., RSI becomes overbought OR Price crosses below EMA), the position is closed immediately.
2. Hard Stop & Take Profit
Fixed %: Users can set a hard percentage-based Stop Loss and Take Profit.
Trailing Stop: A toggleable "Trailing?" feature allows the Stop Loss to dynamically trail the price.
Longs: The SL moves up as the price makes new highs.
Shorts: The SL moves down as the price makes new lows.
Automated Alerts & Webhooks
This script is built with automation in mind. It includes a dedicated makeJson() function that constructs a JSON payload compatible with most trading bots (e.g., 3Commas, TradersPost, Tealstreet).
Alert Modes Supported: | Alert Type | Description | | :--- | :--- | | Order Fills Only | Triggers standard TradingView strategy alerts when the broker emulator fills an order. | | Alert() Function | Triggers specific JSON payloads defined in the code ("action": "buy", "ticker": "MNQ", etc.). |
The script automatically calculates the alert quantity based on your equity percentage settings, ensuring the payload matches your backtest sizing.
Dashboard & Visuals
To aid in rapid analysis, the strategy includes visual tools directly on the chart:
Performance Table: A dashboard (top-right) displays real-time stats including Net Profit, Win Rate, Profit Factor, and Max Drawdown.
Trade Markers: Custom labels (goLong, exLong) show exactly where trades opened and closed, including the trade number and profit percentage.
SL/TP Visualization: Dynamic step-lines (Orange for SL, Lime for TP) show exactly where your protection levels are sitting, helping you visually verify if your stops are too tight or too loose.

ALFA BUY IndikatorThis indicator is an improved version of the Mucip + Yağız indicator. I have been using it smoothly for the past 3 months.
I use it on futures markets for the three major coins such as BNB/USDT, BTC/USDT, and ETH/USDT.
My usage logic is as follows: on average, it generates around 2 signals per coin per day.
For each trade, I enter positions using 4–5% of my total capital.
I use 25x leverage on ETH and BNB, and 50x leverage on BTC.
My take-profit levels are 0.25% for BTC and 0.5% for the others, which results in approximately 10–12% profit per trade.
Overall, the average daily capital growth is around 2–3%.
Note: I use a trading bot for executions, because the indicator is designed for 2-minute charts, and it is almost impossible to catch the signals manually.
So far, everything has been working flawlessly, and it performs best on 2-minute timeframes.

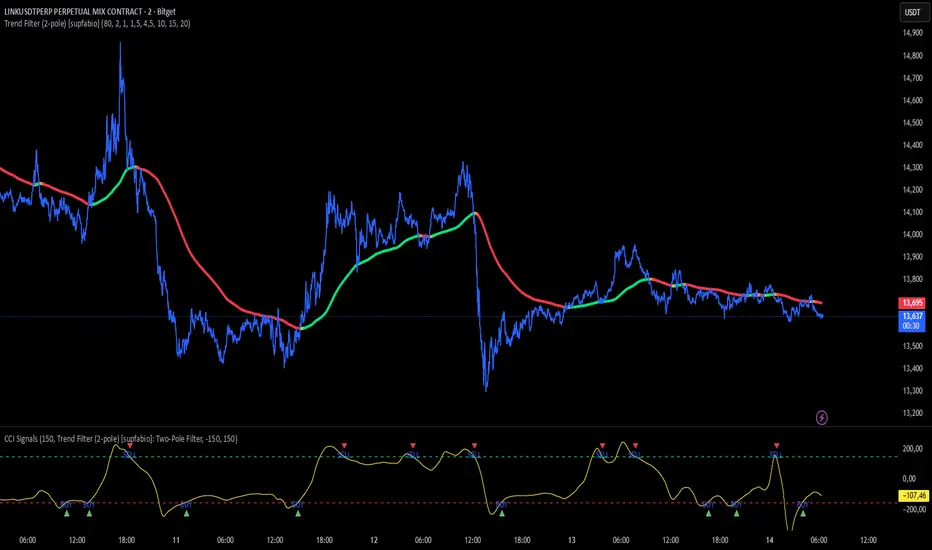
Supfabio Break-Return BandsSupfabio Break-Return Bands (B3 & B4 • 3-Candle Confirmation)
Supfabio Break-Return Bands is a volatility-based price action indicator built on top of a Two-Pole smoothing filter combined with ATR-derived dynamic bands.
It is designed to highlight price exhaustion, rejection, and potential reversal zones, with a strong emphasis on structural confirmation rather than immediate breakouts.
Core Concept
The indicator plots four volatility bands (Band 1 to Band 4) above and below a smoothed Two-Pole filter.
Signals are intentionally restricted to the outer bands, where price behavior is statistically more likely to show:
Volatility expansion
Liquidity grabs (stop runs / false breaks)
Strong rejection or mean-reversion behavior
Signal Logic
Band 4 (Primary Extreme Zone)
BUY and SELL signals are generated when:
Initial trigger (first candle)
Price either crosses the Band 4 level or
Touches and rejects the band (wick / pin behavior)
Confirmation on the 3rd candle (t + 2)
The confirmation candle:
Must not touch the same band again
Must close on the correct side of the band
Confirms that the initial break or pin was rejected
This delayed confirmation helps filter false breakouts and impulsive entries.
Band 3 (Secondary Setup)
On Band 3, signals are intentionally more selective:
Pin / rejection only
No direct cross signals
Uses the same 3-candle confirmation logic
This allows Band 3 signals to act as deeper pullback or early exhaustion setups.
Confirmation Mechanism
The script uses an internal state-based logic to:
Track the exact bar where the trigger occurred
Confirm signals only on the correct third candle
Prevent duplicate or consecutive signals from the same setup
Ensure pin-based triggers are not missed
Visual Elements
Main Two-Pole filter plotted as a thick continuous line
Volatility bands plotted with progressive line thickness
Band line styles (dotted / dashed) can be customized manually in the Style tab
Clear BUY and SELL labels plotted directly on the confirmation candle
Optional candle coloring based on filter direction
Alerts & Automation
Built-in alertcondition() for BUY and SELL
Alerts are suitable for webhook automation
Compatible with external systems and trading bots
Intended Use
This indicator is suitable for:
Reversal and exhaustion analysis
Mean-reversion strategies
Liquidity and rejection-based setups
Manual trading or automated execution
Intraday and higher-timeframe analysis
Notes
This script is intended as an analytical tool, not as a standalone trading system.
Signals should be used in combination with market structure, trend context, and proper risk management.

CCI + Buy/Sell Cross (supfabio)This indicator is an enhanced version of the Commodity Channel Index (CCI) designed to generate clear BUY and SELL signals based on customizable level crossovers, with built-in support for webhook automation and external trade execution.
🔹 Signal Logic
BUY Signal:
Triggered when the CCI crosses upward (from below to above) the user-defined BUY level (red line).
SELL Signal:
Triggered when the CCI crosses downward (from above to below) the user-defined SELL level (green line).
Signals can optionally be configured to trigger only on candle close, reducing real-time noise and false signals.
🔹 Key Features
✅ Original CCI calculation (standard formula preserved)
✅ Fully configurable BUY and SELL levels
✅ Optional display of signal level lines
✅ Visual BUY / SELL markers plotted on the CCI panel
✅ Support for moving average smoothing and Bollinger Bands applied to the CCI
✅ Dynamic alerts using alert(), ideal for:
Webhook integrations
Trading bots
External servers and automated execution systems
🔹 Alerts & Webhook Integration
The indicator sends dynamic alert messages containing:
Action type (BUY / SELL)
Symbol
Closing price
Timestamp
To use:
Add the indicator to your chart
Create an alert and select “Any alert() function call”
Enable Webhook URL and configure your endpoint
Done — signals will be sent automatically
🔹 Best Use Cases
Traders who use CCI as a primary entry trigger
Momentum or mean-reversion strategies
Automated trading systems
Visual backtesting and signal validation
⚠️ Disclaimer
This indicator is not a complete trading system and does not replace proper risk management. Always use it in combination with market context, confirmation tools, and sound position sizing.
Smart Money Bot [MTF Confluence Edition]Uses multi-time frame analysis and supply and demand strategy.
Best used when swing trading.

Star V12⭐ Star Engine — Multi-Component, Multi-Timeframe Trade Execution System
The Star Engine is a stateful trade execution and analytics system designed to transform indicator confluence into structured, measurable trade runs. Rather than producing isolated buy/sell signals, the engine decomposes market behavior into pressure, confirmation, event grouping, and trade lifecycle management. Each component plays a specific role, and no single component is sufficient on its own. Below is a detailed breakdown of each subsystem and why it exists.
💣 Bomb Engine — Directional Pressure Measurement
The Bomb Engine is responsible for identifying directional pressure in the market. It evaluates whether price action exhibits sustained momentum in one direction, independent of whether that direction is immediately tradable.
What Bomb Uses
Bomb aggregates momentum- and trend-oriented inputs such as MACD-based momentum direction, momentum persistence and continuation logic, directional bias filters, and impulse strength evaluation. All inputs are evaluated across multiple timeframes, with each timeframe contributing independently.
How Bomb Works
Each timeframe produces a directional contribution (bullish, bearish, or neutral). Contributions are aggregated into a net Bomb total. The total is mapped into discrete tone buckets (blue, green, red, black, etc.). Higher totals indicate stronger directional dominance.
What Bomb Tells You
Bomb answers one question: Is there directional pressure building or persisting? It does not determine entry timing, exhaustion, or trade quality. Bomb is context, not execution. This allows Bomb to be early without being responsible for precision.
✨ Golden Engine — Structural Confirmation & Regime Filtering
The Golden Engine evaluates whether the directional pressure detected by Bomb is structurally supported. Golden exists to prevent entries during momentum exhaustion, conflicting timeframe regimes, and counter-structure moves.
What Golden Uses
Golden relies on a different indicator stack than Bomb, focused on confirmation and balance, including RSI regime classification (not simple overbought/oversold), momentum agreement vs divergence, trend-following vs counter-trend positioning, overextension detection, and compression and rotational behavior. Each timeframe is evaluated independently using the same logic.
The Role of RSI in Golden
RSI in Golden is used to identify regimes, not signals. It answers questions such as: Is momentum expanding or decaying? Is the move early, mid-structure, or extended? Do multiple timeframes share compatible RSI states? If RSI regimes conflict across timeframes, Golden will not confirm. This is one of the main mechanisms that makes Golden selective.
Momentum & Alignment Logic
Golden evaluates whether momentum supports continuation, is fragmenting, is diverging from price, or is contradicting higher-timeframe structure. If lower-timeframe impulses are not supported by higher-timeframe structure, Golden suppresses confirmation — even if Bomb remains strong.
What Golden Guarantees
Golden does not guarantee profitable trades. Golden guarantees that the detected directional pressure is not internally contradictory across RSI regimes, momentum behavior, and timeframe structure. This replaces vague terms like “clean” with explicit structural conditions.
🔗 Multi-Timeframe Aggregation (MTF)
Both Bomb and Golden operate on a multi-timeframe voting system. Lower timeframes capture early impulses, higher timeframes enforce structural context, each timeframe votes independently, conflicts weaken totals, and alignment strengthens totals. This creates temporal confluence, not just price-based confluence.
⭐ Star Events — Qualified Market Impulses
A Star (⭐) is created only when Bomb is active, Golden is active, both agree on direction, and all gating rules pass (thresholds, time filters, modes). A Star represents a qualified impulse, not a trade. Stars are atomic events used by the execution layer.
⏱ Star Clusters — Trade Run State
The Star Cluster groups Stars into runs. The first Star starts a cluster, anchor price, bar, and time are recorded, each additional Star increments the cluster count, and all Stars belong to the same run until exit. This prevents duplicate entries, signal spam, and overtrading in volatile conditions.
⛔ Reset Gap Logic — Temporal Control
To prevent rapid re-entry, a minimum time gap is required to start a new run. Stars occurring too close together are merged. Reset does not terminate active runs. This enforces time-based discipline, not indicator-based guessing.
1➡️ Entry Logic — Confirmation-Based Execution
The engine never enters on the first Star. Instead, the user defines 🔢 N (Entry Star Index). Entry occurs only on the Nth Star, and that bar is marked 1➡️🔢N. This ensures entries occur after persistence, not detection. At ENTRY, Best = 0.00 and Worst = 0.00. Statistics measure real trade performance, not early signal noise.
📊 STAT Engine — Live Trade Measurement
Once entry is active, the STAT engine tracks ⏱ run progression, 🏅 maximum favorable excursion, and 📉 maximum adverse excursion. Mechanics: uses highs and lows, not closes; updates every bar; entry bar resets stats; historical bars marked 🎨. This creates an objective performance envelope for every trade.
🛑 Exit Engine — Deterministic Outcomes
Trades are exited using explicit rules: 🏅 WIN → profit threshold reached, 📉 LOSE → risk threshold breached, ⏱ QUIT → structural or safety exit.
Safety Exits
🐢 Idle Stop — no Stars for N bars.
🧯 Freeze Failsafe — STAT inactivity.
QUIT is a controlled termination, not failure. Each exit is recorded with a short cause tag.
🧾 Trade Memory & Journaling
Every trade produces immutable records. Entry: time, price, side, confirmation index. Exit: time, price, PnL, result, cause. These records power tables, alerts, JSON output, and external automation.
📊 Time-Block Performance (NY Clock)
Performance is grouped by real time, not bar count. Rolling NY blocks (e.g. 3 hours). Independent statistics per block. Live trades persist across block boundaries. This enables session-based analysis.
🔔 Alerts & Automation
Alerts are state-based: Entry confirmed → Long / Short alert. Trade closed → Exit alert. Optional JSON output allows integration with bots, journals, and dashboards.
Summary
The Star Engine is a component-based trade execution system, where Bomb measures pressure, Golden validates structure, Stars qualify impulses, clusters define runs, entry is delayed by confirmation, stats measure reality, exits are deterministic, and results are time-aware. It is not designed to “predict the market”, but to control how trades are formed, managed, and evaluated.

Kairos QX Indicator [v1.7]What’s New in v1.7?
Streak Analytics (Dashboard Expansion):
The dashboard now tracks Winning and Losing Streaks.
Max Consec. (TP / SL): Displays the highest number of wins and losses that occurred in a row (e.g., 5 / 3).
Avg Consec. (TP / SL): Calculates the average length of your winning and losing streaks (e.g., 2.4 / 1.8).
Updated Default "settings" for MNQ 5 MIN Candles
Full Script Description
This script is a professional-grade Mean Reversion & Trend Following Engine designed for automated execution. It acts as a bridge between discretionary chart analysis and algorithmic trading, allowing you to backtest complex ideas visually and then automate them via alerts without writing code.
1. Core Logic: The "Flip Switch" Strategy
Standard Mode (Mean Reversion):
The script identifies "exhaustion" points where price pierces the Bollinger Bands.
It bets on a reversal (e.g., Price > Upper Band = Short).
Inverse Mode (Trend Following - Default):
With the "Inverse Trades" box checked, the logic flips.
It identifies "breakout" points where price pierces the bands.
It bets on continuation (e.g., Price > Upper Band = Long).
2. Advanced Automation & Safety Features
This system is built to drive trading bots (like TradersPost or 3Commas) safely:
State-Aware Execution: It tracks its own trades (in_trade state). It will never fire a duplicate "Open" signal if a trade is already active, preventing accidental pyramiding.
No Trade Zone (Force Close): You can define a specific time window (default 15:10–17:00). If a trade is open when this time hits, the script immediately triggers a Close Alert, preventing overnight holds.
Signal Cooldown: Configurable "Signals to Skip" allows you to force a cooldown period after a trade closes to avoid over-trading in choppy conditions.
3. Real-Time Analytics Dashboard
The on-chart table provides a transparent, real-time backtest of your settings:
Equity Calculator: You can set a dollar value per point (e.g., $2 for MNQ). The dashboard calculates your estimated Net Profit/Loss based on the total points gained.
Streak Analysis: Shows both the Maximum and Average number of consecutive wins and losses, helping you understand the psychological difficulty of trading the strategy.
Data Integrity: It automatically detects "N/A" trades (candles that hit both SL and TP) and excludes them from the Win Rate calculation to ensure realistic statistics.
4. Modular "Recipe" Building
The strategy is highly customizable via the settings menu (no coding required). You can filter the Bollinger Band trigger with 10 different indicators:
Supported Filters: RSI, Stochastic, CCI, Williams %R, MFI, CMO, Fisher Transform, Ultimate Oscillator, and ROC.
Logic: All selected filters must agree with the main trigger for a trade to fire.
5. Visual Projection Engine
Glowing Outcomes: The script draws exact TP (Green) and SL (Red) boxes for past trades. These boxes glow to indicate the result, allowing for rapid visual verification of the strategy's performance.
Force Close Markers: Special gray markers appear on the chart where a trade was forced to close due to the "No Trade Zone" time limit.

Kairos QX Indicator [v1.6]This script, Kairos QX , is a sophisticated, highly customizable trading engine designed for automated execution. It serves as a bridge between discretionary charting and algorithmic trading, allowing you to visually backtest complex ideas and then automate them via alerts.
Its core logic is built on Mean Reversion, but it features a powerful "Inverse Mode" that instantly transforms it into a Trend Following system.
1. The Core Strategy: Mean Reversion (Default)
By default, the script operates on the principle that price eventually returns to an average value after an extreme move.
Logic: It fades the move.
Short Signal: Price pierces the Upper Bollinger Band (overbought) + optional confluence filters (e.g., RSI > 70). The bet is that price will revert down.
Long Signal: Price pierces the Lower Bollinger Band (oversold) + optional confluence filters. The bet is that price will revert up.
2. The "Inverse Mode": Trend Following (Flip Switch)
The script includes a unique Inverse Trades checkbox that flips the entire logic engine. This allows you to adapt to market conditions where price isn't reverting but is instead "running" hard.
Logic: It rides the breakout.
Short Signal becomes Long: When price pierces the Upper Bollinger Band, instead of shorting (expecting a drop), the script enters Long (expecting the trend to blast through and continue higher).
Long Signal becomes Short: When price pierces the Lower Bollinger Band, the script enters Short, betting on a trend continuation downward.
Why this matters: If your backtest shows a failing Mean Reversion strategy (e.g., a "F" grade), flipping this switch can instantly invert those losses into wins by aligning with the trend instead of fighting it.
3. Built for Automation & Safety
The script is engineered to safely drive third-party auto-trading bots (like TradersPost, 3Commas, or PineConnector) without manual intervention.
State-Aware Execution: The script tracks its own trade state. It will never fire a duplicate "Open" signal if a trade is already active, preventing accidental double-entries.
No Trade Zone (Force Close): You can set a specific time window (e.g., 15:55 PM) where the script automatically triggers a Close Alert for any open position. This protects you from holding day trades overnight or through major news events.
Signal Cooldown: To prevent over-trading in choppy markets, you can set the script to ignore the next 1-5 signals after a trade finishes, forcing it to wait for a fresh setup.
4. Modular "Recipe" Building
You don't need to know code to change the strategy. The settings menu allows you to mix and match 10 different indicators as confluence filters.
Example Recipe: "Only take a Mean Reversion Long if: Price is below the Bollinger Band AND RSI is < 30 AND MFI is < 20."
If you check the boxes, the script enforces the rules. If you uncheck them, they are ignored.
5. Visual Projection Dashboard
The script doesn't just print arrows; it performs a real-time visual backtest on the chart.
Glowing Projections: It draws the exact Take Profit (Green) and Stop Loss (Red) boxes for historical trades. These boxes glow to indicate if the trade won or lost.
Data Integrity: It automatically detects and isolates "N/A" trades—candles so volatile that they hit both your SL and TP in the same bar—excluding them from your win rate to keep your data realistic.
Live Grading: A dashboard in the corner grades your current settings (A-F) based on their performance over the last 1,000 to 40,000 bars.
