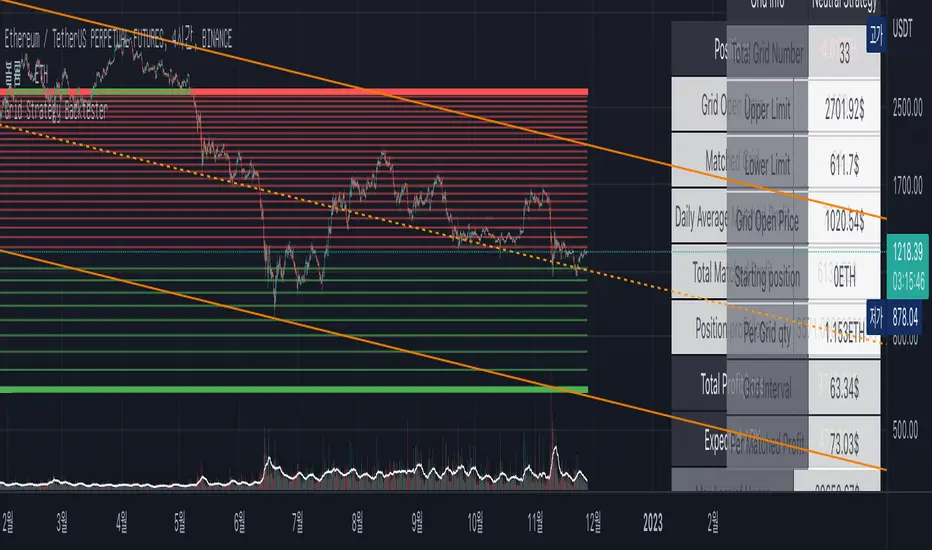
Grid Strategy Back Tester (Long/Short/Neutral)Preface
I'd like to send a thank you to @xxattaxx-DisDev.
The 'Line' Code, which was the most difficult to plan the Grid Indicator, was solved through the 'Grid Bot Simulator' script of @xxattaxx-DisDev.
A brief description of the indicators
These indicators are designed for backtesting of grid trading that can be opened on various exchanges.
Grid trading is a method of selling at particular intervals as prices rise and fall for gird interval price range.
This indicator is actually designed to see what the Long / Short / Neutral grid has achieved and how much it has achieved over a given period of time.
How to use
1. Lower Limit and Upper Limit are required when putting indicators on the chart.
After that, choose the 'Time' when to open the grid.
Also, select Long / Short / Neutral direction if necessary.
2. Statistics Table
Matched Grid shows how many grid pairs were engaged during the backtesting period.
The Daily Average Matching Profit is calculated based on the number of these closed grids.
Total Matching Profit is calculated as Matching Grid * Per Matching Profit.
Position Profit/Loss shows the benefits and losses from your current position.
Total Profit/Loss is sum of Total Matching Profit and Position Profit/Loss.
The Expanded APY shows the benefits of running the strategy on these terms for a year.
Max Loss of Upper is the maximum loss assumed to be directly at the top of the grid range.
BEP days (Upper) show how many days of maintenance relative to Average Matching Profit can result in greater profit than maximum loss if the grid continues to move within range.
(In the case of Long Strategy, it appears to be 'Min Profit', which shows minimal benefit if it reaches the top.)
Max Loss of Lower and BEP days (Lower) shows the opposite.
(In the case of Short Strategy, it is also referred to as 'Min Profit', which shows minimal benefit if it reaches the bottom.)
3. Grid Info
Total Grid Number, Upper Limit, and Lower Limit show the values you set in INPUT.
Grid Open Price shows the price for the period you decide to open.
Starting Position shows the number of positions that were initially held in the case of a Long / Short Strategy.
(0 for Neutral Strategy)
Per Grid qty shows how many positions are allocated to one grid
Grid Interval shows the spacing of each grid.
Per Matched Profit shows how much profit is generated when a single grid is matched.
Caution
Backtesting results for these indicators may vary depending on the time frame.
Therefore, I recommend that you use it only to compare Profit/Loss over time.
*In addition, there is a problem that all lines in the grid are not implemented, but it is independent of the backtest results.
--------------------------------------
서문
지표를 기획함에 있어서 가장 어려웠던 line 코드를 @xxattaxx-DisDev의 'Grid Bot Simulator' 스크립트를 통해 해결할 수 있었습니다.
이에 감사의 말씀을 드립니다.
해당 지표에 대한 간단한 설명
해당 지표는 다양한 거래소에서 오픈할 수 있는 그리드 매매에 대한 백테스팅을 위해 만들어졌습니다.
그리드매매는, 특정 가격 구간에 대해 가격이 오르고 내림에 따라 일정 간격에 맞춰 매매를 하는 방식입니다.
이 지표는 실질적으로 롱/숏/중립 그리드가 어떠한 성과를, 특정 기간동안 얼마나 냈는지를 확인하고자 만들어졌습니다.
사용방법
1. 인풋
지표를 차트위에 넣을 때, Lower Limit과 Upper Limit이 필요합니다.
그 후 그리드를 언제부터 오픈할 것인지를 선택하세요.
또, 필요하다면 Long / Short / Neutral의 방향을 선택하세요.
2. 그리드 통계
Matched Grid는, 백테스팅 기간동안 체결된 그리드 쌍이 몇개인지를 보여줍니다.
이 체결된 그리드의 갯수를 바탕으로 Daily Average Matched Profit이 계산됩니다.
Total Matched Profit은, Matched Grid * Per Matched Profit으로 계산됩니다.
Position Profit/Loss는, 현재 갖고 있는 포지션으로 인한 이익과 손실을 보여줍니다.
Total Matched Profit과 Position Profit/Loss를 합친 금액이 Total Profit/Loss가 됩니다.
Expcted APY는, 이러한 조건으로 전략을 1년동안 운영했을 때의 이익을 보여줍니다.
Max Loss of Upper는, 그리드 범위의 최상단에 바로 도달했을 경우를 가정한 최대 손실입니다.
BEP days(Upper)는, 그리드가 범위 내에서 계속 움직일 경우, Average Matched Profit을 기준으로 며칠동안 유지되어야 최대손실보다 더 큰 이익이 발생할 수 있는지를 보여줍니다.
(Long Strategy의 경우, ‘Min Profit’이라고 나타나는데, 최상단에 도달했을 경우 최소한의 이익을 보여줍니다)
Max Loss of Lower는 그 반대의 경우를 보여줍니다.
(Short Strategy의 경우, 역시 ‘Min Profit’이라고 나타나는데, 최하단에 도착했을 경우 최소한의 이익을 보여줍니다)
3. 그리드 정보
그리드 갯수, Upper Limt, Lower Limt은 자신이 설정한 값을 보여줍니다.
Grid Open Price는, 자신이 오픈하기로 정했던 기간의 가격을 보여줍니다.
Starting Position은, 롱/숏 그리드의 경우에 처음에 들고 시작했던 포지션의 갯수를 보여줍니다.
Neutral Strategy의 경우 0입니다.
Per Grid qty는, 하나의 그리드에 얼마만큼의 포지션이 배분되었는지를 보여주며
Grid Interval은 각 그리드의 간격을 보여줍니다.
또, Per Matched Profit은 하나의 그리드가 체결될 때 얼마만큼의 이익이 발생하는 지를 보여줍니다.
이러한 지표에 대한 역테스트 결과는 시간 프레임에 따라 달라질 수 있습니다.
따라서 시간 경과에 따른 손익을 비교할 때만 사용하는 것이 좋습니다.
*추가로, 그리드의 라인이 모두 구현되지 않는 문제가 있지만, 백테스팅 결과와는 무관합니다.
"bot" için komut dosyalarını ara
ATR Trend Run - Signals Alerts SL and TP by Tech Store OnThe script uses several ATR formulas for entering/exiting trades, support/resistance lines to take TP1 (take profit 1) and another ATR formula for TP2 (take profit 2). Everything is fully configurable to your preference, and you can back-test it via TradingView. You can also configure the indicator for signals during US trading sessions (with or without power hour), as well as taking profits/stop-loss session time(s), as well as to close a position at the end of the trading session no matter what. Also, you can turn all of that off, so there are no trading session/end of day limits and each trade will run until it either hits SL, TP1, TP1 > back to entry, TP2. Note: indicator is set to skip consecutive/opposite signals, while you currently have a trade open > if you hit a trend – ride it to the end!
For example: If you will be day trading SPY and you wish to close your positions no matter what right before the market closes (3:45PM ET > 15min before closes): Make sure to checkbox “Intraday – Close Position Before Market Closes” in the strategy/indicator Settings, so that you are alerted soon before the market closes, if you wish to continue holding the position – leave this checkbox unchecked.
SL: SL is set to be slightly above/below the signal candle, which is best suited for this strategy.
Strategy Take Profit Approach
While the initial position open and SL hit is always based on a closed candle bar (can’t do otherwise, as otherwise you will have 10s of fake signal alerts), there are 2 ways on trading this strategy in terms of TP1 and TP1 taken > back to Entry, which is based off Alert type.
You can switch this as you like within the indicator settings, “Checked: TP1 taken > back to Entry per Price Touch | Unchecked: per Candle Close”.
Candle Close vs Price Touch: with the Default method - Candle Close for an alert for TP1 or if price comes back to Entry after TP1 is taken will only be triggered once candle bar fully closes crossing the area, while Price Touch will alert when price touches the area before candle bar closes.
For example: your trade is running well, you grab TP1 and the price reverses and hits your trade Entry area. With Price Touch – you are immediately alerted to close your trade with no loss and with TP1 profit. With Candle Close - you will receive an alert only once candle bar fully closes on top of the Entry crossing it backwards, meaning it may lower your TP1 profit or even completely reverse the trade into loss in case it will be a huge candle bar for any reason. However, it may touch the Entry area, looking like the price is reversing, but then continue per initial trade direction, sometimes becoming a trend. So, while Price Touch seem like a more conservative approach, Candle Close can give you much bigger profits if you catch a trend, but you can always change it via the Settings.
Note: TradingView back-testing engine does not have a feature to open/close orders IMMEDIATELY via Price Touch trigger, but only when the candle closes after price touches the scripted area/line/etc., so you for the most accurate results, test your strategy out via Candle Close setting. Otherwise, decide yourself. I personally like more Candle Close since I can test it out via back-testing with the most accurate results.
TP2 is set per Candle Close as often the ATR trailing stop line will be hit and bounced off, so it’s best to wait until candle actually breaks it/closes through it.
Note: If you will be observing the strategy LIVE, during LIVE candle bar movement – it will look weird, like it’s placing an order after order during any trigger – this seem like a TradingView bug, but is only observational, once the candle bar is closed and you refresh TradingView it will all look correct.
Back-Testing
If you wish to do some back-testing, just modify the strategy/indicator Settings:
-----1) STRATEGY: This is for back-testing/experimenting with the script inputs.
----------a. You can setup a start date (date, month, year) from which it will start opening back-test trades, select a position size and select TP1 size, the idea here is to close half (or whatever you choose) portion of the trade once you hit your TP1, then to either close at small profit or to catch a trend and close the second portion of the position long way ahead from Entry, otherwise it will alert you to close the position at TP2, if price comes back to Entry, at reversal signal or at the end of US trading session if the option for it is checked. If you wish to close the whole position at TP1, just enter the same amount for TP1 to match backtest position size. Otherwise you can experiment with TP1 sizing – try it out!
-----2) Feel free to experiment with ATR settings and with S&R Left/Right bars, you may be amazed how results will differ and find some really cool combinations!
-----3) Make sure you select/de-select “Intraday – Close Position Before Market Closes” setting depending on what you are back-testing and on which conditions
-----4) Note: If you wish to do some deep back-testing (1+ years), use the “Deep Backtesting” feature within Strategy Tester on the TradingView as otherwise it may show wrong results or even fail to compute the results
Add the alerts
-----Right-click anywhere on the TradingView chart
-----Click on Add alert
-----Condition: ATR Trend Run - Signals Alerts SL and TP, by Tech Store On
----------o Right underneath the condition click on the drop-down menu and select “alert() function calls only”
-----Expiration time: Whatever you wish
-----Alert actions: Whatever notifications you wish
-----Alert name: DO NOT TOUCH THIS
-----Hit “Create”
-----Note: If you change ANY Settings within the indicator – you must DELETE the current alert and create a new one per steps above, otherwise it will continue triggering alerts per old Settings!
- Note: If you add the alert while the script is currently “In Position” it will not know that. So either wait when there will be no position open at all or close your position partially if the bot opens it twice bigger or so in case per script the bot will think it is already in position.
Note: Because of the slippage and the order processing time between TradingView, AutoView and the Broker (it’s usually about a second or so), it is suggested to not use a timeframe lower than 1min. The script is working really well with 1M/3M/5M/H1/H4 timeframes per my back-testing, but feel free to explore via Strategy Back-testing what’s best for the instrument you wish to trade.
If you wish to try this out for a week or so – please reach out and I will give you access.

MACD with Support and Resistance - Signals, Alerts, TP and SLMACD with Support and Resistance - Signals Alerts SL and TP by Tech Store On
The script uses MACD for entering/exiting trades and support/resistance lines to take TP1 (take profit 1). Both MACD and support/resistance lines are fully configurable to your preference, and you can back-test it via TradingView. Once TP1 is taken, you can either set the indicator to close the trade at the end of the US trading session day (4PM ET) or you can continue taking partial profits where you wish or just wait until reversal signal alert.
For example: If you will be day trading SPY and you wish to close your positions no matter what right before the market closes (3:45PM ET > 15min before closes): Make sure to checkbox “Intraday – Close Position Before Market Closes” in the strategy/indicator Settings, so that you are alerted soon before the market closes, if you wish to continue holding the position – leave this checkbox unchecked.
SL: SL is set to be slightly above/below the MACD signal candle, which is best suited for this strategy from manual backtesting.
Strategy Take Profit Approach
While the initial position open and SL hit is always based on a closed candle bar (can’t do otherwise, as otherwise you will have 10s of fake signal alerts), there are 2 ways on trading this strategy in terms of TP1 / TP1 taken > back to Entry, which is based off Alert type.
You can switch this as you like within the indicator settings, “Checked: TP1/TP1 taken > back to Entry per Price Touch | Unchecked: per Candle Close”.
Candle Close vs Price Touch: with the Default method - Candle Close for an alert for TP1 or if price comes back to Entry after TP1 is taken will only be triggered once candle bar fully closes crossing the area, while Price Touch will alert when price touches the area before candle bar closes.
For example: your trade is running well, you grab TP1 and the price reverses and hits your trade Entry area. With Price Touch – you are immediately alerted to close your trade with no loss and with TP1 profit. With Candle Close - you will receive an alert only once candle bar fully closes on top of the Entry crossing it backwards, meaning it may lower your TP1 profit or even completely reverse the trade into loss in case it will be a huge candle bar for any reason. However, it may touch the Entry area, looking like the price is reversing, but then continue per initial trade direction, sometimes becoming a trend. So, while Price Touch seem like a more conservative approach, Candle Close can give you much bigger profits if you catch a trend, but you can always change it via the Settings.
Note: TradingView back-testing engine does not have a feature to open/close orders IMMEDIATELY via Price Touch trigger, but only when the candle closes after price touches the scripted area/line/etc., so you for the most accurate results, test your strategy out via Candle Close setting. Otherwise, decide yourself. I personally like more Candle Close since I can test it out via back-testing with the most accurate results.
Note: If you will be observing the strategy LIVE, during LIVE candle bar movement – it will look weird, like it’s placing an order after order during any trigger – this seem like a TradingView bug, but is only observational, once the candle bar is closed and you refresh TradingView it will all look correct.
Back-Testing
If you wish to do some back-testing, just modify the strategy/indicator Settings:
-----1) STRATEGY: This is for back-testing/experimenting with the script inputs.
----------a. You can setup a start date (date, month, year) from which it will start opening back-test trades, select a position size and select TP1 size, the idea here is to close half (or whatever you choose) portion of the trade once you hit your TP1, then to either close at small profit or to catch a trend and close the second portion of the position long way ahead from Entry, otherwise it will alert you to close the position if price comes back to Entry, at reversal signal or at the end of US trading session if the option for it is checked. If you wish to close the whole position at TP1, just enter the same amount for TP1 to match backtest position size. Otherwise you can experiment with TP1 sizing – try it out!
-----2) Feel free to experiment with MACD settings and with S&R Left/Right bars, you may be amazed how results will differ and find some really cool combinations!
-----3) Make sure you select/de-select “Intraday – Close Position Before Market Closes” setting depending on what you are back-testing and on which conditions
-----4) Note: If you wish to do some deep back-testing (1+ years), use the “Deep Backtesting” feature within Strategy Tester on the TradingView as otherwise it may show wrong results or even fail to compute the results
Add the alerts
-----Right-click anywhere on the TradingView chart
-----Click on Add alert
-----Condition: MACD with Support and Resistance - Signals
----------o Right underneath the condition click on the drop-down menu and select “alert() function calls only”
-----Expiration time: Whatever you wish
-----Alert actions: Whatever notifications you wish
-----Alert name: DO NOT TOUCH THIS
-----Hit “Create”
-----Note: If you change ANY Settings within the indicator – you must DELETE the current alert and create a new one per steps above, otherwise it will continue triggering alerts per old Settings!
- Note: If you add the alert while the script is currently “In Position” it will not know that. So either wait when there will be no position open at all or close your position partially if the bot opens it twice bigger or so in case per script the bot will think it is already in position.
Note: Because of the slippage and the order processing time between TradingView, AutoView and the Broker (it’s usually about a second or so), it is suggested to not use a timeframe lower than 1min. The script is working really well with 15M/H1 timeframes per my back-testing, but feel free to explore via Strategy Back-testing what’s best for the instrument you wish to trade.

PineHelperLibrary "PineHelper"
This library provides various functions to reduce your time.
recent_opentrade_entry_bar_index()
get a recent opentrade entry bar_index
Returns: (int) bar_index
recent_closedtrade_entry_bar_index()
get a recent closedtrade entry bar_index
Returns: (int) bar_index
recent_closedtrade_exit_bar_index()
get a recent closedtrade exit bar_index
Returns: (int) bar_index
all_opnetrades_roi()
get all aopentrades roi
Returns: (float) roi
bars_since_recent_opentrade_entry()
get bars since recent opentrade entry
Returns: (int) number of bars
bars_since_recent_closedtrade_entry()
get bars since recent closedtrade entry
Returns: (int) number of bars
bars_since_recent_closedtrade_exit()
get bars since recent closedtrade exit
Returns: (int) number of bars
recent_opentrade_entry_id()
get recent opentrade entry ID
Returns: (string) entry ID
recent_closedtrade_entry_id()
get recent closedtrade entry ID
Returns: (string) entry ID
recent_closedtrade_exit_id()
get recent closedtrade exit ID
Returns: (string) exit ID
recent_opentrade_entry_price()
get recent opentrade entry price
Returns: (float) price
recent_closedtrade_entry_price()
get recent closedtrade entry price
Returns: (float) price
recent_closedtrade_exit_price()
get recent closedtrade exit price
Returns: (float) price
recent_opentrade_entry_time()
get recent opentrade entry time
Returns: (int) time
recent_closedtrade_entry_time()
get recent closedtrade entry time
Returns: (int) time
recent_closedtrade_exit_time()
get recent closedtrade exit time
Returns: (int) time
time_since_recent_opentrade_entry()
get time since recent opentrade entry
Returns: (int) time
time_since_recent_closedtrade_entry()
get time since recent closedtrade entry
Returns: (int) time
time_since_recent_closedtrade_exit()
get time since recent closedtrade exit
Returns: (int) time
recent_opentrade_size()
get recent opentrade size
Returns: (float) size
recent_closedtrade_size()
get recent closedtrade size
Returns: (float) size
all_opentrades_size()
get all opentrades size
Returns: (float) size
recent_opentrade_profit()
get recent opentrade profit
Returns: (float) profit
all_opentrades_profit()
get all opentrades profit
Returns: (float) profit
recent_closedtrade_profit()
get recent closedtrade profit
Returns: (float) profit
recent_opentrade_max_runup()
get recent opentrade max runup
Returns: (float) runup
recent_closedtrade_max_runup()
get recent closedtrade max runup
Returns: (float) runup
recent_opentrade_max_drawdown()
get recent opentrade maxdrawdown
Returns: (float) mdd
recent_closedtrade_max_drawdown()
get recent closedtrade maxdrawdown
Returns: (float) mdd
max_open_trades_drawdown()
get max open trades drawdown
Returns: (float) mdd
recent_opentrade_commission()
get recent opentrade commission
Returns: (float) commission
recent_closedtrade_commission()
get recent closedtrade commission
Returns: (float) commission
qty_by_percent_of_equity(percent)
get qty by percent of equtiy
Parameters:
percent : (series float) percent that you want to set
Returns: (float) quantity
qty_by_percent_of_position_size(percent)
get size by percent of position size
Parameters:
percent : (series float) percent that you want to set
Returns: (float) size
is_day_change()
get bool change of day
Returns: (bool) day is change or not
is_in_trade()
get bool using number of bars
Returns: (bool) allowedToTrade
discord_message(name, message)
get json format discord message
Parameters:
name : (string) name of bot
message : (string) message that you want to send
Returns: (string) json format string
telegram_message(chat_id, message)
get json format telegram message
Parameters:
chat_id : (string) chatId of bot
message : (string) message that you want to send
Returns: (string) json format string

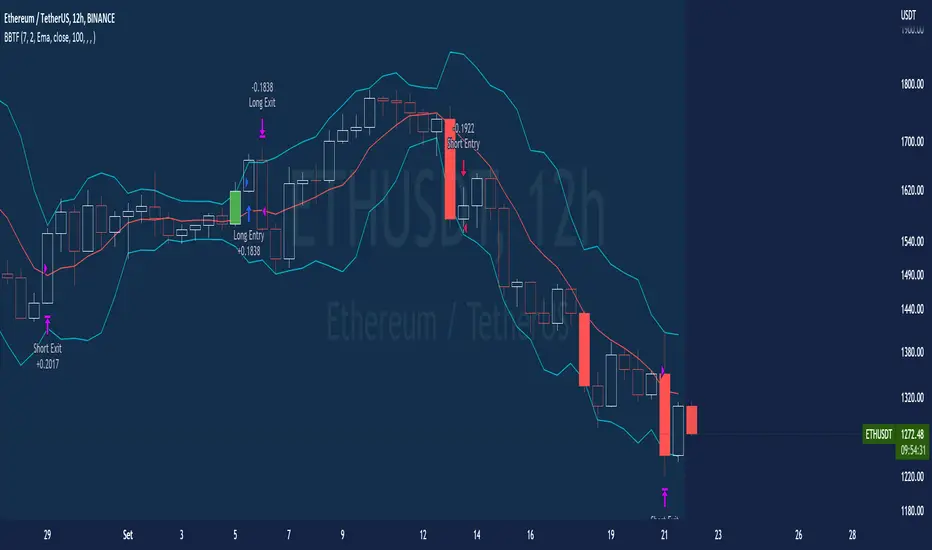
BT-Bollinger Bands - Trend FollowingEsse script foi criado para estudo de Backtest.
O script usa as Bandas de Bollinger para indicar o início de uma tendência, a entrada é configurada quando o preço abre abaixo e fecha acima da banda superior ou para venda quando o preço abre acima e fecha abaixo da banda inferior.
Não há um stop fixo e nem alvo fixo a saída se dá quando o preço toca a média da banda.
Você pode usar uma média móvel como filtro combinado com a estratégia.
O Script também pode ser usado com algum serviço de bot como 3commas.io , basta colocar as mensagens de entrada e saída para o bot.
Autor : Credsonb - Nick: M4TR1X_BR
Neste gráfico estou usando as seguintes configurações:
Bandas Bollinger: 7
Desvio Padrão: 1.5
Time Frame: 12hs
Ticker: ETH
This script was created for Backtest study.
script uses Bollinger Bands to indicate the start of a trend, entry is set when price opens below and closes above the upper band or for short when price opens above and closes below the lower band.
There is no fixed stop and no fixed target, the exit occurs when the price touches the average of the band.
You can use a moving average as a filter combined with the strategy.
The Script can also be used with some bot service like 3commas. io , just put the input and output messages to the bot.
Author : Credsonb - Nick: M4TR1X_BR
Full Volatility Statistics and Forecast
This is a tool designed to translate the data from the expected volatility of different assets, such as for example VIX, which measures the volatility of SP500 index.
Once get the data from the volatility asset we want to measure(for this test I have used VIX), we are going to translate it the required timeframe expected move by dividing the initial value into :
252 = if we want to use the daily timeframe, since there are ~252 aproximative daily trading days
52 = if we want to use the weekly timeframe, since there 52 trading weeks in a year
12 = if we want to use the monthly timeframe, since there are 12 months in a year
For this example I have used 252 with the daily timeframe.
In this scenario, we can see that we had 5711 total cnadles which we analysed, and in this case, we had 942 crosses, where the daily movement ended up either above or below the channel made from the opening daily candle value + expected movement from the volatility, giving as a total of 16.5% of occurances that volatility was higher than expected, and in 83.5% of the times, we can see that the price stayed within our channel.
At the same time, we can see that we had 6 max losses in a row ( OUT) AND 95 max wins in a row (IN), and at the same time in those moments when the volatility crosses happen we had a 0.51% avg movements when the top crossed happened, and 0.67% avg movements when the bot happened.
Lastly on the second part of the panel, we had E which means the expected movement of today, for example it has 61.056$ , so lets say price opened on 4083, our top is 4083 + 61 and our bot is 4083 - 61 ( giving us the daily channel). At continuation we can see that overall the avg bull candle os 0.714% and avg bear candle was 0.805% .
I hope this tool will help you with your future analysis and trades !
If you have any questions please let me know !

BT-SAR Ema, Squeeze, Volatility
Esse script foi criado para estudo de Backtest.
Ele usa o SAR PARABÓLICO como indicador de sinal de entrada, você também pode combinar 3 indicadores para filtrar as entradas: Média Móvel, Squeeze Momentum e Volatility Oscilator .
Existe duas entradas, quando o SAR Parabólico vira ou pelo Breakout (usando o último preço) do SAR Parabólico antes dele virar.
As Os filtros podem ser usados de forma combinada ou individual.
O Script também pode ser usado com algum serviço de bot como 3commas.io, basta colocar as mensagens de entrada e saída para o bot.
This script was created for Backtest study.
It uses PARABOLIC SAR as input signal indicator, you can also combine 3 indicators to filter inputs: Moving Average, Squeeze Momentum and Volatility Oscillator .
There are two entries, when the Parabolic SAR turns or by Breakout (using the last price) of the Parabolic SAR before it turns.
The Filters can be used in combination or individually.
The Script can also be used with some bot service like 3commas.io, just put the input and output messages to the bot.

Protervus Trading ToolkitHi Traders! Welcome to Protervus Trading Toolkit (PTT) , a comprehensive set of tools to help you building, backtesting, and even automating your strategy.
Important : the data and screenshots I publish are solely for presentation and explanation purposes and must not be intended as recommendations or guarantees. Please consider eventual backtesting results seen here as almost-random. My goal is not to provide ready-made strategies, signals, or infallible methods, but rather indicators and tools to help you focus on your own research and build a reliable trading plan based on discipline.
BUILD, BACKTEST, AUTOMATE
The first step is to link a chained indicator which will send Entry signals and, optionally, Exit signals: to integrate your own triggers with this toolkit, check out my tutorial and use this code as a template.
Then, in the Trading Settings you can set the Trading Mode (Full - Long and Short, Long only, or Short only) as well as Starting Capital, Drawdown Limit, Risk per Trade, Fees, and the date range in which trading will be enabled and backtested.
Go further by tweaking your strategy with built-in Take Profit and Stop Loss conditions, and keep it under control thanks to the Statistics Panel.
Trades will be shown on the chart, including TP\SL levels (according to the ones you enable) and per-trade statistics:
Tip: point the cursor over TP or SL icon to open the tooltip, showing additional details about the trade.
BUILT-IN CONDITIONS
Note: all conditions already account for fees.
Take Profit \ Stop Loss percentage
Take Profit or Stop at Loss when a fixed percentage is reached.
Limit \ Hard Stop: the trade will be considered closed when that specific price is reached - otherwise, the candle closing price will be used.
Trailing Take Profit
Trail the price and close the trade in profit when it reverses for the chosen percentage.
Engage and Disengage: activate trailing when the price is above the entry price for the chosen percentage, and de-activate it if price goes past the disengage percentage.
Safety TP: close the trade at Break-Even if the price sharply reverses from engaged area to BE level. A specific Alert is available in order to create a separate trigger with immediate effect.
Note: using TP Safety with an Engage % of zero might result in many early exits, so it is recommended to add some margin to Engage % to avoid that.
Exit \ Stop on Opposite Signal
Close the trade when another, contrary signal is received (e.g. close a Long position when a signal to go Short is received).
Exit \ Stop after X candles
Close the trade after X candles, as soon as the condition is met (e.g. for Take Profit condition, it will close the trade after X candles as soon as the trade is in profit).
Bind to TP \ SL: only validate the condition if the current PnL is above (TakeProfit cond.) or below (Stop Loss cond.) the specified percentage.
ATR Stop
Classic ATR Stop Loss.
Trailing ATR
Chase the price by the defined ratio and close the position when the candle closes past the ATR line.
Bind to TP \ SL: only validate the condition if the current PnL is above (TakeProfit cond.) or below (Stop Loss cond.) the specified percentage.
External Signal (sent from your indicator)
Close the position basing on your own triggers, defined in the chained indicator.
- Bind to TP \ SL: only validate the condition if the current PnL is above (TakeProfit cond.) or below (Stop Loss cond.) the specified percentage.
PANEL CUSTOMIZATION AND ADDITIONAL OPTIONS
A strategy name can be assigned in the settings and will show it at the top of the Statistics Panel, so you can better identify and label your tests and live instances.
The panel can be customized in terms of colors, text size and height. It can be also "split" in modular panels that will appear at the bottom of the chart.
It is also possible to show \ hide prices and live data labels as well as position and Break-Even levels. In some cases you will need to limit the display of those plots in order to avoid PineScript calculation issues.
If you limited the plots but you are checking very old trades, you can enable the Legacy position tracker to see basic markers for positions (position is active, and profit \ loss marker).
In the case you will be sending webhook alerts to a trading bot , "Position Alert Failover" will come in aid to prevent situations where the initial trade closing alert is either not sent or missed: it will keep sending the position closing signal for X candles.
PLUGINS
Thanks to the modular nature of PTT, plugins will eventually be available to provide additional features and extend functionalities even further. Make sure to keep an eye on updates.
CREATING ALERTS
To create alerts you must first select the PTT indicator from the "Condition" drop-down menu, then the whole list of available alerts will appear. When creating alerts, please make sure to set "Once Per Bar Close" for the normal conditions, and "Once Per Bar" for safety conditions (Limit and Hard Stop simulation, Trailing TP Safety Trigger).
Besides positions opening and closing alerts, you also have the option to add extra alerts for when a position is open or not open (e.g. Active Long position, No Long Position) - that might come handy when dealing with trading bots and automation tools. Also, as mentioned earlier, you have the chance to create a special alert as failover in order to repeat the closing alert.
TIPS AND RECOMMENDATIONS
Set Visual Order > Bring to front for PTT to avoid other indicators or candles covering up labels.
If you receive errors like "Referencing too many candles" or "Too many drawings", use the " Limit to last candles " function in the Settings panel to lower the number of candles.
If the Statistics Panel or labels are not appearing, and no errors are shown (red circled exclamation mark next to indicator's name), try changing any value in the settings to trigger a new calculation.
The Lowest Point in Trades refers to the maximum movement against your position. However, if the price never goes negative against the Entry level, it will be calculated from the Break-Even level.
Differently from TradingView's Strategy Tester, PTT calculates DrawDown from the Equity line (the starting balance).
Remember that Backtests only show past results, and although very useful to understand if your strategy makes sense, the market can completely change at any moment and ruin your dreams: make sure to avoid over-fitting (using very specific values) in your settings and to prefer more generic values in order to factor broader market situations.
After many successful backtests of your newly created strategy, let it run live without actually trading it for some time (paper trading), and see if it remains valid.
You can use multiple Conditions as safeguard. For example, main Stop condition can be Trailing ATR and secondary Stop condition can be Stop Loss % with Hard Stop, so you will be protected in case of sudden big price moves.
Smart Money BusterAfter daytrading for a while i came into conclusion that price action trading is the most successful way to trade for me and this project was for me to simplify my way of trading at the beginning. Eventually it got big and turned into a very useful helper indicator for me to setup on different pairs for alerts and only look at the charts to decide for entry when the alerts come from 120 different pairs that i set it up. Since i always looked at indicators for a way to make my job simpler and give me more time to do more important things for me rather than drawing lines on different pairs eveyday i think it got to a point where it works to my liking and making me gain time, thus more money.
This indicator uses smart money concepts like Market Structure, Order Blocks, Quassimodo Levels, Structure Breaks, Pumps and Dumps, Imbalances(In the works will be added in first update) to help trader catch what the whales are thinking and how to enter in the right time for swing trading, catching bottoms and tops.
Here are some of the features as of release:
Detects Market Structure and draws zig-zag lines and keeps note of pivot points.
Detects Order blocks and draws boxes when the conditions met
Detects the quassimodo levels and changes the color of the box to signal double confluence meaning stronger signal
Draws structure break lines
Setting to set structure break percentage before drawing boxes to get the boxes drawn if you want to be more 'sure' about the Order Block Levels.
Setting to change depth and backstep values for zigzags to be able to let you fit the system for different time frames.
Setting to set MSB trigger point between High and Low, Close and Open or hl2 values.
Setting to set Signal Triggering Range between Start, Middle and End meaning eg. if you set it to Middle it will wait for MSB trigger point to hit the middle of the box before giving you a signal.
Setting for changing HH-LL pivot points lookback count, 5 as default. Increasing this value will make you compare your pivot points with more data, really useful in lower time frames where will be a lot of zig-zags and highs and lows giving you a method to avoid false signals. Recommended to keep it lower values on 30 min and higher and increase it in lower Timeframes according to market volatility.
Setting to add a Box limit where the box of order block will be set invalid after certain candles and it still didn't trigger. Default value of 0 means it's disabled.
Setting to set Candle volatility percentage value to avoid big candles getting opposite signals on fast pump or dump schemes and bust those market makers schemes. Gotta say this came out really handy in crypto markets :)
As an end you can set alerts for 'Buy' , ' Sell ', ' Buy and Sell' together or if you wish you can connect it to bots via webhook as an entry. Although haven't connected to any bots myself as i think the best method of trading is human and machine working together. Since we have the creativity and out of the box thinking and machines have the ability to brute force calculation and huge bandwith that we don't currently have. At least until Elon Musk turns is into a cyborg, which i am not very eager about.
Planned Features:
- Add ability to detect imbalances(fair value gaps) to add third confluence to detect dragon fruit entries. This will make the system work with triple confluence.
- Add more settings so humans can command the ai better.
- Maybe a strategy version after i write my own dynamic take profit algorithm to give system ability make quantitative decisions based on current position profit levels.
- Although i think i fixed almost all the important bugs if there ever comes up one bugs will take priority for updates.
- And some things i may decide to add later. I will keep working on this project since it works well for me.
And like always, happy trading.

KISS BOT (Keep It Simple BOT)A very simple script that can be used for Futures and Options Trading - for stocks, crypto, forex etc.
The script includes usage of following public scripts:
1. Super Trend
2. Linear Regression
3. Exponential Moving Average
Concept, we are using three EMA, with source High, Low, and Close. We want to buy or sell when there is a crossover of third EMA (fastest) over first and second respectively.
E.g. the default values are EMA 13 High, EMA 13 Low and EMA 5 Close, we will get Buy signal when EMA 5 crosses over EMA 13 High and we will get Sell signal when EMA 5 crosses under EMA 13 Low.
Super Trend settings are made for Looking for Buy or Looking Sell, so that we focus on the trend. Trend is your friend.
Buy Trigger Line and Sell Trigger Line are just indication of using Trigger Line, buy is when EMA 5 crosses EMA 13 Low and Sell When EMA 5 Crosses EMA 13 High
The Tunnel or Band highlighted is the no trade zone for us and we do not want to trade side ways market.
Inside Bars are shown in Yellow, these candles do not qualify for any trade decision.
Outside Bars are shown in Pink, these candles do not qualify for any trade decision

Density & Step Grid Strategies BacktesterThis contains several signals for backtesting strategies only in binance futures assets.
HOW IT WORKS
Grid trading is a trading strategy where an investor creates a so-called "price grid". The basic idea of the strategy is to repeatedly buy at the pre-specified price and then wait for the price to rise above that level and then sell the position (and vice versa with shorting or hedging). We introduce 2 grids trading algorithms "Step" and "Density" .
FEATURES
Grid size: This algorithm has a max of 20 orders.
Take profit: The trader can increase or decrease the distance between the grids from the User Interface panel, is the the distance from average price.
Management: The algorithm distributes the capital for all orders depending on the amount fator, for example 1.1% of amount factor adds 10% over the previus order.
Stop Loss: The algorithm place the stopn using distance from the last lower / upper grid depending on the position side.
USES
Indispensable research and backtesting tool for those using bots for their investments. The algorithm produces a backtesting of the strategy for past history. It is used by professional traders to understand if this strategy has been profitable on a market and what parameters to use for bots using this strategy, only binance futures assets supported.
If you would like to develop your own algorithm with customized conditions based on a grid strategy, please contact us.
If you need help in using this tool, please contact us without hesitation.

Percentage Range IndicatorThe Percentage Range Indicator is useful for assessing the volatility of pairs for percentage-based grid bots. The higher the percentage range for a given time period, the more trades a grid bot is likely to generate in that period. Conversely, a grid bot can be optimised by using grids that are less than the Percentage Range Indicator value.
I have been using the Percentage Range Indicator based on the one hour time period and 168 periods of smoothing (seven days based on one-hour periods).
Enjoy.

TTP AF Sim ProThis indicator helps you visualise, practice, manage and automatically add funds to DCA deals that are in negative.
Multiple factors factors are relevant when trying to exit a bad deal:
How much funds are invested
What's the current average position price
How far the price has already dropped from that average
Is the price bouncing significantly and frequently to the upside providing multiple opportunities to exit or is it still a free-falling knife dumping heavy?
What are your TP % expectations
This indicator allows you to enter all these parameters visualising them all together in a single chart. The chart will show you based on all this information how much funds you would have required to exit in profit and rescue the deal in green. It will also flag if the exit strategy would have failed by plotting a red label indicating all the times where the TP wouldn't have been reached.
The exit strategies
In this pro version you have access to edit all settings and the added ability to use an external indicator as source:
Custom external indicator as source
Relative Strength Index (RSI)
Commodity Channel Index (CCI)
Money Flow Index (MFI)
Bollinger Bands (BB)
Automated Add Funds-alert
With this indicator you can also add funds to the deals automatically:
Every time the conditions are true an alert is sent
Add Bot ID and Email Token for the deals
Select automatically calculated volume or your own custom
Tweak your exit strategy to your liking and add your Bot ID and Email Token to automatically add funds to your open deals.

TTP AF SimThis indicator helps you visualise, practice, manage and automatically add funds to DCA deals that are in negative.
Multiple factors factors are relevant when trying to exit a bad deal:
How much funds are invested
What's the current average position price
How far the price has already dropped from that average
Is the price bouncing significantly and frequently to the upside providing multiple opportunities to exit or is it still a free-falling knife dumping heavy?
What are your TP % expectations
This indicator allows you to enter all these parameters visualising them all together in a single chart. The chart will show you based on all this information how much funds you would have required to exit in profit and rescue the deal in green. It will also flag if the exit strategy would have failed by plotting a red label indicating all the times where the TP wouldn't have been reached.
The exit strategies
In this basic version you have access to well tested and pre-defined conditions with the following indicators:
Relative Strength Index (RSI)
Commodity Channel Index (CCI)
Money Flow Index (MFI)
Bollinger Bands (BB)
Automated Add Funds-alert
With this indicator you can also add funds to the deals automatically:
Every time the conditions are true an alert is sent
Add Bot ID and Email Token for the deals
Select automatically calculated volume or your own custom
Select exit strategy and add your Bot ID and Email Token to automatically add funds to your open deals.

3RSI 3CCI BB 5orders DCA strategy+This strategy is just an attempt to find the indicator values for the trading bot service that I use (link in profile). Due to the use of the “request.security” function in the code, the indicators can be redrawn, but this is not important in history. The strategy used only 5 orders for the "DCA" - bot, located at the same distance in the price overlap range. I only use this strategy when trading in pairs against bitcoin.
Эта стратегия – просто попытка подобрать значения индикаторов для сервиса торговых ботов, который я использую (ссылка в профиле). Из-за использования в коде функции «request.security» возможна перерисовка индикаторов, но на истории это не важно. В стратегии использовано всего 5 ордеров для «DCA» - бота, находящихся на одинаковом расстоянии в диапазоне перекрытия цены. Я использую данную стратегию только при торговле в парах к биткоину.

Premium ScalperThe strategy works with a combination of a number of different factors, including:
- Volume
- Moving averages
- Volatility
- RSI
This strategy generates long and short signals based on volume movements, moving averages and RSI. By combining other algorithms, low volatility periods can be filtered out.
The best results can be achieved by pairing the indicator with a bot through 3Commas and using a diversification strategy. This way you spread your risk over different pairs and you therefore also have a great chance of taking big moves.
The strategy results we display are results WITHOUT leverage. It is therefore also possible to only long on spot with this strategy, but for optimal results a trading bot link is required.
The settings we have used for these results are an order size of 100% with a 0.08% commission size.
Side note: This indicator does NOT use repainting!
We offer the possibility to try the indicator for free for 7 days.

Scalping Trading System ALERT Crypto and StocksThis is the alert version of the strategy with the same name.
Indicators
SImple Moving Average
Exponential Moving Average
Keltner Channels
MACD Histogram
Stochastics
Rules for entry
long= Close of the candle bigger than both moving averages and close of the candle is between the top and bot levels from Keltner . At the same time the macd histogram is negative and stochastic is below 50.
short= Close of the candle smaller than both moving averages and close of the candle is between the top and bot levels from Keltner . At the same time the macd histogram is positive and stochastic is above 50.
Rules for exit
We exit when we meet an opposite reverse order.
This strategy has no risk management inside, so use it with caution !

CDC Action Zone - 3Commas AlertCDC Action Zone, The well know indicator using EMA 12 and EMA 26.
When EMA 12 crosses EMA 26 will be a signal to trade.
You can change EMA that you want from settings.
This indicator work with 3Commas - Crypto DCA Bot . (Tradingview custom signal)
You can get a "BOT ID" and "Email token" from 3Commas when you create a bot.
Add into text box in indicator's settings.
After that create alert in Tradingview
Check webhook and using Url below for send signals to 3Commas bot.
3commas.io
This indicator will alert 40 Symbols at one time. (Tradingview set max symbols at 40)
If you want to alert more than 40 symbols, you can change symbols from settings and create new alert.

DiscordWebhookFunctionLibrary "DiscordWebhookFunction"
discordMarkdown(_str, _italic, _bold, _code, _strike, _under) Convert string to markdown formatting User can combine any function at the same time.
Parameters:
_str : String input
_italic : Italic
_bold : Bold
_code : Code markdown
_strike : Strikethrough
_under : Underline
Returns: string Markdown formatted string.
discordWebhookJSON(_username, _avatarImgUrl, _contentText, _bodyTitle, _descText, _bodyUrl, _embedCol, _timestamp, _authorName, _authorUrl, _authorIconUrl, _footerText, _footerIconUrl, _thumbImgUrl, _imageUrl) Convert data to JSON format for Discord Webhook Integration.
Parameters:
_username : Override bot (webhook) username string / name,
_avatarImgUrl : Override bot (webhook) avatar by image URL,
_contentText : Main content page message,
_bodyTitle : Custom Webhook's embed message body title,
_descText : Webhook's embed message body description,
_bodyUrl : Webhook's embed body direct link URL,
_embedCol : Webhook's embed color,
_timestamp : Timestamp,
_authorName : Webhook's embed author name / title,
_authorUrl : Webhook's embed author direct link URL,
_authorIconUrl : Webhook's embed author icon by image URL,
_footerText : Webhook's embed footer text / title,
_footerIconUrl : Webhook's embed footer icon by image URL,
_thumbImgUrl : Webhook's embed thumbnail image URL,
_imageUrl : Webhook's embed body image URL.
Returns: string Single-line JSON format

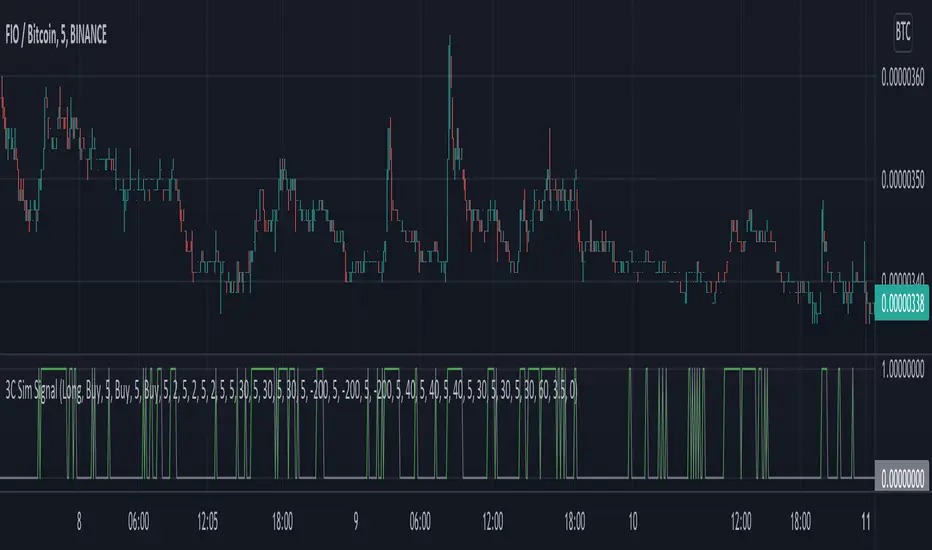
3C Sim SignalThis indicator offers the same deal start conditions available on Backtest script but now as an external signal so you can not only backtest but also set up alerts.
You can use the backtest script to backtest this indicator as an external signal and then once happy with the backtest results send directly tradingview alerts to your own bots on any exchange.
It supports most of the deal start conditions currently available for DCA bots on binance.com for example:
- TV technical ratings: buy, sell, strong buy, strong sell.
- RSI
- MFI
- CCI
- Ultimate Oscilator
- QFL
- min volume filter
Once added to the chart it will plot one when the deal start condition is true and zero when is not.
The conditions can be used in long or short strategy mode.
The biggest advantage compared to using it separately from the DSC already available in the backtest script is that because this is a separated study it will perform faster than the backtest and it resolves repainting issues. This two aspects make these indicator better suited for real time trading while still being able to connect to the backtest as an external indicator therefore still backtestable.
Now you can backtest symbols on any exchange and once your strategy is ready you then can send alerts directly to your bots.
GEMA-Indicador por Neil-------------------
DESCRIPTION
GEMA-INDICATOR is a indicator based on SMA, EMA, WMA, RMA that considers elements such as ADX, DMI, RSI, stochastic, Stoploss, Takeprofit, angles and values at present point.
HOW DOES IT WORK
The component works as an assistant to which you configure the previous elements and you see the performance that it offers you, in such a way that you pass that configuration to GEMA-INDICATOR so that you can receive alerts and do visual trading with notifications or automated trading by sending messages to platforms like 3Commas.
WHY USE IT
The resource operates with one of the most important strategies in the market, which is the price tracking line, which means that if prices go up, we follow it, if prices go down, we follow it; in this way you do not need to make large investments as is often the case with pure BOTs, which require large reserves for security orders.
HOW TO USE IT
Press the "Indicators" option, go to the "Public Library" segment, write the name "GEMA-Indicador por Neil", double click on the record in question and you will have it added in your work panel, now, it only remains to use it and configure its parameters.
-------------------
DESCRIPCIÓN
GEMA-INDICADOR en un indicador basado en SMA, EMA, WMA, RMA que considera elementos como ADX, DMI, RSI, Estocastico, Stoploss, Takeprofit, ángulos y valores a punto presente.
COMO FUNCIONA
El componente funciona como un asistente al que vas configurando lo elementos anteriores y vas viendo el rendimiento que te ofrece, de manera tal, que pases esa configuración a GEMA-INDICADOR para que puedas recibir alertas y hagas trading visual con notificaciones o trading automatizado enviando mensajes a plataformas como 3Commas.
POR QUÉ USARLO
El recurso opera con una de las estrategias mas importantes del mercado, que es la linea de seguimiento de precio, lo que significa que si los precios suben, lo seguimos, si los precios bajan, lo seguimos; de esta manera no necesita realizar grandes inversiones como suele ocurrir con los BOT puros, que exigen grandes reservas para las ordenes de seguridad.
COMO USARLO
Presione la opción "Indicadores", ubíquese en el segmento "Libreria Publica", escriba el nombre "GEMA-Indicador por Neil", haga doble clic sobre el registro en cuestión y lo tendrá agregado en su panel de trabajo, ahora, solo resta usarlo y configurar sus paramertos.

GEMA-Estrategia por neil-------------------
DESCRIPTION
GEMA-STRATEGY is a strategy generator based on SMA, EMA, WMA, RMA that considers elements such as ADX, DMI, RSI, stochastic, Stoploss, Takeprofit, angles and values at present point.
HOW DOES IT WORK
The component works as an assistant to which you configure the previous elements and you see the performance that it offers you, in such a way that you pass that configuration to GEMA-INDICATOR so that you can receive alerts and do visual trading with notifications or automated trading by sending messages to platforms like 3Commas.
WHY USE IT
The resource operates with one of the most important strategies in the market, which is the price tracking line, which means that if prices go up, we follow it, if prices go down, we follow it; in this way you do not need to make large investments as is often the case with pure BOTs, which require large reserves for security orders.
HOW TO USE IT
Press the "Indicators" option, go to the "Public Library" segment, write the name "GEMA-Estategia por Neil", double click on the record in question and you will have it added in your work panel, now, it only remains to use it and configure its parameters.
-------------------
DESCRIPCIÓN
GEMA-ESTRATEGIA en un generador de estrategias basado en SMA, EMA, WMA, RMA que considera elementos como ADX, DMI, RSI, Estocastico, Stoploss, Takeprofit, ángulos y valores a punto presente.
COMO FUNCIONA
El componente funciona como un asistente al que vas configurando lo elementos anteriores y vas viendo el rendimiento que te ofrece, de manera tal, que pases esa configuración a GEMA-INDICADOR para que puedas recibir alertas y hagas trading visual con notificaciones o trading automatizado enviando mensajes a plataformas como 3Commas.
POR QUÉ USARLO
El recurso opera con una de las estrategias mas importantes del mercado, que es la linea de seguimiento de precio, lo que significa que si los precios suben, lo seguimos, si los precios bajan, lo seguimos; de esta manera no necesita realizar grandes inversiones como suele ocurrir con los BOT puros, que exigen grandes reservas para las ordenes de seguridad.
COMO USARLO
Presione la opción "Indicadores", ubíquese en el segmento "Libreria Publica", escriba el nombre "GEMA-Estrategia por Neil", haga doble clic sobre el registro en cuestión y lo tendrá agregado en su panel de trabajo, ahora, solo resta usarlo y configurar sus paramertos.

Mid to High daily % - MA & ThresholdPurpose of this script is to provide a metric for comparing crypto volatility in terms of the % gain that can be garnished if you buy the midpoint price of the day and sell the high***. I'm specifically using bots that buy non-stop. This metric makes it easy to compare crypto coins while also providing insight on what a take profit % should be if I want to be sure it closes often instead of getting stuck in a position.
Added a few moving averages of (Mid-range to High Daily %). When these lines starts to trend down, it's time to lower the take profit % or move on to the next coin.
Decided to add a threshold so I could easily mark where I think the (Mid-range to High Daily %) is for most days.
Ex. I can mark 10% threshold and can eyeball roughly ~75% of the days in the past month or so were at or above that level. Then I know I have plenty volatility for a bot taking 5% profit. Also if you have plenty of periodic poke-through that month (let's say once a week) you might argue that you can set it to 7% if you're willing to wait about that long. Either way this metric is conservative because it is only the middle of the range to the high, a less conservative version might provide the % gain if you bought the day low and sold the day high.
***Since this calculation only takes the middle of the range and the high of the day into account, red days are volatile against a buyer but to your advantage if you are a seller. BUT if you have plenty of safety buy orders this volatility in price only means your total purchase volume increases and when/if you reach a take profit level you sell more there.
Would like to upgrade and add a separate MA line for green days and a separate MA line for red days to discern if that particular coin has a bias. Also would like to include some statistics on how many candles are above or below threshold for a certain period instead of eyeballing.
