Cross Exchange ChangeThe indicator itself looks at different Exchanges and compares the change in price of them. If one spikes up, we go long with it as we assume our Exchange will follow. Vice versa for short.
Değişim Yüzdesi (ROC)
PTF_VWMA Percentage ChangeThis Indicator plots the Percentage change of the Volume Weighted Moving Average.
It takes the VWMA length and calculates the Volume Weighted Moving Average over that period, it then "Looks Back" and calculates the percentage change from that point to the current point.
This is helpful in seeing if the price has swung outside of a normal range that you can determine by adjusting an upper and lower horizontal line. These lines are just guides.
In the case of a pump and dump, the VWMA Percentage change line would swing wildly upwards and then crash back downwards, after the coin stablises again then the VWMA % Change would fit back into your "Safe Trading Zone"
Feel free to you it as you wish and if you feel generous then by all means, donate some LTC.
If you don't have PT Feeder and have now decided to get it, please use my affiliate link below.
Created 2018 - by @Squiggles#8806
LTC Tip Jar: LX4bUBdjiRPsagUbZoAczSGgDC4YqTJL7w
Pt Feeder affililiate link: cryptoprofitbot.com

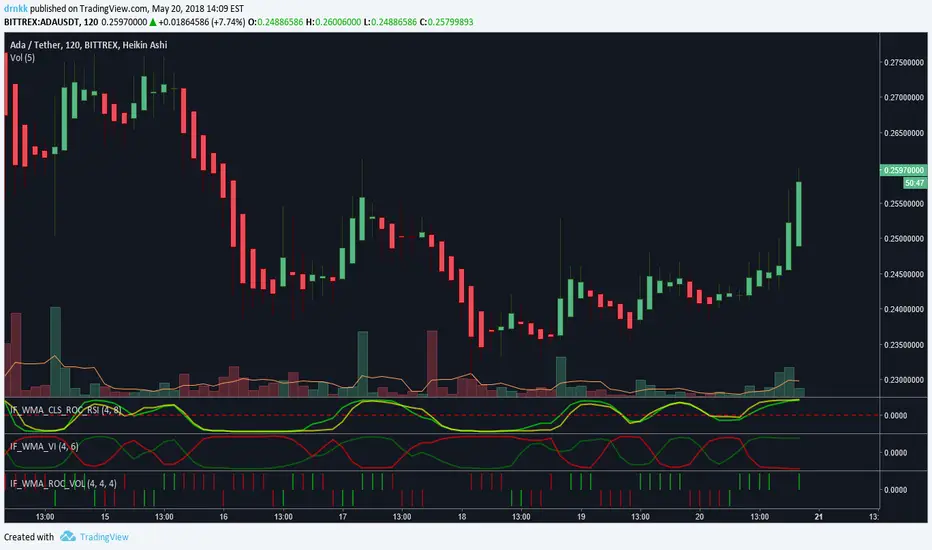
Inverse Fisher WMA Smoothed Price ROC and RSI by drnkkInverse Fisher WMA Smoothed Price ROC and RSI by drnkk

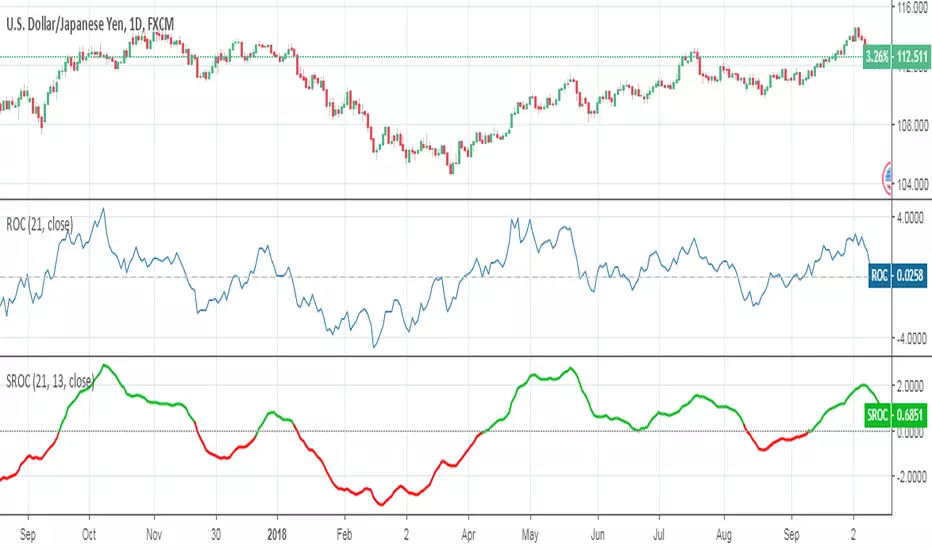
Smoothed Rate of ChangeSmoothed Rate of Change indicator script.
This indicator was originally developed by Fred G. Schutzman.
Tick Line Momentum OscillatorTick Line Momentum Oscillator indicator script. This indicator was originally developed by Daniel E. Downing (Stocks & Commodities, V.12:1 (42-44): Using The Tick In A Short-Term Indicator).

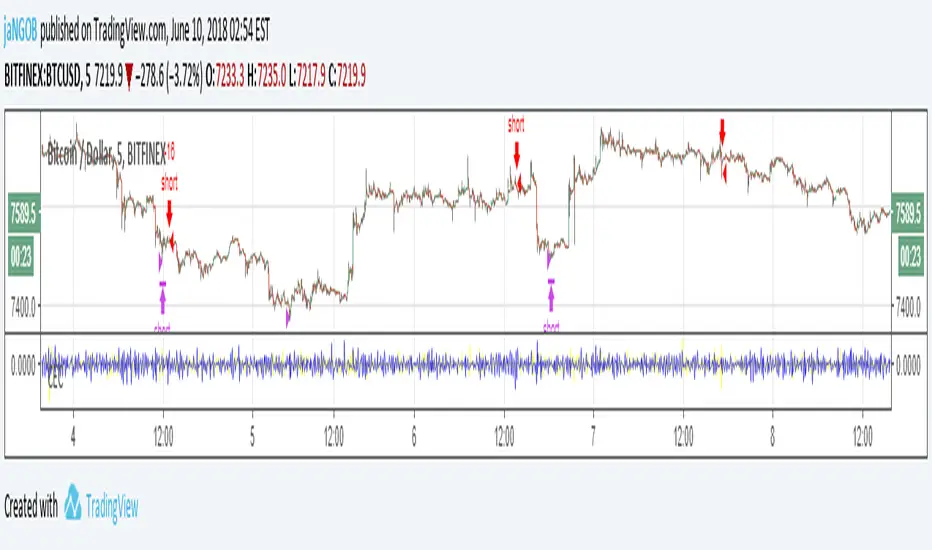
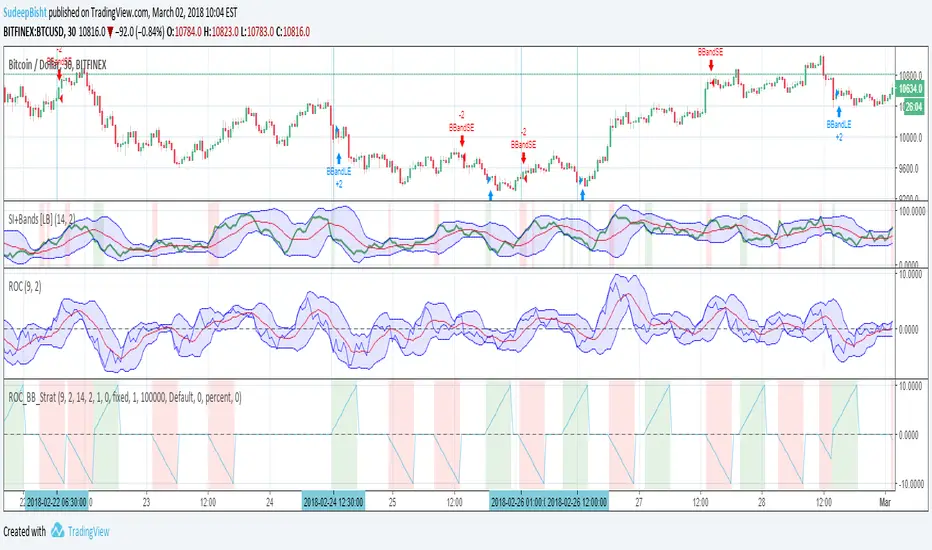
Sb_Rate_Of_Change_BB_Band_strategy Version 1.0The strategy couples the concept of rate of change along with the Bollinger bands.
Along with it LazyBear's RSI/MFI with Volatility Indicator is also taken to reduce the number of trades and improve efficiency.
Strategy (in Layman terms):
If in the past 10 candles RSI/MFI with Volatility Indicator has printed a red/green colour and the roc has gone above/below the Bollinger bands then the short/long order is placed respectively.
Message if you think of any modifications/ enhancements/ any opportunities. :)
Donations/Tips... :) -
BTC: 1BjswGcRR6c23pka7qh5t5k56j46cuyyy2
ETH: 0x64fed71c9d6c931639c7ba4671aeb6b05e6b3781
LTC: LKT2ykQ8QSzzfTDB6Tnsf12xwYPjgq95h4

AnimalHunter v0.1This script is for checking the top and bottom at on time.
You can change buy/sell indicator threshold value and index bars.
I'm planning that will add some of interesting features at the future,
At this time, this script is providing only for some people. If you want, please leave comment to this page.
Recommend(and Confirmed that is work enough) Timeframe is 30m or 1hour
Recommend(and Confirmed that is work enough) Ticker Symbol is BITFLYER:BTCJPY
Good tips
----
If you (increase sell|decrease buy) threshold values, my indicators going to more strict to entry position. It means get more accurate(decrease risk), but may loss some good entry point.
If you (decrease sell|increase buy) threshold values, my indicators going to more loose to entry position. It means get more entry times(increase risk but may increase profits), but may loss huge of money.
This is a recommend environment, but maybe you can use this indicator if you change some of settings in my indicator.

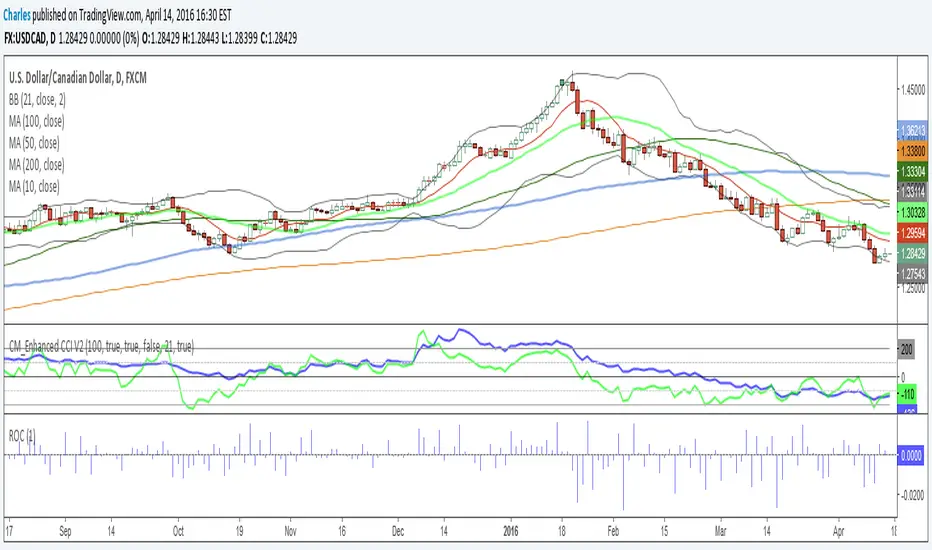
Forex strength meterCalculates the strength of a particular currency taking into account it's rate of change (% price change in a period) in all correlated and anti-correlated pairs. For instance, when looking for USD strength we will add ROC for USDCAD, USDCHF and USDJPY while subtract AUDUSD, EURUSD, GBPUSD and NZDUSD.
After ROC step, one can smooth the result using EMA, or MACD.
As the script needs to fetch values from multiple currencies it isn't the fastest one, but it gets its job done.
Important: Only major currencies (AUD, CAD, CHF, EUR, GBP, JPY, NZD and USD) are considered.

Hersheys CoCoThis is my variation of the Correlation Coefficient and I call it "Hershey's CoCo". The indicator identifies very specific Stock, Sector and Market pressures on whatever symbol you are evaluating.
If interested, follow me and send me requests to evaluate your stock or sector as I refine this tool.
***********************************************
Price movement does not happen in isolation.
Stocks are held by various "containers" that can be traded independently and can affect the price of each stock. The most important of those containers are Sector and Market, while others include Industry, MarketCap and others.
For example, Market is simply the top level representation of all stocks, or the sea that carries, or sinks, all ships. You can monitor this level by looking at various indexes, ETFs and/or Funds. I use "VTI", the Vanguard Total Stock Market ETF.
Sectors can be monitored using any number of containers, like Vanguard Sector Index Funds or ProShares Ultra Sector Indexes. I use the S&P SPDR Sector Funds. A list of those are listed below.
Most of the techniques and indicators that deal with correlation and sector/market comparisons are not very detailed. Many simply overlay one price series over another, while you tediously follow the price lines from left to right trying to judge movement.
Another critical piece missing from other compare tools is normalizing each data series. Hershey's CoCo does this, so you can have confidence that the alerts you see are based on accurate comparisons at every level.
***********************************************
So let's get to the details! Hershey's CoCo currently compares 2 containers, so for this discussion we'll do Stock to Sector. You'll see arrows above and below some ticks of the price chart, plus a faint red or green background color.
Very Bull = Blue Arrow = Stock and Sector prices are up, Stock price up more
Bull = Green Arrow = Stock and Sector prices are up, Sector price up more
Bear = Red Arrow = Stock and Sector prices are down, Sector price down more
Very Bear = Black Arrow = Stock and Sector prices are down, Stock price down more
Neutral = No Arrow = Stock and Sector price movement equal
Arrow Length = Strength (the longer the arrow the bigger the difference)
Green Background = Bull = Above zero Simple Moving Average of all arrow values
Red Background = Bear = Below zero Simple Moving Average of all arrow values
To review, the Blacks and Blues are the HEAVIEST pressure... the LONGER the STRONGER!

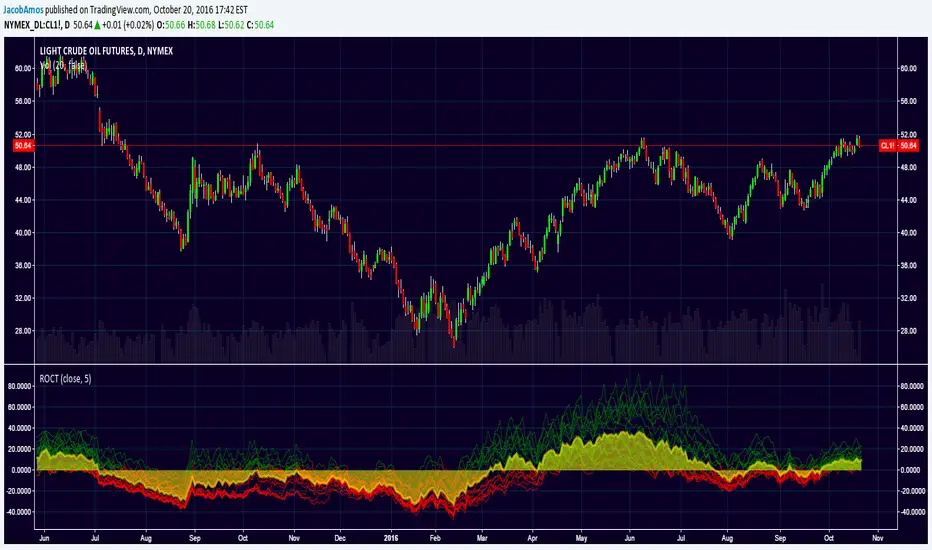
ROC TideAdds some depth to the traditional rate of change (ROC) indicator. Instead of just having one ROC line with a single lookback period, this takes a minimum lookback period, n , and plots 20 ROC lines with lookback periods of n, 2n, 3n, ..., 20n . These lines will appear green when greater than zero, red when less than zero, and yellow when equal to zero by default.
Then it plots the average of those 20 ROC's as a yellow filled area so as to make it easier to see where the balance (or "tide") of the ROC waves are located.
GBPNZD ROC RF count strategyCode takes six pairs that are highly correlated to GBPNZD and determines if their ROC's are increasing or decreasing. If a pair has an increasing ROC it is given a 1, if decreasing a -1. The numbers are all added up (this is similar to a count for counting cards in blackjack). If the count goes positive the strategy enters a long position, if negative a short position.
Code is tuned for GBPNZD for 1HR chart. Returns $97 on an initial balance of $100 (if I am reading Tradingview Tester correctly)
*** Should work for GBPJPY, its has the same correlated pairs
Comments welcomed

JPY GBP ROCsRate of change of most volatile JPY and GBP pairs. All pairs ending in JPY are red except GBPJPY (colored yellow --currently most volatile 7/2016). GBPNZD is blue, the other GBP pairs are green, lime and teal. GBPJPY and GBPNZD are my favorite day trading / swing trading pairs. This script allows me to see the action of the most volatile and liquid pairs on one screen. JPY pairs (ex-GBPJPY) are all red so that I see the flow of JPY not so much each pair and its name. Global movement of JPY is what I am after. Same for the coloring of GBP pairs as green expect GBPNZD as blue. ***** EURGBP is plotted as an opposite (with a negative in front of its sma. EURGBP is extremely correlated to GBPNZD, I decided to plot it also.


Rate Of Change - Absolute ValueMeasures the period's change in terms of the instrument's value (e.g. pip, dollar, etc) instead of as a percentage. I generally use it on a daily time frame with a period=1 to see how the current day's move compares with prior days' moves in order to gain a perspective into how this move ranks historically.
BUY & SELL PRESSURE by RegressionBUY & SELL PRESSURE by Regression Analysis at candle price/volume (Rate-Of-Change)
Ver. 3 By Ricardo M Arjona @XeL_Arjona
DISCLAIMER:
The Following indicator/code IS NOT intended to be a formal investment advice or recommendation by the author, nor should be construed as such. Users will be fully responsible by their use regarding their own trading vehicles/assets.
The embedded code and ideas within this work are FREELY AND PUBLICLY available on the Web for NON LUCRATIVE ACTIVITIES and must remain as is.
WHAT'S THIS?
This is my 3rd. revision of the original implementation for AmiBroker by Karthik Marar's of it's BUY AND SELL PRESSURE INDICATORS but this time, constructed under a complete REGRESSIVE ANALYSIS premise based in Rate Of Change (A kind of Slope but measured in % Performance).
Some minimal adaptation's (and cleaning) have been made:
Instead of simple Range calculation at price, Rate Of Change (Regressive) is used.
Oscillator of Pressure can be deactivated in favor of a simple RoC Cumulative Pressures at candle.
Oscillator can read Volume data from external tickers for accurate Index calculation. ( NYA can use TVOL as example.)
Code is small, cleaner and faster =) !
Cheers!
Any feedback will be welcome...
@XeL_Arjona

DecisionPoint Price Momentum Oscillator [LazyBear]The DecisionPoint Price Momentum Oscillator (PMO) is an oscillator based on a Rate of Change calculation that is smoothed twice with custom exponential moving averages. Because the PMO is normalized, it can also be used as a relative strength tool.
PMO can be used in many ways:
- PMO can be used to determine the OB/OS state. While the +2.5 to -2.5 is the usual range for broad stock market indexes, each price index will have its own “signature” range. You may have to tune this for your instrument.
- PMO triggers buy/sell on signal crossovers and ZERO crossovers.
- Common patterns like BullKiss, BearKiss are useful to track. See the link below for more info.
- Divergences.
- Histo-only mode that can be used similar to MACD-Histo.
I have exposed all params as configurable. Have fun tuning :) Don't forget to share what you found for your instrument.
More Info:
stockcharts.com
List of my public indicators: bit.ly
List of my app-store indicators: blog.tradingview.com
Some Sample Charts:
TWTR:
MSFT:
GOOGL:

Insync Index [LazyBear]BB Support + Histo mode
-------------------------------
Code: pastebin.com
Show enclosing BB
Show Insync as Histo:
v02 - Configurable levels
---------------------------------
Small update to allow configuring the 95/75/25/5 levels.
Latest source code: pastebin.com
v01 - orginal description
---------------------------------
Insync Index, by Norm North, is a consensus indicator. It uses RSI, MACD, MFI, DPO, ROC, Stoch, CCI and %B to calculate a composite signal. Basically, this index shows that when a majority of underlying indicators is in sync, a turning point is near.
There are couple of ways to use this indicator.
- Buy when crossing up 5, sell when crossing down 95.
- Market is typically bullish when index is above 50, bearish when below 50. This can be a great confirmation signal for price action + trend lines.
Also, since this is typical oscillator, look for divergences between price and index.
Levels 75/25 are early warning levels. Note that, index > 75 (and less than 95) should be considered very bullish and index below 25 (but above 5) as very bearish. Levels 95/5 are equivalent to traditional OB/OS levels.
The various values of the underlying components can be tuned via options page. I have also provided an option to color bars based on the index value.
More info: The Insync Index by Norm North, TASC Jan 1995
drive.google.com
List of my free indicators: bit.ly
List of my app-store indicators: blog.tradingview.com
(Support doc: bit.ly)

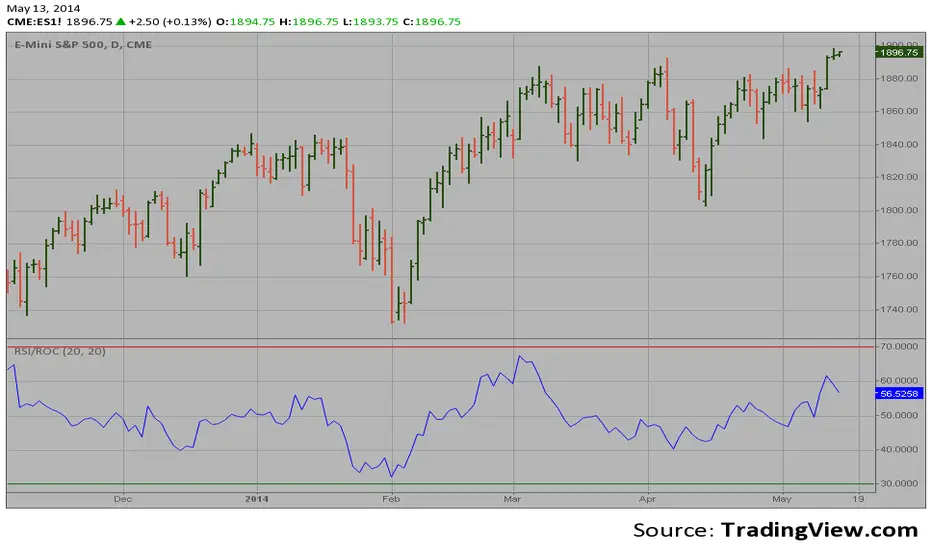
RSI based on ROC This is the new-age indicator which is version of RSI calculated upon
the Rate-of-change indicator.
The name "Relative Strength Index" is slightly misleading as the RSI
does not compare the relative strength of two securities, but rather
the internal strength of a single security. A more appropriate name
might be "Internal Strength Index." Relative strength charts that compare
two market indices, which are often referred to as Comparative Relative Strength.
And in its turn, the Rate-of-Change ("ROC") indicator displays the difference
between the current price and the price x-time periods ago. The difference can
be displayed in either points or as a percentage. The Momentum indicator displays
the same information, but expresses it as a ratio.