Smart Impulse Exhaustion Finder (ATR + ADX Filter)
Smart Impulse Exhaustion Finder (ATR + ADX Filter)
This advanced script helps you spot potential trend exhaustion points exactly where impulsive moves may lose strength.
It automatically combines multiple conditions:
✅ Identifies fresh swing highs and lows using a smart lookback range.
✅ Confirms strong price extension with a minimum ATR distance from the previous swing.
✅ Uses RSI extremes, volume spikes, and candle wick rejection to detect signals only when at least two out of three exhaustion factors align.
✅ Filters out false signals during sideways chop using an ADX trend strength filter.
✅ Ignores noise candles like dojis by requiring a clear minimum body size.
This makes the tool flexible for catching late-stage trend impulses that might be due for a pullback or reversal — ideal for trailing stop strategies, partial profit taking, or hunting reversal setups on crypto, forex or stocks.
How to use
📌 Tip: This is a sniper-type tool that can catch the very start of a reversal.
Therefore, when trading its signals, it’s strongly recommended to use a Risk:Reward ratio of at least 1:3 — especially for crypto markets.
The idea is simple:
Look for exhaustion signals at fresh swing highs for potential short pullbacks.
Or at fresh swing lows for potential long reversals.
Combine with your own trend and context tools.
Always test thoroughly before live trading.
Inputs
🔹 Extremum Lookback: Defines how far back to check for fresh highs/lows.
🔹 ATR Threshold: Controls the minimum impulse distance.
🔹 ADX Filter: Ensures signals only appear in meaningful trending conditions.
🔹 Body and Wick Filters: Reduce noise by rejecting tiny candles and highlighting clear rejection tails.
Disclaimer
⚠️ This script is for educational purposes only and does not constitute financial advice.
Trade responsibly — always use proper risk management and test before deploying in live conditions.
Volatilite

Volume-Confirmed Price Momentum# **Volume-Confirmed Price Momentum (VCPM) Indicator**
## **🔍 Overview**
Introducing the **Volume-Confirmed Price Momentum (VCPM)**, a sophisticated dual-metric indicator designed to identify high-probability momentum moves by analyzing the relationship between price action and volume dynamics. This indicator combines correlation analysis with volume strength validation to filter out weak signals and highlight institutional-backed movements.
---
## **⚙️ Core Mechanics**
**Price-Volume Correlation Engine:**
- Calculates real-time correlation between price movements and volume
- Configurable lookback period (default: 8 bars)
- Option to use price changes or absolute values
- Correlation range: -1.0 (perfect negative) to +1.0 (perfect positive)
**Volume Strength Analyzer:**
- Compares current volume against its moving average (default: 128 periods)
- Normalizes volume ratio to 0-1 scale for consistent interpretation
- Identifies when volume significantly exceeds historical norms
---
## **📊 Signal Generation**
### **🟢 Bullish Confirmation Signal**
**Trigger:** Positive correlation > 0.6 + Volume ratio > 0.5
- Price and volume moving in harmony upward
- Above-average volume confirms the move
- Indicates strong institutional buying interest
### **🔴 Bearish Confirmation Signal**
**Trigger:** Negative correlation < -0.6 + Volume ratio > 0.5
- Price declining with increasing volume
- Suggests distribution or institutional selling
- High-confidence bearish momentum
---
## **🎯 Trading Applications**
**Breakout Validation:**
Filter false breakouts by requiring volume confirmation before entering positions.
**Trend Continuation:**
Identify when existing trends have strong volume backing for continuation plays.
**Distribution Detection:**
Spot potential tops when price struggles despite high volume (negative correlation).
**Entry Timing:**
Built-in alert system notifies when both conditions align for optimal entry points.
---
## **🔧 Customization Features**
- **Correlation Period:** Adjust sensitivity (2-500 bars)
- **Volume Averaging:** Modify volume comparison timeframe
- **Alert Thresholds:** Fine-tune correlation and volume ratio triggers
- **Visual Options:** Toggle volume histogram display
- **Price Source:** Choose from OHLC or custom sources
---
## **💡 Why VCPM Works**
Traditional momentum indicators often generate false signals during low-volume periods. VCPM solves this by requiring **dual confirmation**: price momentum must be supported by corresponding volume activity. This approach:
- Reduces whipsaws and false breakouts
- Identifies institutional participation
- Provides higher conviction trade setups
- Works across all timeframes and markets
---
## **📈 Best Use Cases**
✅ **Crypto markets** (high volatility, volume-driven)
✅ **Stock breakouts** (earnings, news events)
✅ **Forex majors** (during high-impact news)
✅ **Futures trading** (momentum confirmation)
---
## **⚠️ Important Notes**
- Works best in liquid markets with consistent volume data
- Combine with support/resistance levels for enhanced accuracy
- Consider market context (trending vs. ranging conditions)
- Not recommended for extremely low-volume periods
---
## **🚀 Getting Started**
1. Add VCPM to your chart as a sub-panel indicator
2. Configure correlation threshold (start with 0.6)
3. Set volume ratio threshold (start with 0.5)
4. Enable alerts for automated signal detection
5. Backtest on your preferred timeframe and instrument
---
**Ready to enhance your momentum trading with volume confirmation? Try VCPM and experience the difference institutional-backed signals can make in your trading results.**
*Available in Pine Script v6 - Compatible with all TradingView accounts*

VoVix DEVMA🌌 VoVix DEVMA: A Deep Dive into Second-Order Volatility Dynamics
Welcome to VoVix+, a sophisticated trading framework that transcends traditional price analysis. This is not merely another indicator; it is a complete system designed to dissect and interpret the very fabric of market volatility. VoVix+ operates on the principle that the most powerful signals are not found in price alone, but in the behavior of volatility itself. It analyzes the rate of change, the momentum, and the structure of market volatility to identify periods of expansion and contraction, providing a unique edge in anticipating major market moves.
This document will serve as your comprehensive guide, breaking down every mathematical component, every user input, and every visual element to empower you with a profound understanding of how to harness its capabilities.
🔬 THEORETICAL FOUNDATION: THE MATHEMATICS OF MARKET DYNAMICS
VoVix+ is built upon a multi-layered mathematical engine designed to measure what we call "second-order volatility." While standard indicators analyze price, and first-order volatility indicators (like ATR) analyze the range of price, VoVix+ analyzes the dynamics of the volatility itself. This provides insight into the market's underlying state of stability or chaos.
1. The VoVix Score: Measuring Volatility Thrust
The core of the system begins with the VoVix Score. This is a normalized measure of volatility acceleration or deceleration.
Mathematical Formula:
VoVix Score = (ATR(fast) - ATR(slow)) / (StDev(ATR(fast)) + ε)
Where:
ATR(fast) is the Average True Range over a short period, representing current, immediate volatility.
ATR(slow) is the Average True Range over a longer period, representing the baseline or established volatility.
StDev(ATR(fast)) is the Standard Deviation of the fast ATR, which measures the "noisiness" or consistency of recent volatility.
ε (epsilon) is a very small number to prevent division by zero.
Market Implementation:
Positive Score (Expansion): When the fast ATR is significantly higher than the slow ATR, it indicates a rapid increase in volatility. The market is "stretching" or expanding.
Negative Score (Contraction): When the fast ATR falls below the slow ATR, it indicates a decrease in volatility. The market is "coiling" or contracting.
Normalization: By dividing by the standard deviation, we normalize the score. This turns it into a standardized measure, allowing us to compare volatility thrust across different market conditions and timeframes. A score of 2.0 in a quiet market means the same, relatively, as a score of 2.0 in a volatile market.
2. Deviation Analysis (DEV): Gauging Volatility's Own Volatility
The script then takes the analysis a step further. It calculates the standard deviation of the VoVix Score itself.
Mathematical Formula:
DEV = StDev(VoVix Score, lookback_period)
Market Implementation:
This DEV value represents the magnitude of chaos or stability in the market's volatility dynamics. A high DEV value means the volatility thrust is erratic and unpredictable. A low DEV value suggests the change in volatility is smooth and directional.
3. The DEVMA Crossover: Identifying Regime Shifts
This is the primary signal generator. We take two moving averages of the DEV value.
Mathematical Formula:
fastDEVMA = SMA(DEV, fast_period)
slowDEVMA = SMA(DEV, slow_period)
The Core Signal:
The strategy triggers on the crossover and crossunder of these two DEVMA lines. This is a profound concept: we are not looking at a moving average of price or even of volatility, but a moving average of the standard deviation of the normalized rate of change of volatility.
Bullish Crossover (fastDEVMA > slowDEVMA): This signals that the short-term measure of volatility's chaos is increasing relative to the long-term measure. This often precedes a significant market expansion and is interpreted as a bullish volatility regime.
Bearish Crossunder (fastDEVMA < slowDEVMA): This signals that the short-term measure of volatility's chaos is decreasing. The market is settling down or contracting, often leading to trending moves or range consolidation.
⚙️ INPUTS MENU: CONFIGURING YOUR ANALYSIS ENGINE
Every input has been meticulously designed to give you full control over the strategy's behavior. Understanding these settings is key to adapting VoVix+ to your specific instrument, timeframe, and trading style.
🌀 VoVix DEVMA Configuration
🧬 Deviation Lookback: This sets the lookback period for calculating the DEV value. It defines the window for measuring the stability of the VoVix Score. A shorter value makes the system highly reactive to recent changes in volatility's character, ideal for scalping. A longer value provides a smoother, more stable reading, better for identifying major, long-term regime shifts.
⚡ Fast VoVix Length: This is the lookback period for the fastDEVMA. It represents the short-term trend of volatility's chaos. A smaller number will result in a faster, more sensitive signal line that reacts quickly to market shifts.
🐌 Slow VoVix Length: This is the lookback period for the slowDEVMA. It represents the long-term, baseline trend of volatility's chaos. A larger number creates a more stable, slower-moving anchor against which the fast line is compared.
How to Optimize: The relationship between the Fast and Slow lengths is crucial. A wider gap (e.g., 20 and 60) will result in fewer, but potentially more significant, signals. A narrower gap (e.g., 25 and 40) will generate more frequent signals, suitable for more active trading styles.
🧠 Adaptive Intelligence
🧠 Enable Adaptive Features: When enabled, this activates the strategy's performance tracking module. The script will analyze the outcome of its last 50 trades to calculate a dynamic win rate.
⏰ Adaptive Time-Based Exit: If Enable Adaptive Features is on, this allows the strategy to adjust its Maximum Bars in Trade setting based on performance. It learns from the average duration of winning trades. If winning trades tend to be short, it may shorten the time exit to lock in profits. If winners tend to run, it will extend the time exit, allowing trades more room to develop. This helps prevent the strategy from cutting winning trades short or holding losing trades for too long.
⚡ Intelligent Execution
📊 Trade Quantity: A straightforward input that defines the number of contracts or shares for each trade. This is a fixed value for consistent position sizing.
🛡️ Smart Stop Loss: Enables the dynamic stop-loss mechanism.
🎯 Stop Loss ATR Multiplier: Determines the distance of the stop loss from the entry price, calculated as a multiple of the current 14-period ATR. A higher multiplier gives the trade more room to breathe but increases risk per trade. A lower multiplier creates a tighter stop, reducing risk but increasing the chance of being stopped out by normal market noise.
💰 Take Profit ATR Multiplier: Sets the take profit target, also as a multiple of the ATR. A common practice is to set this higher than the Stop Loss multiplier (e.g., a 2:1 or 3:1 reward-to-risk ratio).
🏃 Use Trailing Stop: This is a powerful feature for trend-following. When enabled, instead of a fixed stop loss, the stop will trail behind the price as the trade moves into profit, helping to lock in gains while letting winners run.
🎯 Trail Points & 📏 Trail Offset ATR Multipliers: These control the trailing stop's behavior. Trail Points defines how much profit is needed before the trail activates. Trail Offset defines how far the stop will trail behind the current price. Both are based on ATR, making them fully adaptive to market volatility.
⏰ Maximum Bars in Trade: This is a time-based stop. It forces an exit if a trade has been open for a specified number of bars, preventing positions from being held indefinitely in stagnant markets.
⏰ Session Management
These inputs allow you to confine the strategy's trading activity to specific market hours, which is crucial for day trading instruments that have defined high-volume sessions (e.g., stock market open).
🎨 Visual Effects & Dashboard
These toggles give you complete control over the on-chart visuals and the dashboard. You can disable any element to declutter your chart or focus only on the information that matters most to you.
📊 THE DASHBOARD: YOUR AT-A-GLANCE COMMAND CENTER
The dashboard centralizes all critical information into one compact, easy-to-read panel. It provides a real-time summary of the market state and strategy performance.
🎯 VOVIX ANALYSIS
Fast & Slow: Displays the current numerical values of the fastDEVMA and slowDEVMA. The color indicates their direction: green for rising, red for falling. This lets you see the underlying momentum of each line.
Regime: This is your most important environmental cue. It tells you the market's current state based on the DEVMA relationship. 🚀 EXPANSION (Green) signifies a bullish volatility regime where explosive moves are more likely. ⚛️ CONTRACTION (Purple) signifies a bearish volatility regime, where the market may be consolidating or entering a smoother trend.
Quality: Measures the strength of the last signal based on the magnitude of the DEVMA difference. An ELITE or STRONG signal indicates a high-conviction setup where the crossover had significant force.
PERFORMANCE
Win Rate & Trades: Displays the historical win rate of the strategy from the backtest, along with the total number of closed trades. This provides immediate feedback on the strategy's historical effectiveness on the current chart.
EXECUTION
Trade Qty: Shows your configured position size per trade.
Session: Indicates whether trading is currently OPEN (allowed) or CLOSED based on your session management settings.
POSITION
Position & PnL: Displays your current position (LONG, SHORT, or FLAT) and the real-time Profit or Loss of the open trade.
🧠 ADAPTIVE STATUS
Stop/Profit Mult: In this simplified version, these are placeholders. The primary adaptive feature currently modifies the time-based exit, which is reflected in how long trades are held on the chart.
🎨 THE VISUAL UNIVERSE: DECIPHERING MARKET GEOMETRY
The visuals are not mere decorations; they are geometric representations of the underlying mathematical concepts, designed to give you an intuitive feel for the market's state.
The Core Lines:
FastDEVMA (Green/Maroon Line): The primary signal line. Green when rising, indicating an increase in short-term volatility chaos. Maroon when falling.
SlowDEVMA (Aqua/Orange Line): The baseline. Aqua when rising, indicating a long-term increase in volatility chaos. Orange when falling.
🌊 Morphism Flow (Flowing Lines with Circles):
What it represents: This visualizes the momentum and strength of the fastDEVMA. The width and intensity of the "beam" are proportional to the signal strength.
Interpretation: A thick, steep, and vibrant flow indicates powerful, committed momentum in the current volatility regime. The floating '●' particles represent kinetic energy; more particles suggest stronger underlying force.
📐 Homotopy Paths (Layered Transparent Boxes):
What it represents: These layered boxes are centered between the two DEVMA lines. Their height is determined by the DEV value.
Interpretation: This visualizes the overall "volatility of volatility." Wider boxes indicate a chaotic, unpredictable market. Narrower boxes suggest a more stable, predictable environment.
🧠 Consciousness Field (The Grid):
What it represents: This grid provides a historical lookback at the DEV range.
Interpretation: It maps the recent "consciousness" or character of the market's volatility. A consistently wide grid suggests a prolonged period of chaos, while a narrowing grid can signal a transition to a more stable state.
📏 Functorial Levels (Projected Horizontal Lines):
What it represents: These lines extend from the current fastDEVMA and slowDEVMA values into the future.
Interpretation: Think of these as dynamic support and resistance levels for the volatility structure itself. A crossover becomes more significant if it breaks cleanly through a prior established level.
🌊 Flow Boxes (Spaced Out Boxes):
What it represents: These are compact visual footprints of the current regime, colored green for Expansion and red for Contraction.
Interpretation: They provide a quick, at-a-glance confirmation of the dominant volatility flow, reinforcing the background color.
Background Color:
This provides an immediate, unmistakable indication of the current volatility regime. Light Green for Expansion and Light Aqua/Blue for Contraction, allowing you to assess the market environment in a split second.
📊 BACKTESTING PERFORMANCE REVIEW & ANALYSIS
The following is a factual, transparent review of a backtest conducted using the strategy's default settings on a specific instrument and timeframe. This information is presented for educational purposes to demonstrate how the strategy's mechanics performed over a historical period. It is crucial to understand that these results are historical, apply only to the specific conditions of this test, and are not a guarantee or promise of future performance. Market conditions are dynamic and constantly change.
Test Parameters & Conditions
To ensure the backtest reflects a degree of real-world conditions, the following parameters were used. The goal is to provide a transparent baseline, not an over-optimized or unrealistic scenario.
Instrument: CME E-mini Nasdaq 100 Futures (NQ1!)
Timeframe: 5-Minute Chart
Backtesting Range: March 24, 2024, to July 09, 2024
Initial Capital: $100,000
Commission: $0.62 per contract (A realistic cost for futures trading).
Slippage: 3 ticks per trade (A conservative setting to account for potential price discrepancies between order placement and execution).
Trade Size: 1 contract per trade.
Performance Overview (Historical Data)
The test period generated 465 total trades , providing a statistically significant sample size for analysis, which is well above the recommended minimum of 100 trades for a strategy evaluation.
Profit Factor: The historical Profit Factor was 2.663 . This metric represents the gross profit divided by the gross loss. In this test, it indicates that for every dollar lost, $2.663 was gained.
Percent Profitable: Across all 465 trades, the strategy had a historical win rate of 84.09% . While a high figure, this is a historical artifact of this specific data set and settings, and should not be the sole basis for future expectations.
Risk & Trade Characteristics
Beyond the headline numbers, the following metrics provide deeper insight into the strategy's historical behavior.
Sortino Ratio (Downside Risk): The Sortino Ratio was 6.828 . Unlike the Sharpe Ratio, this metric only measures the volatility of negative returns. A higher value, such as this one, suggests that during this test period, the strategy was highly efficient at managing downside volatility and large losing trades relative to the profits it generated.
Average Trade Duration: A critical characteristic to understand is the strategy's holding period. With an average of only 2 bars per trade , this configuration operates as a very short-term, or scalping-style, system. Winning trades averaged 2 bars, while losing trades averaged 4 bars. This indicates the strategy's logic is designed to capture quick, high-probability moves and exit rapidly, either at a profit target or a stop loss.
Conclusion and Final Disclaimer
This backtest demonstrates one specific application of the VoVix+ framework. It highlights the strategy's behavior as a short-term system that, in this historical test on NQ1!, exhibited a high win rate and effective management of downside risk. Users are strongly encouraged to conduct their own backtests on different instruments, timeframes, and date ranges to understand how the strategy adapts to varying market structures. Past performance is not indicative of future results, and all trading involves significant risk.
🔧 THE DEVELOPMENT PHILOSOPHY: FROM VOLATILITY TO CLARITY
The journey to create VoVix+ began with a simple question: "What drives major market moves?" The answer is often not a change in price direction, but a fundamental shift in market volatility. Standard indicators are reactive to price. We wanted to create a system that was predictive of market state. VoVix+ was designed to go one level deeper—to analyze the behavior, character, and momentum of volatility itself.
The challenge was twofold. First, to create a robust mathematical model to quantify these abstract concepts. This led to the multi-layered analysis of ATR differentials and standard deviations. Second, to make this complex data intuitive and actionable. This drove the creation of the "Visual Universe," where abstract mathematical values are translated into geometric shapes, flows, and fields. The adaptive system was intentionally kept simple and transparent, focusing on a single, impactful parameter (time-based exits) to provide performance feedback without becoming an inscrutable "black box." The result is a tool that is both profoundly deep in its analysis and remarkably clear in its presentation.
⚠️ RISK DISCLAIMER AND BEST PRACTICES
VoVix+ is an advanced analytical tool, not a guarantee of future profits. All financial markets carry inherent risk. The backtesting results shown by the strategy are historical and do not guarantee future performance. This strategy incorporates realistic commission and slippage settings by default, but market conditions can vary. Always practice sound risk management, use position sizes appropriate for your account equity, and never risk more than you can afford to lose. It is recommended to use this strategy as part of a comprehensive trading plan. This was developed specifically for Futures
"The prevailing wisdom is that markets are always right. I take the opposite view. I assume that markets are always wrong. Even if my assumption is occasionally wrong, I use it as a working hypothesis."
— George Soros
— Dskyz, Trade with insight. Trade with anticipation.

EdgeXplorer - Dynamic Price ActionEdgeXplorer – Dynamic Price Action
Dynamic Price Action by EdgeXplorer is a high-precision structural framework that detects and maps market structure shifts, liquidity zones, and sweep events in real time. Built for traders who prioritize price behavior over indicators, this suite intelligently interprets swing pivots, volatility ranges, and institutional footprints to surface key decision-making zones on your chart.
Whether you trade Smart Money Concepts (SMC), classical price action, or hybrid strategies, Dynamic Price Action helps you visualize where price is reacting, where it’s hunting stops, and when structure is shifting — without the noise.
⸻
🔍 What Does Dynamic Price Action Do?
This indicator tracks three core elements:
1. Market Structure Shifts – Bullish and bearish swing breaks (BOS and MSS)
2. Liquidity Zones – Dynamic detection of potential buy-side and sell-side liquidity pools
3. Sweep Events – Real-time detection when liquidity is taken out (aka stop hunts or raids)
It also contains logic for Order Block detection, giving you a foundational structure for further Smart Money analysis (note: OB visuals are currently off by default but fully supported).
⸻
⚙️ How It Works – Technical Breakdown
1. Market Structure (BOS / MSS)
• Detects swing highs and lows using a 3-bar pivot system
• When a valid swing is confirmed:
• A BOS (Break of Structure) line is drawn for bullish shifts
• An MSS (Market Structure Shift) line is drawn for bearish transitions
• Lines are plotted with customizable styles and optional labels
2. Liquidity Detection
• Liquidity zones are marked based on:
• Recent confirmed swing highs or lows
• ATR-based range check (swing must exceed Liquidity Sensitivity threshold)
• Post-swing candle direction (bullish or bearish close)
• Sell-Side Liquidity = swing highs likely containing stop clusters
• Buy-Side Liquidity = swing lows likely containing stop clusters
• Each zone is tagged visually and stored for later sweep checks
3. Sweep Recognition
• If price breaches a previously tagged liquidity level:
• A “Sell Sweep” label appears above the former sell-side zone
• A “Buy Sweep” label appears below the former buy-side zone
• Zones are removed after being swept to reduce clutter
4. Order Block Logic (Optional)
• The script includes full logic to detect bullish/bearish order blocks based on:
• Body-based or wick-based structure (user preference)
• Candle volume criteria
• Visuals are turned off for now but can be easily re-enabled
⸻
📈 What You See on the Chart
Visual Element Meaning
Green BOS Line Bullish break of market structure (higher high)
Red MSS Line Bearish shift in structure (lower low)
“Sellside Liquidity” Label Area above a swing high likely to hold resting liquidity
“Buyside Liquidity” Label Area below a swing low likely to hold resting liquidity
“Sell Sweep” Label A stop hunt above a prior high
“Buy Sweep” Label A stop hunt below a prior low
All elements are dynamically drawn, adapting to price behavior with zero repainting.
⸻
📊 Inputs & Settings Explained
Market Structures
Setting Description
Enable Market Structures Toggle BOS/MSS logic
Detection Mode Conceptual filter: Short-Term, Mid-Term, Long-Term (doesn’t affect logic)
Show Labels Display BOS and MSS labels above/below structure
Line Style Choose between Solid, Dashed, or Dotted
Bullish/Bearish Colors Customize line and label appearance
Liquidity Zones
Setting Description
Liquidity Sensitivity How large a swing must be (ATR multiplier) to qualify as a liquidity point
Order Blocks
Setting Description
Use Candle Body If true, OB zones are based on open/close instead of high/low
⸻
🧠 How Traders Can Interpret Dynamic Price Action
Structure-Based Bias:
• BOS = bullish structure continuing → look for long setups
• MSS = bearish structure breaking down → caution for reversals
Liquidity Zones:
• Price nearing a Sellside Liquidity zone? Watch for sweep + rejection
• Price tapping Buyside Liquidity? Look for absorption or reversal
Sweep Events:
• A Buy Sweep can signal accumulation
• A Sell Sweep can mark distribution or a trap breakout
Use sweeps as confirmation, trap detection, or entry filters.
⸻
🧪 Strategy Use Cases
• 🔍 Smart Money Concepts (SMC): Combine BOS/MSS + sweeps for refined CHoCH entries
• 🔄 Reversal Traders: Wait for sweep + structure shift before entering against prior trend
• 📉 Trend Continuation: Use BOS + liquidity clears to confirm direction
• 🎯 Scalping: Sweep zones act as high-probability entry areas on LTFs

Multi-Timeframe Bands (final, with labels)This is a simple Kelt style Band indicator draws colored horizontal bands representing the high (top) and low (bottom) for each of the following timeframes:
4h: Blue (bottom), Red (top)
1D: Gold (bottom/top)
1W: Purple (bottom/top)
1M: Orange (bottom/top)
Quarterly: Light purple (bottom/top)
The script works on any chart timeframe, and the bands will update dynamically.

Dynamic Spot vs Perps Premium (Area Plot)This is a script to give you an easy overall view on the spot perp premium which could indicate the momentum is drove by spot or perps

Buy Sell Magic Rework
A version of the legendary Forex indicator Buy Sell Magic for TradingView, with optional additional filtering in the settings.
A simple yet very effective trend-following tool — I personally used it for trading gold 14 years ago, and it still works great today!
How it works:
This script combines the classic Parabolic SAR trend indicator with an optional ZigZag filter for additional signal confirmation.
Parabolic SAR:
The indicator plots the Parabolic SAR on the chart to help identify trend direction and potential reversals. A buy signal is generated when the SAR flips from above the price to below it, signaling a possible uptrend. A sell signal appears when the SAR moves from below to above the price, indicating a potential downtrend.
ZigZag Filter (optional):
The ZigZag filter uses pivot highs and lows to reduce market noise and confirm significant swings. When enabled, a signal is shown only after a clear pivot forms in the chosen period.
Inputs:
ZigZag Period: Controls pivot sensitivity.
SAR Start, Increment, Max: Adjust how responsive the SAR is.
Use ZigZag Filter: Enable or disable additional filtering.
Plots:
Gray crosses = Parabolic SAR points
Green arrows = Buy signals
Red arrows = Sell signals
Best Use:
This tool works well on various markets: Forex, crypto, stocks. It is best suited for trend-following or swing trading strategies. Adjust the settings for your preferred asset and timeframe, and always backtest before live trading.
⚠️ Disclaimer: This script is for educational purposes only and does not constitute financial advice. Always test any strategy thoroughly and trade at your own risk.

ROGUE ICT PROROGUE ICT PRO | ICT-Inspired Confluence System
The ROGUE ICT PRO is a precision tool built for traders who follow the principles of Inner Circle Trader (ICT) methodology. This script is designed to highlight potential high-probability trade setups based on multiple confluences including Market Structure Shifts (MSS), Fair Value Gaps (FVGs), killzone timing, rejection confirmations, and optional HTF bias filters.
This tool is intended for educational and research purposes only and is best used by traders who already understand ICT-style concepts.
🔍 Key Features:
- Market Structure Shift (MSS): Detects bullish or bearish structure breaks and plots them on the chart.
- Fair Value Gaps (FVGs): Highlights potential imbalance zones after a structure shift.
- Signal Logic: Buy or sell signals only trigger when price returns to a valid FVG and confirms with a rejection wick or engulfing (optional).
- Session Killzones: Filter entries to only occur during specific sessions: Asian, London, or New York.
High Timeframe Bias (Optional):
- HTF EMA trend direction
- HTF swing structure break
- HTF candle bias
RSI Confirmation (Optional): A 3-period RSI must be in overbought (for sell) or oversold (for buy) territory.
ATR-Based Risk Management:
SL and TP lines are drawn dynamically using ATR with configurable multipliers and risk-reward ratio.
Cooldown Logic: Prevents signal spam by enforcing a minimum bar gap between trades.
Previous Day High/Low Anchoring (Optional): Visual levels drawn from the previous day’s extremes.
⚙️ Customization:
Every feature can be toggled or configured via the settings menu:
Choose which killzones to enable.
Select your HTF bias filter or disable bias altogether.
Adjust ATR, Risk:Reward, and RSI levels to suit your strategy.
Fine-tune structure sensitivity, gap size, and rejection rules.
🛡️ Disclaimer:
This indicator is provided for educational and informational purposes only. It is not intended as financial advice or a trading signal service. Past performance is not indicative of future results. Always conduct your own research and consult with a licensed financial advisor before making any trading decisions.

SHMA Quantique – Schrödinger Moving AverageAn experimental moving average inspired by the Schrödinger model. Reacts to momentum and filters noise on small timeframes. Ideal for scalping. 1 minute and up.

5-Minute Momentum Indicator ($1000 Entry + 20% TP + 9:30 Exit)Showing entry candle and displaying entry, TP, and SL

Multi-Timeframe Bands (Horizontal Table, Robust, No get_cols)Mulit-timeframe /Kelt Bands with Table Price tracker
This is a simple Kelt style Band indicator draws colored horizontal bands representing the high (top) and low (bottom) for each of the following timeframes:
4h: Blue (bottom), Red (top)
1D: Gold (bottom/top)
1W: Purple (bottom/top)
1M: Orange (bottom/top)
Quarterly: Light purple (bottom/top)
The script works on any chart timeframe, and the bands will update dynamically.
I've added a horizontal box to show the corresponding prices at the top.

Trend Strength Oscillator📌 Trend Strength Oscillator
📄 Description
Trend Strength Oscillator measures the directional strength of price relative to an adaptive dynamic trend band. It evaluates how far the current price is from the midpoint of a trend channel and normalizes this value by recent volatility range, allowing traders to detect trend strength, direction, and potential exhaustion in any market condition.
📌 Features
🔹 Adaptive Trend Band Logic: Uses a modified ATR and time-dependent spread formula to dynamically adjust upper and lower trend bands.
🔹 Trendline Midpoint Calculation: The central trendline is defined as the average between upper and lower bands.
🔹 Relative Positioning: Measures how far the close is from the center of the band as a percentage.
🔹 Range Normalization: Uses a normalized range to account for recent volatility, reducing noise in the oscillator reading.
🔹 Oscillator Output (±100 scale):
+100 indicates strong bullish momentum
-100 indicates strong bearish momentum
0 is the neutral centerline
🛠️ How to Use
✅ Trend Strength > +50: Indicates a strong bullish phase.
✅ Trend Strength < -50: Indicates a strong bearish phase.
⚠️ Crossing above 0: Potential bullish trend initiation.
⚠️ Crossing below 0: Potential bearish trend initiation.
📉 Values near 0: Suggest trend weakness or ranging conditions.
Best suited timeframes: 1H, 4H, Daily
Ideal combination with: RSI, MACD, volume-based oscillators, moving average crosses
✅ TradingView House Rules Compliance
This indicator is written in Pine Script v5 and fully open-source.
The script does not repaint, does not generate false alerts, and does not access external or private data.
It is intended strictly as a technical analysis tool, and not a buy/sell signal generator.
Users are encouraged to combine this tool with other confirmations and independent judgment in trading decisions.
=========================================================
📌 Trend Strength Oscillator
📄 설명 (Description)
Trend Strength Oscillator는 가격이 동적 추세 밴드 내 어디에 위치해 있는지를 정량적으로 분석하여, 추세의 방향성과 강도를 시각적으로 보여주는 오실레이터 지표입니다. 최근 변동성을 반영한 밴드를 기반으로 가격 위치를 정규화하여, 과매수·과매도 상태나 추세의 소멸 가능성까지 탐지할 수 있도록 설계되었습니다.
📌 주요 특징 (Features)
🔹 적응형 추세 밴드 계산: ATR과 시간 경과를 기반으로 상단/하단 밴드를 동적으로 조정
🔹 중심 추세선 산출: 상단과 하단 밴드의 평균값을 중심선으로 활용하여 기준 축 제공
🔹 상대 위치 계산: 현재 종가가 중심선에서 얼마나 떨어져 있는지를 정규화하여 추세 강도 계산
🔹 변동성 기반 정규화: 최근 밴드 범위를 기준으로 상대 거리를 0~100 사이 값으로 변환
🔹 오실레이터 출력 (범위: ±100):
+100에 가까울수록 강한 상승 추세
-100에 가까울수록 강한 하락 추세
0에 가까울수록 횡보 구간 가능성
🛠️ 사용법 (How to Use)
✅ +50 이상: 강한 상승 추세 지속 중
✅ -50 이하: 강한 하락 추세 지속 중
⚠️ 0선 돌파 상향: 상승 추세 시작 가능성
⚠️ 0선 돌파 하향: 하락 추세 시작 가능성
🟡 0 근처 유지: 추세 약화 또는 횡보장 가능성
추천 시간대: 1시간봉, 4시간봉, 일봉
보조 지표로 추천: RSI, MACD, OBV, 이동평균 크로스 등과 함께 활용 시 효과적
✅ 트레이딩뷰 하우스룰 준수사항 (TradingView House Rules Compliance)
본 지표는 Pine Script v5로 작성된 오픈소스 공개용 스크립트입니다.
리페인트(Repaint) 현상이 없으며, **허위 경고(Spam Alerts)**나 성능 저하 요소도 없습니다.
외부 데이터 접근 없이 완전히 자체 계산으로 동작합니다.
이 지표는 투자 판단을 돕기 위한 분석용 도구이며, 직접적인 매수·매도 신호로 사용해서는 안 됩니다.
모든 트레이딩은 사용자의 독립적인 판단과 책임 하에 이루어져야 합니다.

ATR > VXN Alert (5m)ATR > VXN Volatility Divergence Indicator
This custom TradingView indicator monitors real-time volatility divergence between realized volatility (via Average True Range, ATR) and implied volatility (via the CBOE NASDAQ Volatility Index, VXN). It is inspired by the GJR-GARCH (Glosten-Jagannathan-Runkle Generalized Autoregressive Conditional Heteroskedasticity) model, which captures asymmetric volatility dynamics—particularly how markets respond more sharply to negative shocks than to positive ones.
Core Logic:
Chart on NQ 5 minute timeframe
ATR (5-min) reflects realized intraday volatility of the Nasdaq 100 futures (NQ).
VXN (5-min, delayed) represents forward-looking implied volatility.
The indicator highlights regime shifts in volatility:
ATR < VXN: Volatility compression → potential energy building up (market coiling).
ATR > VXN: Volatility expansion → real movement exceeds expectations → potential breakout zone.
Visuals & Alerts:
Background turns green when ATR crosses above VXN, signaling a bullish expansion regime.
Background turns red when ATR drops below VXN, signaling compression or risk-off environment.
Custom alerts trigger on volatility regime shifts for breakout traders.
Application (Manual GJR-GARCH Strategy):
Similar to how the GJR-GARCH model captures volatility clustering and asymmetry, this indicator identifies when actual price volatility (ATR) begins to spike beyond implied forecasts (VXN), often after periods of contraction—mirroring a conditional variance shock in the GARCH framework.
Traders can align with directional bias using technical confluence (order flow, structure breaks, liquidity zones) once expansion is confirmed.


Daily, Weekly, Monthly Current/Average RangeThe "Daily, Weekly, Monthly Current/Average Range" calculates and displays current and average price ranges (high - low) for daily, weekly, and monthly timeframes in a customizable table.
Users can adjust the lookback period, table size, and font color, with the table updating on the last bar for efficiency.
When the current range exceeds the average for a timeframe, the corresponding cell highlights green, signaling price possibly reaching maximum expansion and potential retracement or consolidation may follow.

ATR > VXN Alert (5m)ATR > VXN Volatility Divergence Indicator
This custom TradingView indicator monitors real-time volatility divergence between realized volatility (via Average True Range, ATR) and implied volatility (via the CBOE NASDAQ Volatility Index, VXN). It is inspired by the GJR-GARCH (Glosten-Jagannathan-Runkle Generalized Autoregressive Conditional Heteroskedasticity) model, which captures asymmetric volatility dynamics—particularly how markets respond more sharply to negative shocks than to positive ones.
Core Logic:
Chart on NQ (5 minute timeframe)
ATR (5-min) reflects realized intraday volatility of the Nasdaq 100 futures (NQ).
VXN (5-min, delayed) represents forward-looking implied volatility.
The indicator highlights regime shifts in volatility:
ATR < VXN: Volatility compression → potential energy building up (market coiling).
ATR > VXN: Volatility expansion → real movement exceeds expectations → potential breakout zone.
Visuals & Alerts:
Background turns green when ATR crosses above VXN, signaling a bullish expansion regime.
Background turns red when ATR drops below VXN, signaling compression or risk-off environment.
Custom alerts trigger on volatility regime shifts for breakout traders.
Application (Manual GJR-GARCH Strategy):
Similar to how the GJR-GARCH model captures volatility clustering and asymmetry, this indicator identifies when actual price volatility (ATR) begins to spike beyond implied forecasts (VXN), often after periods of contraction—mirroring a conditional variance shock in the GARCH framework.
Traders can align with directional bias using technical confluence (order flow, structure breaks, liquidity zones) once expansion is confirmed.

Trend Band Oscillator📌 Trend Band Oscillator
📄 Description
Trend Band Oscillator is a momentum-based trend indicator that calculates the spread between two EMAs and overlays it with a volatility filter using a standard deviation band. It helps traders visualize not only the trend direction but also the strength and stability of the trend.
📌 Features
🔹 EMA Spread Calculation: Measures the difference between a fast and slow EMA to quantify short-term vs mid-term trend dynamics.
🔹 Volatility Band Overlay: Applies an EMA of standard deviation to the spread to filter noise and highlight valid momentum shifts.
🔹 Color-Based Visualization: Positive spread values are shown in lime (bullish), negative values in fuchsia (bearish) for quick directional insight.
🔹 Upper/Lower Bands: Help detect potential overbought/oversold conditions or strong trend continuation.
🔹 Zero Line Reference: A horizontal baseline at zero helps identify trend reversals and neutral zones.
🛠️ How to Use
✅ Spread > 0: Indicates a bullish trend. Consider maintaining or entering long positions.
✅ Spread < 0: Indicates a bearish trend. Consider maintaining or entering short positions.
⚠️ Spread exceeds bands: May signal overextension or strong momentum; consider using with additional confirmation indicators.
🔄 Band convergence: Suggests weakening trend and potential transition to a ranging market.
Recommended timeframes: 1H, 4H, Daily
Suggested complementary indicators: RSI, MACD, OBV, SuperTrend
✅ TradingView House Rules Compliance
This script is open-source and published under Pine Script v5.
It does not repaint, spam alerts, or cause performance issues.
It is designed as an analytical aid only and should not be considered financial advice.
All calculations are transparent, and no external data sources or insecure functions are used.
====================================================================
📌 Trend Band Oscillator
📄 설명 (Description)
Trend Band Oscillator는 두 개의 EMA 간 스프레드(차이)를 기반으로 한 모멘텀 중심의 추세 오실레이터입니다. 여기에 표준편차 기반의 변동성 밴드를 적용하여, 추세의 방향뿐 아니라 강도와 안정성까지 시각적으로 분석할 수 있도록 설계되었습니다.
📌 주요 특징 (Features)
🔹 EMA 기반 스프레드 계산: Fast EMA와 Slow EMA의 차이를 활용해 시장 추세를 정량적으로 표현합니다.
🔹 표준편차 필터링: Spread에 대해 EMA 및 표준편차 기반의 밴드를 적용해 노이즈를 줄이고 유효한 추세를 강조합니다.
🔹 컬러 기반 시각화: 오실레이터 값이 양수일 경우 초록색, 음수일 경우 마젠타 색으로 추세 방향을 직관적으로 파악할 수 있습니다.
🔹 밴드 범위 시각화: 상·하위 밴드를 통해 스프레드의 평균 편차 범위를 보여주며, 추세의 강약과 포화 여부를 진단할 수 있습니다.
🔹 제로 라인 표시: 추세 전환 가능 지점을 시각적으로 확인할 수 있도록 중심선(0선)을 제공합니다.
🛠️ 사용법 (How to Use)
✅ 오실레이터가 0 이상 유지: 상승 추세 구간이며, 롱 포지션 유지 또는 진입 검토
✅ 오실레이터가 0 이하 유지: 하락 추세 구간이며, 숏 포지션 유지 또는 진입 검토
⚠️ 상·하위 밴드를 이탈: 일시적인 과매수/과매도 혹은 강한 추세 발현 가능성 있음 → 다른 보조지표와 함께 필터링 권장
🔄 밴드 수렴: 추세가 약해지고 있음을 나타냄 → 변동성 하락 또는 방향성 상실 가능성 있음
권장 적용 시간대: 1시간봉, 4시간봉, 일봉
보조 적용 지표: RSI, MACD, OBV, SuperTrend 등과 함께 사용 시 신호 필터링에 유리
✅ 트레이딩뷰 하우스룰 준수사항 (TV House Rules Compliance)
이 지표는 **무료 공개용(Open-Source)**이며, Pine Script Version 5로 작성되어 있습니다.
과도한 리페인트, 비정상적 반복 경고(alert spam), 실시간 성능 저하 등의 요소는 포함되어 있지 않습니다.
사용자는 본 지표를 투자 결정의 참고용 보조 도구로 활용해야 하며, 독립적인 매매 판단이 필요합니다.
데이터 소스 및 계산 방식은 완전히 공개되어 있으며, 외부 API나 보안 취약점을 유발하는 구성 요소는 없습니다.

Market Hours Highlight//@version=5
indicator("Market Hours Highlight", overlay=true)
// Set your time zone (adjust if needed)
tz = "America/Chicago"
// Define session time for regular market hours (CT)
startTime = timestamp(tz, year, month, dayofmonth, 8, 30)
endTime = timestamp(tz, year, month, dayofmonth, 15, 0)
// Check if current bar is during market hours
isMarketOpen = time >= startTime and time < endTime
// Highlight background only during market open hours
bgcolor(isMarketOpen ? color.new(color.green, 85) : na)

EdgeXplorer - Momentum EngineMomentum Engine by EdgeXplorer
Momentum Engine is a precision-driven oscillator and trend framework engineered to track market momentum with adaptive clarity. Unlike traditional momentum indicators, this engine blends ATR-based envelope logic, multi-mode oscillator scaling, and real-time directional overlays—all in one responsive system.
Designed for intraday traders and swing strategists alike, Momentum Engine offers a streamlined way to visualize momentum direction, impulse strength, and volatility-adaptive trend zones—with minimal noise and maximum context.
⸻
🔍 What Does Momentum Engine Do?
Momentum Engine visualizes market energy through a volatility-aware oscillator and accompanying trend overlays. It adapts dynamically to price behavior and enables traders to:
• Detect momentum waves with real-time visual cues
• Confirm directional bias using trend overlays and impulse zones
• Switch between Regular and Normalized oscillator modes
• See heatmap-based signal confirmation for crossovers
• View optional info panels, labels, and trend bar colors for clarity
It’s a compact yet powerful system built for discretionary and systematic use.
⸻
⚙️ How It Works – Technical Breakdown
1. Trend Envelope Logic
At its core, Momentum Engine constructs a price envelope using:
• The average of the highest closes and highs (Baseline Length)
• The average of the lowest closes and lows
• A multiplied ATR to scale the distance between upper and lower bounds
These bounds determine trend bias:
• Price above the short side of the channel → Bullish
• Price below the long side → Bearish
• In-between → Neutral
A dynamic midline tracks the central channel axis.
2. Oscillator Wave Calculation
The momentum oscillator reacts to price positioning relative to the envelope:
• In Regular Mode, it shows raw price deviation from the trend channel
• In Normalized Mode, it maps price movement into a 0–100 scale with historical scaling logic
Both modes use smoothing (Smoothing) to reduce noise.
3. Overlay Channel (Optional)
• Displays trend floors (bull) and ceilings (bear) on the price chart
• Color-coded trend shifts appear as pulse circles
• Optionally, bars themselves can be recolored for instant trend recognition
4. Heatmap Signal Zones
The background dynamically changes based on oscillator crossovers:
• Bullish signal → Yellow heatmap
• Bearish signal → Blue heatmap
These zones signal momentum ignition, especially helpful for early entries.
⸻
📈 What You See on the Chart
Element Meaning
Green Momentum Wave Bullish pressure (oscillator > midline or >50)
Red Momentum Wave Bearish pressure (oscillator < midline or <50)
Zero Line Base reference in Regular mode
Gray Guide Lines (Normalized) Bands for Overbought (85), Oversold (15), and Neutral (33–50)
Channel Lines Trend bias boundaries (bull/bear zones)
Pulse Marker (Circle) Trend direction change
Bar Colors (Optional) Bull or bear bar overlays for added clarity
Background Heatmap Bullish or bearish impulse confirmation
Info Table (Optional) Real-time trend and oscillator data panel
Debug Labels (Optional) Inline oscillator readings per bar
⸻
📊 Inputs & Settings
Engine Settings
Input Description
Timeframe Optional custom timeframe override
Baseline Length Determines envelope size (larger = smoother trend)
Multiplier Factor Controls ATR-based range expansion
Momentum Wave Settings
Input Description
Mode Regular = raw wave, Normalized = 0–100 scaling
Bull/Bear Colors Wave color customization
Line Width & Smoothing Visual clarity adjustments
Overlay Channel
Input Description
Show Overlay Toggle trend ceilings/floors on chart
Channel Colors Separate bull/bear lines
Trend Bar Color Recolors candle bodies based on trend bias
Signal Heatmap
Input Description
Enable Heatmap Background impulse shading toggle
Bull / Bear Colors Adjust visual tone of crossover zones
Add-ons
Input Description
Show Debug Labels View oscillator values at each bar
Show Info Panel Display current trend, oscillator value, and mode
⸻
🧠 How to Use Momentum Engine
Regular Mode
• Oscillator above 0 = Bullish bias
• Oscillator below 0 = Bearish bias
• Use zero line as your confirmation threshold
Normalized Mode
• 85 → Overbought / exhaustion
• <15 → Oversold / reversal watch
• Crossing 50 → Momentum ignition
• 33–50 → Neutral zone / ranging phase
Visual Interpretation Tips
• Green wave + yellow heatmap = Bull momentum confirmation
• Red wave + blue heatmap = Bear momentum confirmation
• Pulse marker = New trend — evaluate strength with wave slope
• Trend bar coloring = Scan trend alignment at a glance
⸻
🧪 Use Cases & Strategy Ideas
• ⚡ Scalping Impulse Moves
Use oscillator + heatmap crossover to catch directional bursts
• 🔁 Pullback Continuation
Wait for momentum to reset near neutral zone, then re-enter trend
• 📉 Reversal Triggers
Look for divergence or Normalized wave flipping at extremes
• 🎯 Multi-timeframe Confirmation
Set custom timeframe and layer on top of a higher or lower TF structure

GARCH Volatility [Trading Signals]This is a GARCH-like indicator rather than a full academic GARCH model
Current Strengths:
Current Strengths:
Captures core volatility clustering (alpha + beta)
Provides actionable signals
Lightweight for TradingView
When to Use This vs True GARCH:
Use This For: Real-time trading signals, visual market analysis
Use Full GARCH For: Risk modeling, quantitative research

Shavarie Gordon’s Phantom Trigger The Phantom Trigger is a precision-engineered confluence indicator developed by Shavarie Gordon — the result of 7 years of trading experience distilled into one clean, powerful tool.
This system filters out noise and focuses only on high-quality trades, combining three powerful elements:
🔹 Momentum Bend Detection – custom logic to detect shifts in directional strength
🔹 Delta Volume Pressure – smoothed order flow showing who’s in control (buyers vs sellers)
🔹 RSI Bend Confirmation – micro-level reversal insight from RSI (length 1 by default)
When all three align, the Phantom Trigger activates:
📈 Line bends up → high-probability buy
📉 Line bends down → high-probability sell
Key Features:
Built for confluence-based traders who want sniper accuracy
Filters out random or weak setups — no low-quality trades
Perfect for scalping, swing, or smart intraday positioning
Lightweight, non-repainting, and easy to read
👑 Final Note:
This tool isn’t for guessing — it’s for traders who wait, confirm, and strike.
Every signal reflects the precision and patience of a 7-year trading journey.
Disclaimer:
This indicator is for educational and informational purposes only and does not constitute financial advice. Use at your own discretion and always apply risk management.

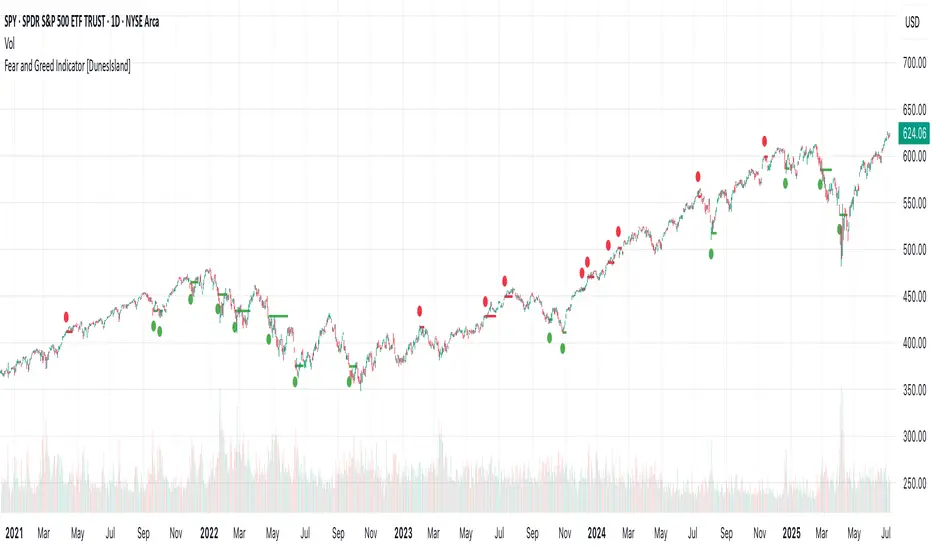
Fear and Greed Indicator [DunesIsland]The Fear and Greed Indicator is a TradingView indicator that measures market sentiment using five metrics. It displays:
Tiny green circles below candles when the market is in "Extreme Fear" (index ≤ 25), signalling potential buys.
Tiny red circles above candles when the market is in "Greed" (index > 75), indicating potential sells.
Purpose: Helps traders spot market extremes for contrarian trading opportunities.Components (each weighted 20%):
Market Momentum: S&P 500 (SPX) vs. its 125-day SMA, normalized over 252 days.
Stock Price Strength: Net NYSE 52-week highs (INDEX:HIGN) minus lows (INDEX:LOWN), normalized.
Put/Call Ratio: 5-day SMA of Put/Call Ratio (USI:PC).
Market Volatility: VIX (VIX), inverted and normalized.
Stochastic RSI: 14-period RSI on SPX with 3-period Stochastic SMA.
Alerts:
Buy: Index ≤ 25 ("Extreme Fear - Potential Buy").
Sell: Index > 75 ("Greed - Potential Sell").
HL/OL Histogram + (Close-Open)🧠 Core Concept
This indicator is designed to detect meaningful directional intent in price action using a combination of:
Intrabar candle structure (high - open, open - low)
Net price momentum (close - open)
Timed trigger levels (frozen buy/sell prices based on selected timeframe closes)
The core idea is to visually separate bullish and bearish energy in the current bar, and to mark the price at which momentum flips from down to up or vice versa, based on a change in the close - open differential.
🔍 Components Breakdown
1. Histogram Bars
Green Bars (high - open): Represent bullish upper wicks, showing intrabar strength above the open.
Red Bars (open - low): Represent bearish lower wicks, showing pressure below the open.
Plotted as histograms above and below the zero line.
2. Close–Open Line (White)
Plots the difference between close and open for each bar.
Helps you visually track when momentum flips from negative to positive, or vice versa.
A bold black zero line provides clear reference for these flips.
3. Buy/Sell Signal Logic
A Buy Trigger is generated when close - open crosses above zero
A Sell Trigger occurs when close - open crosses below zero
These trigger events are one-shot, meaning they’re only registered once per signal direction. No retriggers occur until the opposite condition is met.
📈 Trigger Price Table (Static)
On a signal trigger, the close price from a lower timeframe (15S, 30S, 1, 2, 3, or 5 min) is captured.
This price is frozen and displayed in a table at the top-right of the pane.
The price remains fixed until the opposite trigger condition fires, at which point it is replaced.
Why close price?
Using the close from the lower timeframe gives a precise, decisive reference point — ideal for planning limit entries or confirming breakout commitment.
🛠️ Use Cases
Momentum traders can use the histogram and line to time entries after strong open rejection or close breakouts.
Scalpers can quickly gauge intrabar sentiment reversals and react to new momentum without waiting for candle closes.
Algo builders can use the frozen price logic as precise entry or confirmation points in automated strategies.
