OPEN-SOURCE SCRIPT
RSI based on ROC
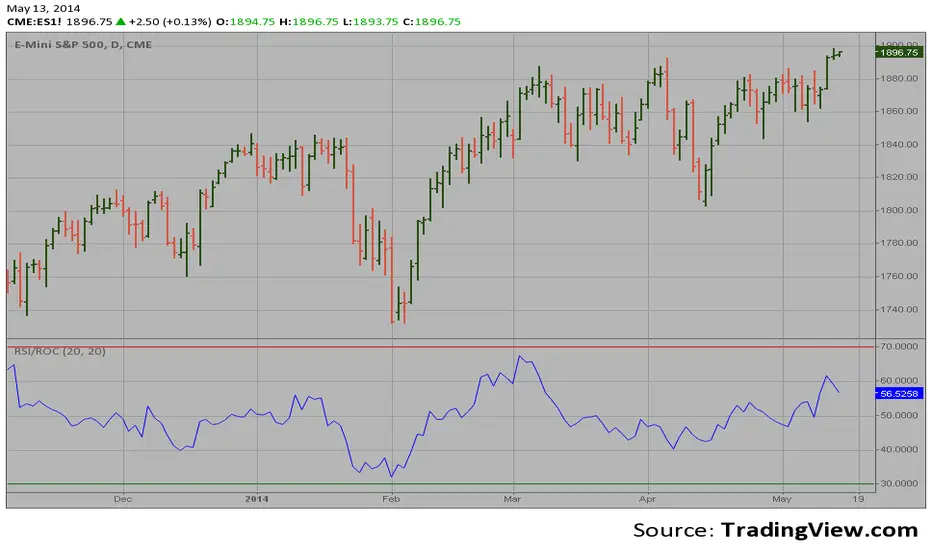
This is the new-age indicator which is version of RSI calculated upon
the Rate-of-change indicator.
The name "Relative Strength Index" is slightly misleading as the RSI
does not compare the relative strength of two securities, but rather
the internal strength of a single security. A more appropriate name
might be "Internal Strength Index." Relative strength charts that compare
two market indices, which are often referred to as Comparative Relative Strength.
And in its turn, the Rate-of-Change ("ROC") indicator displays the difference
between the current price and the price x-time periods ago. The difference can
be displayed in either points or as a percentage. The Momentum indicator displays
the same information, but expresses it as a ratio.
Açık kaynak kodlu komut dosyası
Gerçek TradingView ruhuna uygun olarak, bu komut dosyasının oluşturucusu bunu açık kaynaklı hale getirmiştir, böylece yatırımcılar betiğin işlevselliğini inceleyip doğrulayabilir. Yazara saygı! Ücretsiz olarak kullanabilirsiniz, ancak kodu yeniden yayınlamanın Site Kurallarımıza tabi olduğunu unutmayın.
Feragatname
Bilgiler ve yayınlar, TradingView tarafından sağlanan veya onaylanan finansal, yatırım, işlem veya diğer türden tavsiye veya tavsiyeler anlamına gelmez ve teşkil etmez. Kullanım Şartları'nda daha fazlasını okuyun.