AI Breakout Bands (Zeiierman)█ Overview
AI Breakout Bands (Zeiierman) is an adaptive trend and breakout detection system that combines Kalman filtering with advanced K-Nearest Neighbor (KNN) smoothing. The result is a smart, self-adjusting band structure that adapts to dynamic market behavior, identifying breakout conditions with precision and visual clarity.
At its core, this indicator estimates price behavior using a two-dimensional Kalman filter (position + velocity), then enhances the smoothing process with a nonlinear, similarity-based KNN filter. This unique blend enables it to handle noisy markets and directional shifts with both speed and stability — providing breakout traders and trend followers a reliable framework to act on.
Whether you're identifying volatility expansions, capturing trend continuations, or spotting early breakout conditions, AI Breakout Bands gives you a mathematically grounded, visually adaptive roadmap of real-time market structure.
█ How It Works
⚪ Kalman Filter Engine
The Kalman filter models price movement as a state system with two components:
Position (price)
Velocity (trend direction)
It recursively updates predictions using real-time price as a noisy observation, balancing responsiveness with smoothness.
Process Noise (Position) controls sensitivity to sudden moves.
Process Noise (Velocity) controls smoothing of directional flow.
Measurement Noise (R) defines how much the filter "trusts" live price data.
This component alone creates a responsive yet stable estimate of the market’s center of gravity.
⚪ Advanced K-Neighbor Smoothing
After the Kalman estimate is computed, the script applies a custom K-Nearest Neighbor (KNN) smoother.
Rather than averaging raw values, this method:
Finds K most similar past Kalman values
Weighs them by similarity (inverse of absolute distance)
Produces a smoother that emphasizes structural similarity
This nonlinear approach gives the indicator an AI feature — reacting fast when needed, yet staying calm in consolidation.
█ How to Use
⚪ Trend Recognition
The line color shifts dynamically based on slope direction and breakout confirmation.
Bullish conditions: price above the mid band with positive slope
Bearish conditions: price below the mid band with negative slope
⚪ Breakout Signals
Price breaking above or below the bands may signal momentum acceleration.
Combine with your own volume or momentum confirmation for stronger entries.
Bands adapt to market noise, helping filter out low-quality whipsaws.
█ Settings
Process Noise (Position): Controls Kalman filter’s sensitivity to price changes.
Process Noise (Velocity): Controls smoothing of directional component.
Measurement Noise (R): Defines how much trust is placed in price data.
K-Neighbor Length: Number of historical Kalman values considered for smoothing.
Slope Calculation Window: Number of bars used to compute trend slope of the smoothed Kalman.
Band Lookback (MAE): Rolling period for average absolute error.
Band Multiplier: Multiplies MAE to determine band width.
-----------------
Disclaimer
The content provided in my scripts, indicators, ideas, algorithms, and systems is for educational and informational purposes only. It does not constitute financial advice, investment recommendations, or a solicitation to buy or sell any financial instruments. I will not accept liability for any loss or damage, including without limitation any loss of profit, which may arise directly or indirectly from the use of or reliance on such information.
All investments involve risk, and the past performance of a security, industry, sector, market, financial product, trading strategy, backtest, or individual's trading does not guarantee future results or returns. Investors are fully responsible for any investment decisions they make. Such decisions should be based solely on an evaluation of their financial circumstances, investment objectives, risk tolerance, and liquidity needs.
Göstergeler ve stratejiler

MTF FVGs [Fadi x MMT]The MTF FVGs indicator is a powerful tool for identifying and visualizing Fair Value Gaps (FVGs) across multiple timeframes on TradingView. It provides traders with customizable options to display bullish and bearish FVGs, control their appearance, and manage mitigated gaps, making it ideal for price action and imbalance-based trading strategies.
Features
Multi-Timeframe Support : Analyzes FVGs on up to seven timeframes, including an auto-adjusted timeframe and user-defined periods (e.g., 5m, 15m, 1H, 4H, 1D, 1W).
Customizable Display : Toggle visibility of FVG open, close, central equilibrium (C.E.), and connecting lines with adjustable styles (solid, dashed, dotted) and sizes.
Background Fill : Option to fill FVG areas with customizable transparency for better visualization.
Mitigation Settings : Show or hide mitigated FVGs with configurable mitigation criteria (e.g., touched, wick-filled, body-filled) and extend mitigated lines.
Labeling Options : Display labels for timeframes, FVG types (BISI/SIBI), and levels (open, close, C.E.) with customizable colors and sizes.
Proximity Filtering : Hide FVGs outside a specified price range based on daily or monthly ATR for cleaner charts.
Timeframe Filtering : Hide lower or current timeframe FVGs to focus on higher timeframe imbalances.
Performance Optimization : Limits the number of displayed FVGs and supports up to 5000 bars back, 500 lines, labels, and boxes.
Settings
Higher Timeframe (HTF) FVG Settings
Show/Hide : Enable or disable FVGs for each timeframe.
Timeframe Selection : Choose specific timeframes (e.g., 5m, 15m, 1H, 4H, 1D, 1W) or use auto-selection based on the current chart.
Colors : Set bullish (default: green) and bearish (default: red) FVG colors.
Max Count : Limit the number of FVGs displayed per timeframe (default: 5).
Display Settings
Open/Close Lines : Toggle visibility, style (solid, dashed, dotted), and size (1-4) for FVG boundaries.
Central Equilibrium (C.E.) : Show/hide the midpoint line with customizable style, size, and colors (default: white with transparency).
Link Line : Display a connecting line between FVG boundaries with adjustable style and size.
Background Transparency : Enable/disable fill between FVG boundaries with adjustable transparency (50%-98%).
Mitigation Settings
Show Mitigated FVGs : Toggle visibility of mitigated gaps.
Mitigation Type : Choose criteria for mitigation (None, Touched, Wick Filled, Body Filled, Wick Filled Half, Body Filled Half).
Mitigated Colors : Set colors for mitigated bullish and bearish FVGs (default: gray with transparency).
Extend Mitigated Lines : Extend mitigated FVG lines by a specified number of bars (default: 5).
Labeling Settings
Label Display : Toggle labels for FVGs with customizable color, background color, and size (tiny, small, normal, large, huge).
Label Levels : Show labels for open, close, or C.E. levels.
Label Content : Include timeframe, FVG type (BISI/SIBI), or level information in labels.
Advanced Settings
Proximity Filter : Hide FVGs outside a price range based on daily ATR (adjustable factor: 1-10).
Label Combine Factor : Control label visibility to avoid clutter (default: 1.0).
ATR Range : Set the number of candles for ATR calculation (default: 10).
Line Extension : Extend FVG lines by a set number of bars (default: 4) or based on price range conditions.
Timeframe Spacing : Adjust spacing between FVGs from different timeframes (default: 4 bars).
How to Use
Add the indicator to your TradingView chart.
Configure the desired timeframes and settings via the indicator's input menu.
Analyze FVGs to identify potential support/resistance zones or imbalance areas for trading decisions.
Use mitigation settings to track filled gaps and proximity filters to focus on relevant price levels.
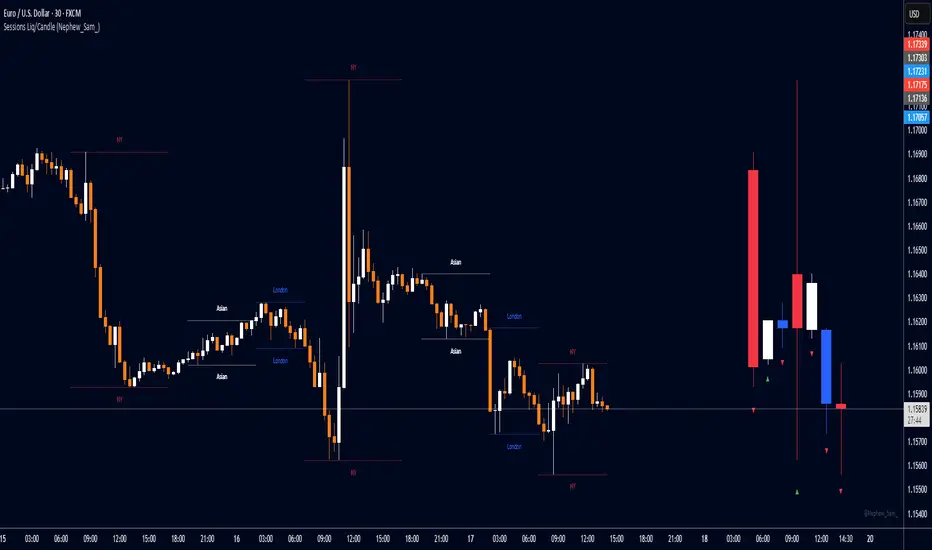
Session HL + Candles + AMD (Nephew_Sam_)Session HL + Candles + AMD (Nephew_Sam_)
This indicator marks out intraday sessions summarized into single candles, with an additional option to mark out the HL of each session. Perfect for understanding AMD within a glance (accumulation-manipulation-distribution)
Features:
Session High/Low lines with customizable colors and labels
Optional session candles displayed on the right side of the chart
Timezone support for global traders
Customizable bull/bear candle colors
Works on timeframes up to 1 hour
Perfect for:
Identifying session liquidity levels
Tracking session ranges and breakouts
Multi-timeframe session analysis
ICT methodology traders
Settings:
Choose your timezone for accurate session detection
Toggle session candles and HL lines independently
Customize colors, line styles, and labels
Set maximum timeframe (up to 1 hour)
Expansion Triangle [TradingFinder] MegaPhone Broadening🔵 Introduction
The Expanding Triangle, also known as the Broadening Formation, is one of the key technical analysis patterns that clearly reflects growing market volatility, increasing indecision among participants, and the potential for sharp price explosions.
This pattern is typically defined by a sequence of higher highs and lower lows, forming within two diverging trendlines. Unlike traditional triangles that converge to a breakout point, the expanding triangle pattern becomes wider over time, leaving no precise apex for a breakout to occur.
From a price action perspective, the pattern represents a prolonged tug-of-war between buyers and sellers, where neither side has taken control yet. Each aggressive swing opens the door to new opportunities whether it's a trend reversal, range trading, or a momentum breakout. This dual nature makes the pattern highly versatile across market conditions, from exhausted trend ends to volatile consolidation zones.
The custom-built indicator for this pattern uses a combination of smart algorithms and detailed analysis of swing dynamics to automatically detect expanding triangles and highlight low-risk entry points.
Traders can use this tool to capitalize on high-probability setups from shorting near the upper edge of the structure with confirmation, to trading bearish breakouts during trend continuations, or entering long positions near the lower boundary during bullish reversals. The chart examples included in this article demonstrate these three highly practical trading scenarios in live market conditions.
A major advantage of this indicator lies in its structural filtering engine, which analyzes the behavior of each price leg in the triangle. With four adjustable filter levels from Very Aggressive, which highlights all potential patterns, to Very Defensive, which only triggers when price actually touches the triangle's trendlines the indicator ensures that only structurally sound and verified setups appear on the chart, reducing noise and false signals significantly.
Long Setup :
Short Setup :
🔵 How to Use
The pattern typically forms in conditions of heightened uncertainty and volatility, where price swings generate a series of higher highs and lower lows. The expanding triangle consists of three key legs bounded by diverging trendlines. The indicator intelligently analyzes each leg's direction and angle to determine whether a valid pattern is forming.
At the core of the indicator’s logic is its leg filtering system, which controls the quality of the pattern and filters out weak or noisy setups. Four structural filter modes are available to suit different trading styles and risk preferences. In Very Aggressive mode, filters are disabled, and the indicator detects any pattern purely based on the sequence of swing points.
This mode is ideal for traders who want to see everything and apply their own discretion.
In Aggressive mode, the indicator checks whether each new leg extends no more than twice the length of the previous one. If a leg overshoots excessively, the structure is invalidated.
In Defensive mode, the filter enforces a minimum movement requirement each leg must move at least 2% of the previous one. This prevents the formation of shallow, weak patterns that visually resemble triangles but lack substance.
The strictest setting, Very Defensive, combines all previous filters and additionally requires the price to physically touch the triangle’s trendlines before issuing a signal. This ensures that setups only appear when real market interaction with key structural levels has occurred, not based on assumptions or geometry alone. This mode is ideal for traders seeking maximum precision and minimal risk.
🟣 Bullish Setup
A bullish setup within the Expanding Triangle pattern occurs when price revisits the lower support boundary after a series of broad swings typically near the third leg of the formation. This area often represents a shift in momentum, where sellers begin to lose strength and buyers prepare to take control.
Ideally, the setup is accompanied by a bullish reversal candle (e.g. doji, pin bar, or engulfing) near the lower trendline. If the Very Defensive filter is active, the indicator will only issue a signal if price makes a confirmed touch on the trendline and reacts from that level. This significantly improves signal accuracy and filters out premature entries.
After confirmation, traders may choose to enter a long position on the bullish candle or shortly afterward. A logical stop-loss is placed just below the recent swing low within the pattern. The target can be set at or near the upper trendline, or projected using the full height of the triangle added to the breakout point. On higher timeframes, this reversal often marks the beginning of a strong uptrend.
🟣 Bearish Setup
A bearish setup forms when price climbs toward the upper resistance trendline, usually as the third leg completes. This is where buyers often begin to show exhaustion, and sellers step in with strength providing an ideal low-risk entry point for short positions.
As with the bullish setup, if the Candle Confirmation filter is enabled, the indicator will only show a signal when a bearish reversal candle forms at the point of contact. If Defensive or Very Defensive filters are also active, the setup must meet strict criteria of proportionate leg movement and an actual trendline touch to qualify.
Once confirmed, traders can enter on the reversal candle, placing a stop-loss slightly above the recent high. The target can be set at the lower trendline or calculated based on the triangle's full height, projected downward. This setup is particularly useful at the end of weak bullish trends or in volatile market tops.
🔵 Settings
🟣 Logic Settings
Pivot Period : Defines how many bars are analyzed to identify swing highs and lows. Higher values detect larger, slower structures, while lower values respond to faster patterns. The default value of 13 offers a balanced sensitivity.
Pattern Filter :
Very Aggressive : Detects all patterns based on point sequence with no structural checks.
Aggressive : Ensures each leg is no more than 2x the size of the previous one.
Defensive : Requires each leg to be at least 2% the size of the previous leg.
Very Defensive : The strictest level; only confirms patterns when price touches trendlines.
Candle Confirmation : When enabled, the indicator requires a valid confirmation candle (doji, pin bar, engulfing) at the interaction point with the trendline before issuing a signal. This reduces false entries and improves entry precision.
🟣 Alert Settings
Alert : Enables alerts for SSS.
Message Frequency : Determines the frequency of alerts. Options include 'All' (every function call), 'Once Per Bar' (first call within the bar), and 'Once Per Bar Close' (final script execution of the real-time bar). Default is 'Once per Bar'.
Show Alert Time by Time Zone : Configures the time zone for alert messages. Default is 'UTC'.
🔵 Conclusion
The Expanding Triangle pattern, with its wide structure and volatility-driven nature, represents chaos but also opportunity. For traders who can read its behavior, it provides some of the most powerful setups for reversals, breakouts, and range-based trades. While the pattern may seem messy at first glance, it is built on clear logic and when properly detected, it offers high-probability opportunities.
This indicator doesn’t just draw expanding triangles it intelligently evaluates their structural quality, validates price interaction through candle confirmation, and allows the trader to fine-tune the detection logic through adjustable filter levels. Whether you’re a reversal trader looking for a turning point, or a breakout trader hunting momentum, this tool adapts to your strategy.
In volatile or uncertain markets, where fakeouts and sudden shifts are common, this indicator can become a cornerstone of your trading system helping you turn volatility into structured, high-quality opportunities.

Auto Market Structure BOS & CHOCH [TeamCash]Auto Market Structure
The Auto Market Structure (AMS) indicator automatically maps market structure to guide your trading. Using pivot points, it plots lines and labels to identify Break of Structure (BOS)—a price break of a key level signaling trend continuation—and Change of Character (CHOCH)—a shift in market direction after breaking a swing high/low. How It Works: BITSTAMP:BTCUSD BITSTAMP:ETHUSD AMS detects pivot points across multiple timeframes, marking BOS and CHOCH with white lines (solid for confirmed, dotted for potential) and labels. It automatically tracks level crosses, highlighting trend shifts or continuations. Optional Fibonacci lines (yellow) can be enabled for precise entry and target zones.
Why Use AMS?
Automates market structure analysis for faster, clearer setups.
Pairs with Fibonacci for high-probability entry and exit points.
Works across timeframes, despite minor bugs, for versatile trading.
Ideal for traders combining structure and Fibonacci in BITSTAMP:BTCUSD and BITSTAMP:ETHUSD markets, offering a powerful, evolving tool for technical analysis.

Quantum Dip Hunter | AlphaNattQuantum Dip Hunter | AlphaNatt
🎯 Overview
The Quantum Dip Hunter is an advanced technical indicator designed to identify high-probability buying opportunities when price temporarily dips below dynamic support levels. Unlike simple oversold indicators, this system uses a sophisticated quality scoring algorithm to filter out low-quality dips and highlight only the best entry points.
"Buy the dip" - but only the right dips. Not all dips are created equal.
⚡ Key Features
5 Detection Methods: Choose from Dynamic, Fibonacci, Volatility, Volume Profile, or Hybrid modes
Quality Scoring System: Each dip is scored from 0-100% based on multiple factors
Smart Filtering: Only signals above your quality threshold are displayed
Visual Effects: Glow, Pulse, and Wave animations for the support line
Risk Management: Automatic stop-loss and take-profit calculations
Real-time Statistics: Live dashboard showing current market conditions
📊 How It Works
The indicator calculates a dynamic support line using your selected method
When price dips below this line, it evaluates the dip quality
Quality score is calculated based on: trend alignment (30%), volume (20%), RSI (20%), momentum (15%), and dip depth (15%)
If the score exceeds your minimum threshold, a buy signal arrow appears
Stop-loss and take-profit levels are automatically calculated and displayed
🚀 Detection Methods Explained
Dynamic Support
Adapts to recent price action
Best for: Trending markets
Uses ATR-adjusted lowest points
Fibonacci Support
Based on 61.8% and 78.6% retracement levels
Best for: Pullbacks in strong trends
Automatically switches between fib levels
Volatility Support
Uses Bollinger Band methodology
Best for: Range-bound markets
Adapts to changing volatility
Volume Profile Support
Finds high-volume price levels
Best for: Identifying institutional support
Updates dynamically as volume accumulates
Hybrid Mode
Combines all methods for maximum accuracy
Best for: All market conditions
Takes the most conservative support level
⚙️ Key Settings
Dip Detection Engine
Detection Method: Choose your preferred support calculation
Sensitivity: Higher = more sensitive to price movements (0.5-3.0)
Lookback Period: How far back to analyze (20-200 bars)
Dip Depth %: Minimum dip size to consider (0.5-10%)
Quality Filters
Trend Filter: Only buy dips in uptrends when enabled
Minimum Dip Score: Quality threshold for signals (0-100%)
Trend Strength: Required trend score when filter is on
📈 Trading Strategies
Conservative Approach
Use Dynamic method with Trend Filter ON
Set minimum score to 80%
Risk:Reward ratio of 2:1 or higher
Best for: Swing trading
Aggressive Approach
Use Hybrid method with Trend Filter OFF
Set minimum score to 60%
Risk:Reward ratio of 1:1
Best for: Day trading
Scalping Setup
Use Volatility method
Set sensitivity to 2.0+
Focus on Target 1 only
Best for: Quick trades
🎨 Visual Customization
Color Themes:
Neon: Bright cyan/magenta for dark backgrounds
Ocean: Cool blues and teals
Solar: Warm yellows and oranges
Matrix: Classic green terminal look
Gradient: Smooth color transitions
Line Styles:
Solid: Clean, simple line
Glow: Adds depth with glow effect
Pulse: Animated breathing effect
Wave: Oscillating wave pattern
💡 Pro Tips
Start with the Trend Filter ON to avoid catching falling knives
Higher quality scores (80%+) have better win rates but fewer signals
Use Volume Profile method near major support/resistance levels
Combine with your favorite momentum indicator for confirmation
The pulse animation can help draw attention to key levels
⚠️ Important Notes
This indicator identifies potential entries, not guaranteed profits
Always use proper risk management
Works best on liquid instruments with good volume
Backtest your settings before live trading
Not financial advice - use at your own risk
📊 Statistics Panel
The live statistics panel shows:
Current detection method
Support level value
Trend direction
Distance from support
Current signal status
🤝 Support
Created by AlphaNatt
For questions or suggestions, please comment below!
Happy dip hunting! 🎯
Not financial advice, always do your own research


CandleTrack Pro | Pure Price Action Trend Detection CandleTrack Pro | Pure Price Action Trend Detection with Smart Candle Coloring
📝 Description:
CandleTrack Pro is a clean, lightweight trend-detection tool that uses only candle structure and ATR-based logic to determine market direction — no indicators, no overlays, just pure price action.
🔍 Features:
✅ Smart Candle-Based Trend Detection
Uses dynamic ATR thresholds to identify trend shifts with precision.
✅ Doji Protection Logic
Automatically filters indecision candles to avoid whipsaws and false signals.
✅ Dynamic Bull/Bear Color Coding
Bullish candles are colored green, bearish candles are colored red — see the trend instantly.
✅ No Noise, No Lag
No moving averages, no smoothing — just real-time decision-making power based on price itself.
📈 Ideal For:
Price action purists
Scalpers and intraday traders
Swing traders looking for clear visual bias
─────────────────────────────────────────────────────────────
Disclaimer:
This indicator is provided for educational and informational purposes only and should not be considered as financial or investment advice. The tool is designed to assist with technical analysis, but it does not guarantee any specific results or outcomes. All trading and investment decisions are made at your own risk. Past performance is not indicative of future results. Always do your own research and consult with a qualified financial advisor before making any trading decisions. The author accepts no liability for any losses or damages resulting from the use of this script. By using this indicator, you acknowledge and accept these terms.
─────────────────────────────────────────────────────────────

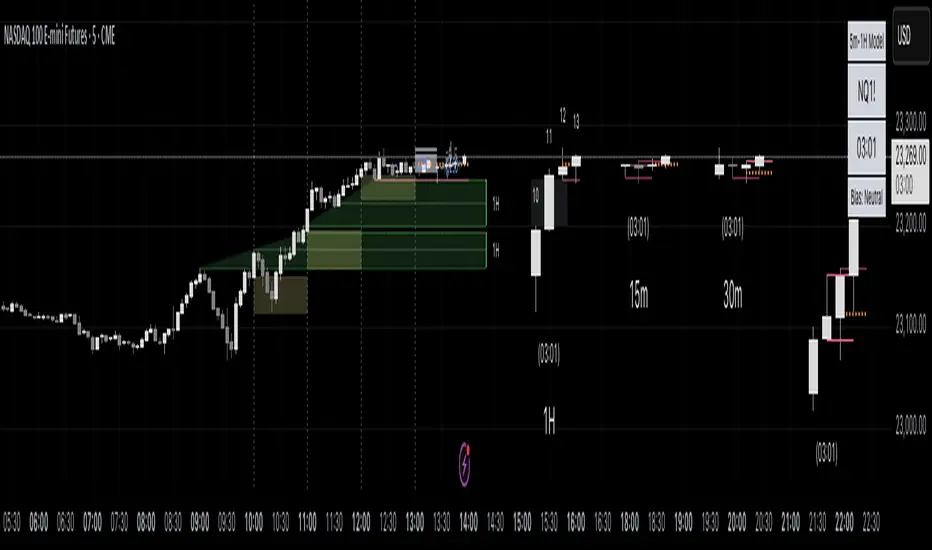
CandelaCharts - HTF Sweeps📝 Overview
This indicator lets you overlay a higher timeframe (HTF) onto your current chart, giving you a clearer view of broader market movements without switching timeframes.
This indicator also detects liquidity sweeps and plots them on both the higher timeframe (HTF) and the current lower timeframe (LTF), helping traders clearly spot potential reversal points. It adds LTF dividers for better structure clarity, making it easier to align with HTF shifts and refine entry timing with greater precision.
📦 Features
This indicator identifies price sweeps and their invalidations, helping traders spot potential liquidity grabs and failed breakout attempts.
Overlay a configurable higher timeframe (HTF) on the current chart
Detects and plots liquidity sweeps on both HTF and LTF
Adds lower timeframe (LTF) dividers for improved structure clarity
Ideal for ICT-style top-down analysis and precision entries without switching charts
⚙️ Settings
Customize the indicator to suit your strategy. Alert options are also available, so you can stay informed when key market events are triggered.
Timeframes: Select the higher timeframe (HTF) to overlay on your current chart.
HTF Coloring: Customize the color scheme for HTF candles.
HTF Offset: Space of HTF Candles and current chart.
HTF Size: Adjust the size of HTF candles.
HTF Labels: Toggle labels for HTF.
LTF H/L Line: Show or hide high/low lines from the lower timeframe.
LTF O/C Line: Display open/close lines from the lower timeframe.
Sweep: Enable detection and plotting of liquidity sweeps.
I-sweep: Toggle invalidated sweep detection.
Alerts: Enable Sweep Formation or Invalidation alerts
⚡️ Showcase
See the indicator applied in live market scenarios, illustrating how sweep detections and invalidations unfold on various charts.
HTF Candles
HTF Sweeps
LTF Sweeps
Invalidated Sweeps
🚨 Alerts
This indicator includes built-in alert functionality to keep you informed of key market events in real time. It supports the following customizable alerts on TradingView:
Sweep Detection: Notifies you when a price sweep is detected—either a liquidity sweep above recent highs or below recent lows. This can be a strong signal of potential reversals or liquidity grabs by larger market participants.
Sweep Invalidation: Alerts you when a previously detected sweep becomes invalidated due to price action moving beyond a defined threshold. This helps traders stay adaptive and avoid acting on outdated signals.
These alerts are fully integrated with TradingView’s native alert system, so you can receive notifications via app, email, or pop-up—ensuring you're always up to date, even when you're away from the chart.
⚠️ Disclaimer
Trading involves significant risk, and many participants may incur losses. The content on this site is not intended as financial advice and should not be interpreted as such. Decisions to buy, sell, hold, or trade securities, commodities, or other financial instruments carry inherent risks and are best made with guidance from qualified financial professionals. Past performance is not indicative of future results.

HTF/LTF Boxes v2.2HTF/LTF boxes with GANN levels
added second LTF
Script is identifying hourly boxes and breakouts in respective quarters.
Two lower time frames are available, also gann levels of previous hour's range is available.

Ultra BUY SELL//@version=5
indicator("Ultra BUY SELL", overlay = false)
// Inputs
src = input(close, "Source", group = "Main settings")
p = input.int(180, "Trend period", group = "Main settings", tooltip = "Changes STRONG signals' sensitivity.", minval = 1)
atr_p = input.int(155, "ATR Period", group = "Main settings", minval = 1)
mult = input.float(2.1, "ATR Multiplier", step = 0.1, group = "Main settings", tooltip = "Changes sensitivity: higher period = higher sensitivty.")
mode = input.string("Type A", "Signal mode", options = , group = "Mode")
use_ema_smoother = input.string("No", "Smooth source with EMA?", options = , group = "Source")
src_ema_period = input(3, "EMA Smoother period", group = "Source")
color_bars = input(true, "Color bars?", group = "Addons")
signals_view = input.string("All", "Signals to show", options = , group = "Signal's Addon")
signals_shape = input.string("Labels", "Signal's shape", options = , group = "Signal's Addon")
buy_col = input(color.rgb(0, 255, 8), "Buy colour", group = "Signal's Addon", inline = "BS")
sell_col = input(color.rgb(255, 0, 0), "Sell colour", group = "Signal's Addon", inline = "BS")
// Calculations
src := use_ema_smoother == "Yes" ? ta.ema(src, src_ema_period) : src
// Source;
h = ta.highest(src, p)
// Highest of src p-bars back;
l = ta.lowest(src, p)
// Lowest of src p-bars back.
d = h - l
ls = ""
// Tracker of last signal
m = (h + l) / 2
// Initial trend line;
m := bar_index > p ? m : m
atr = ta.atr(atr_p)
// ATR;
epsilon = mult * atr
// Epsilon is a mathematical variable used in many different theorems in order to simplify work with mathematical object. Here it used as sensitivity measure.
change_up = (mode == "Type B" ? ta.cross(src, m + epsilon) : ta.crossover(src, m + epsilon)) or src > m + epsilon
// If price breaks trend line + epsilon (so called higher band), then it is time to update the value of a trend line;
change_down = (mode == "Type B" ? ta.cross(src, m - epsilon) : ta.crossunder(src, m - epsilon)) or src < m - epsilon
// If price breaks trend line - epsilon (so called higher band), then it is time to update the value of a trend line.
sb = open < l + d / 8 and open >= l
ss = open > h - d / 8 and open <= h
strong_buy = sb or sb or sb or sb or sb
strong_sell = ss or ss or ss or ss or ss
m := (change_up or change_down) and m != m ? m : change_up ? m + epsilon : change_down ? m - epsilon : nz(m , m)
// Updating the trend line.
ls := change_up ? "B" : change_down ? "S" : ls
// Last signal. Helps avoid multiple labels in a row with the same signal;
colour = ls == "B" ? buy_col : sell_col
// Colour of the trend line.
buy_shape = signals_shape == "Labels" ? shape.labelup : shape.triangleup
sell_shape = signals_shape == "Labels" ? shape.labeldown : shape.triangledown
// Plottings
// Signals with label shape
plotshape(signals_shape == "Labels" and (signals_view == "All" or signals_view == "Buy/Sell") and change_up and ls != "B" and not strong_buy, "Buy signal" , color = colour, style = buy_shape , location = location.belowbar, size = size.normal, text = "BUY", textcolor = color.white, force_overlay=true)
// Plotting the BUY signal;
plotshape(signals_shape == "Labels" and (signals_view == "All" or signals_view == "Buy/Sell") and change_down and ls != "S" and not strong_sell, "Sell signal" , color = colour, style = sell_shape, size = size.normal, text = "SELL", textcolor = color.white, force_overlay=true)
// Plotting the SELL signal.
plotshape(signals_shape == "Labels" and (signals_view == "All" or signals_view == "Strong") and change_up and ls != "B" and strong_buy, "Strong Buy signal" , color = colour, style = buy_shape , location = location.belowbar, size = size.normal, text = "STRONG", textcolor = color.white, force_overlay=true)
// Plotting the STRONG BUY signal;
plotshape(signals_shape == "Labels" and (signals_view == "All" or signals_view == "Strong") and change_down and ls != "S" and strong_sell, "Strong Sell signal" , color = colour, style = sell_shape, size = size.normal, text = "STRONG", textcolor = color.white, force_overlay=true)
// Plotting the STRONG SELL signal.
// Signal with arrow shape
plotshape(signals_shape == "Arrows" and (signals_view == "All" or signals_view == "Buy/Sell") and change_up and ls != "B" and not strong_buy, "Buy signal" , color = colour, style = buy_shape , location = location.belowbar, size = size.tiny, force_overlay=true)
// Plotting the BUY signal;
plotshape(signals_shape == "Arrows" and (signals_view == "All" or signals_view == "Buy/Sell") and change_down and ls != "S" and not strong_sell, "Sell signal" , color = colour, style = sell_shape, size = size.tiny, force_overlay=true)
// Plotting the SELL signal.
plotshape(signals_shape == "Arrows" and (signals_view == "All" or signals_view == "Strong") and change_up and ls != "B" and strong_buy, "Strong Buy signal" , color = colour, style = buy_shape , location = location.belowbar, size = size.tiny, force_overlay=true)
// Plotting the STRONG BUY signal;
plotshape(signals_shape == "Arrows" and (signals_view == "All" or signals_view == "Strong") and change_down and ls != "S" and strong_sell, "Strong Sell signal" , color = colour, style = sell_shape, size = size.tiny, force_overlay=true)
// Plotting the STRONG SELL signal.
barcolor(color_bars ? colour : na)
// Bar coloring
// Alerts
matype = input.string(title='MA Type', defval='EMA', options= )
ma_len1 = input(title='Short EMA1 Length', defval=5)
ma_len2 = input(title='Long EMA1 Length', defval=7)
ma_len3 = input(title='Short EMA2 Length', defval=5)
ma_len4 = input(title='Long EMA2 Length', defval=34)
ma_len5 = input(title='Short EMA3 Length', defval=98)
ma_len6 = input(title='Long EMA3 Length', defval=45)
ma_len7 = input(title='Short EMA4 Length', defval=7)
ma_len8 = input(title='Long EMA4 Length', defval=11)
ma_len9 = input(title='Short EMA5 Length', defval=11)
ma_len10 = input(title='Long EMA5 Length', defval=15)
ma_offset = input(title='Offset', defval=0)
//res = input(title="Resolution", type=resolution, defval="240")
f_ma(malen) =>
float result = 0
if matype == 'EMA'
result := ta.ema(src, malen)
result
if matype == 'SMA'
result := ta.sma(src, malen)
result
result
htf_ma1 = f_ma(ma_len1)
htf_ma2 = f_ma(ma_len2)
htf_ma3 = f_ma(ma_len3)
htf_ma4 = f_ma(ma_len4)
htf_ma5 = f_ma(ma_len5)
htf_ma6 = f_ma(ma_len6)
htf_ma7 = f_ma(ma_len7)
htf_ma8 = f_ma(ma_len8)
htf_ma9 = f_ma(ma_len9)
htf_ma10 = f_ma(ma_len10)
//plot(out1, color=green, offset=ma_offset)
//plot(out2, color=red, offset=ma_offset)
//lengthshort = input(8, minval = 1, title = "Short EMA Length")
//lengthlong = input(200, minval = 2, title = "Long EMA Length")
//emacloudleading = input(50, minval = 0, title = "Leading Period For EMA Cloud")
//src = input(hl2, title = "Source")
showlong = input(false, title='Show Long Alerts')
showshort = input(false, title='Show Short Alerts')
showLine = input(false, title='Display EMA Line')
ema1 = input(true, title='Show EMA Cloud-1')
ema2 = input(true, title='Show EMA Cloud-2')
ema3 = input(true, title='Show EMA Cloud-3')
ema4 = input(true, title='Show EMA Cloud-4')
ema5 = input(true, title='Show EMA Cloud-5')
emacloudleading = input.int(0, minval=0, title='Leading Period For EMA Cloud')
mashort1 = htf_ma1
malong1 = htf_ma2
mashort2 = htf_ma3
malong2 = htf_ma4
mashort3 = htf_ma5
malong3 = htf_ma6
mashort4 = htf_ma7
malong4 = htf_ma8
mashort5 = htf_ma9
malong5 = htf_ma10
cloudcolour1 = mashort1 >= malong1 ? color.rgb(0, 255, 0) : color.rgb(255, 0, 0)
cloudcolour2 = mashort2 >= malong2 ? #4caf4f47 : #ff110047
cloudcolour4 = mashort4 >= malong4 ? #4caf4f52 : #f2364652
cloudcolour5 = mashort5 >= malong5 ? #33ff0026 : #ff000026
//03abc1
mashortcolor1 = mashort1 >= mashort1 ? color.olive : color.maroon
mashortcolor2 = mashort2 >= mashort2 ? color.olive : color.maroon
mashortcolor3 = mashort3 >= mashort3 ? color.olive : color.maroon
mashortcolor4 = mashort4 >= mashort4 ? color.olive : color.maroon
mashortcolor5 = mashort5 >= mashort5 ? color.olive : color.maroon
mashortline1 = plot(ema1 ? mashort1 : na, color=showLine ? mashortcolor1 : na, linewidth=1, offset=emacloudleading, title='Short Leading EMA1', force_overlay=true)
mashortline2 = plot(ema2 ? mashort2 : na, color=showLine ? mashortcolor2 : na, linewidth=1, offset=emacloudleading, title='Short Leading EMA2', force_overlay=true)
mashortline3 = plot(ema3 ? mashort3 : na, color=showLine ? mashortcolor3 : na, linewidth=1, offset=emacloudleading, title='Short Leading EMA3', force_overlay=true)
mashortline4 = plot(ema4 ? mashort4 : na, color=showLine ? mashortcolor4 : na, linewidth=1, offset=emacloudleading, title='Short Leading EMA4', force_overlay=true)
mashortline5 = plot(ema5 ? mashort5 : na, color=showLine ? mashortcolor5 : na, linewidth=1, offset=emacloudleading, title='Short Leading EMA5', force_overlay=true)
malongcolor1 = malong1 >= malong1 ? color.green : color.red
malongcolor2 = malong2 >= malong2 ? color.green : color.red
malongcolor3 = malong3 >= malong3 ? color.green : color.red
malongcolor4 = malong4 >= malong4 ? color.green : color.red
malongcolor5 = malong5 >= malong5 ? color.green : color.red
malongline1 = plot(ema1 ? malong1 : na, color=showLine ? malongcolor1 : na, linewidth=3, offset=emacloudleading, title='Long Leading EMA1', force_overlay=true)
malongline2 = plot(ema2 ? malong2 : na, color=showLine ? malongcolor2 : na, linewidth=3, offset=emacloudleading, title='Long Leading EMA2', force_overlay=true)
malongline3 = plot(ema3 ? malong3 : na, color=showLine ? malongcolor3 : na, linewidth=3, offset=emacloudleading, title='Long Leading EMA3', force_overlay=true)
malongline4 = plot(ema4 ? malong4 : na, color=showLine ? malongcolor4 : na, linewidth=3, offset=emacloudleading, title='Long Leading EMA4', force_overlay=true)
malongline5 = plot(ema5 ? malong5 : na, color=showLine ? malongcolor5 : na, linewidth=3, offset=emacloudleading, title='Long Leading EMA5', force_overlay=true)
fill(mashortline1, malongline1, color=cloudcolour1, title='MA Cloud1', transp=45)
fill(mashortline2, malongline2, color=cloudcolour2, title='MA Cloud2', transp=65)
fill(mashortline4, malongline4, color=cloudcolour4, title='MA Cloud4', transp=65)
fill(mashortline5, malongline5, color=cloudcolour5, title='MA Cloud5', transp=65)
leftBars = input(15, title='Left Bars ')
rightBars = input(15, title='Right Bars')
volumeThresh = input(20, title='Volume Threshold')
//
highUsePivot = fixnan(ta.pivothigh(leftBars, rightBars) )
lowUsePivot = fixnan(ta.pivotlow(leftBars, rightBars) )
r1 = plot(highUsePivot, color=ta.change(highUsePivot) ? na : #FF0000, linewidth=3, offset=-(rightBars + 1), title='Resistance', force_overlay=true)
s1 = plot(lowUsePivot, color=ta.change(lowUsePivot) ? na : #00ff0d, linewidth=3, offset=-(rightBars + 1), title='Support', force_overlay=true)
//Volume %
short = ta.ema(volume, 5)
long = ta.ema(volume, 10)
osc = 100 * (short - long) / long
//For bull / bear wicks
// This Pine Script™ code is subject to the terms of the Mozilla Public License 2.0 at mozilla.org
// © divudivu600
// Developer By ALCON ALGO
//telegram : @harmonicryptosignals
//@version = 5
//indicator(shorttitle='Oscillator Vision', title='Alcon Oscillator Vision', overlay=false)
n1 = input(10, 'Channel length')
n2 = input(21, 'Average length')
reaction_wt = input.int(defval=1, title='Reaction in change of direction', minval=1)
nsc = input.float(53, 'Levels About Buys', minval=0.0)
nsv = input.float(-53, 'Levels About Sells', maxval=-0.0)
Buy_sales = input(true, title='Only Smart Buy Reversal')
Sell_sales = input(true, title='Only Smart Sell Reversal')
Histogram = input(true, title='Show Histogarm')
//Trendx = input(false, title='Show Trendx')
barras = input(true, title='Divergence on chart(Bars)')
divregbull = input(true, title='Regular Divergence Bullish')
divregbear = input(true, title='Regular Divergence Bearish')
divhidbull = input(true, title='Show Divergence Hidden Bullish')
divhidbear = input(true, title='Show Divergence Hidden Bearish')
Tags = input(true, title='Show Divergence Lable')
amme = input(false, title='Activar media movil Extra para WT')
White = #FDFEFE
Black = #000000
Bearish = #e91e62
Bullish = #18e0ff
Strong_Bullish = #2962ff
Bullish2 = #00bedc
Blue1 = #00D4FF
Blue2 = #009BBA
orange = #FF8B00
yellow = #FFFB00
LEZ = #0066FF
purp = #FF33CC
// Colouring
tf(_res, _exp, gaps_on) =>
gaps_on == 0 ? request.security(syminfo.tickerid, _res, _exp) : gaps_on == true ? request.security(syminfo.tickerid, _res, _exp, barmerge.gaps_on, barmerge.lookahead_off) : request.security(syminfo.tickerid, _res, _exp, barmerge.gaps_off, barmerge.lookahead_off)
ha_htf = ''
show_ha = input.bool(true, "Show HA Plot/ Market Bias", group="HA Market Bias")
ha_len = input(7, 'Period', group="HA Market Bias")
ha_len2 = input(10, 'Smoothing', group="HA Market Bias")
// Calculations {
o = ta.ema(open, ha_len)
c = ta.ema(close, ha_len)
h1 = ta.ema(high, ha_len)
l1 = ta.ema(low, ha_len)
haclose = tf(ha_htf, (o + h1 + l1 + c) / 4, 0)
xhaopen = tf(ha_htf, (o + c) / 2, 0)
haopen = na(xhaopen ) ? (o + c) / 2 : (xhaopen + haclose ) / 2
hahigh = math.max(h1, math.max(haopen, haclose))
halow = math.min(l1, math.min(haopen, haclose))
o2 = tf(ha_htf, ta.ema(haopen, ha_len2), 0)
c2 = tf(ha_htf, ta.ema(haclose, ha_len2), 0)
h2 = tf(ha_htf, ta.ema(hahigh, ha_len2), 0)
l2 = tf(ha_htf, ta.ema(halow, ha_len2), 0)
ha_avg = (h2 + l2) / 2
// }
osc_len = 8
osc_bias = 100 *(c2 - o2)
osc_smooth = ta.ema(osc_bias, osc_len)
sigcolor =
(osc_bias > 0) and (osc_bias >= osc_smooth) ? color.new(Bullish, 35) :
(osc_bias > 0) and (osc_bias < osc_smooth) ? color.new(Bullish2, 75) :
(osc_bias < 0) and (osc_bias <= osc_smooth) ? color.new(Bearish, 35) :
(osc_bias < 0) and (osc_bias > osc_smooth) ? color.new(Bearish, 75) :
na
// }
nsc1 = nsc
nsc2 = nsc + 5
nsc3 = nsc + 10
nsc4 = nsc + 15
nsc5 = nsc + 20
nsc6 = nsc + 25
nsc7 = nsc + 30
nsc8 = nsc + 35
nsv1 = nsv - 5
nsv2 = nsv - 10
nsv3 = nsv - 15
nsv4 = nsv - 20
nsv5 = nsv - 25
nsv6 = nsv - 30
nsv7 = nsv - 35
nsv8 = nsv - 40
ap = hlc3
esa = ta.ema(ap, n1)
di = ta.ema(math.abs(ap - esa), n1)
ci = (ap - esa) / (0.015 * di)
tci = ta.ema(ci, n2)
wt1 = tci
wt2 = ta.sma(wt1, 4)
direction = 0
direction := ta.rising(wt1, reaction_wt) ? 1 : ta.falling(wt1, reaction_wt) ? -1 : nz(direction )
Change_of_direction = ta.change(direction, 1)
pcol = direction > 0 ? Strong_Bullish : direction < 0 ? Bearish : na
obLevel1 = input(60, 'Over Bought Level 1')
obLevel2 = input(53, 'Over Bought Level 2')
osLevel1 = input(-60, 'Over Sold Level 1')
osLevel2 = input(-53, 'Over Sold Level 2')
rsi = ta.rsi(close,14)
color greengrad = color.from_gradient(rsi, 10, 90, #00ddff, #007d91)
color redgrad = color.from_gradient(rsi, 10, 90, #8b002e, #e91e62)
ob1 = plot(obLevel1, color=#e91e6301)
os1 = plot(osLevel1, color=#00dbff01)
ob2 = plot(obLevel2, color=#e91e6301)
os2 = plot(osLevel2, color=#00dbff01)
p1 = plot(wt1, color=#00dbff01)
p2 = plot(wt2, color=#e91e6301)
plot(wt1 - wt2, color=wt2 - wt1 > 0 ? redgrad : greengrad, style=plot.style_columns)
// fill(p1,p2,color = wt2 - wt1 > 0 ? redgrad: greengrad) // old
fill(p1,p2,color = sigcolor)
// new
fill(ob1,ob2,color = #e91e6350)
fill(os1,os2,color = #00dbff50)
midpoint = (nsc + nsv) / 2
ploff = (nsc - midpoint) / 8
BullSale = ta.crossunder(wt1, wt2) and wt1 >= nsc and Buy_sales == true
BearSale = ta.crossunder(wt1, wt2) and Buy_sales == false
Bullishh = ta.crossover(wt1, wt2) and wt1 <= nsv and Sell_sales == true
Bearishh = ta.crossover(wt1, wt2) and Sell_sales == false
plot(BullSale ? wt2 + ploff : na, style=plot.style_circles, color=color.new(Bearish, 0), linewidth=6, title='BuysG')
plot(BearSale ? wt2 + ploff : na, style=plot.style_circles, color=color.new(Bearish, 0), linewidth=6, title='SellsG')
plot(Bullishh ? wt2 - ploff : na, style=plot.style_circles, color=color.new(Strong_Bullish, 0), linewidth=6, title='Buys On Sale')
plot(Bearishh ? wt2 - ploff : na, style=plot.style_circles, color=color.new(Strong_Bullish, 0), linewidth=6, title='Sells on Sale')
//plot(Histogram ? wt1 - wt2 : na, style=plot.style_area, color=color.new(Blue2, 80), linewidth=1, title='Histograma')
//barcolor(barras == true and Bullishh == true or barras == true and Bearishh == true ? Bullish2 : na)
//barcolor(barras == true and BullSale == true or barras == true and BearSale == true ? Bearish : na)
/////// Divergence ///////
f_top_fractal(_src) =>
_src < _src and _src < _src and _src > _src and _src > _src
f_bot_fractal(_src) =>
_src > _src and _src > _src and _src < _src and _src < _src
f_fractalize(_src) =>
f_top_fractal(_src) ? 1 : f_bot_fractal(_src) ? -1 : 0
fractal_top1 = f_fractalize(wt1) > 0 ? wt1 : na
fractal_bot1 = f_fractalize(wt1) < 0 ? wt1 : na
high_prev1 = ta.valuewhen(fractal_top1, wt1 , 0)
high_price1 = ta.valuewhen(fractal_top1, high , 0)
low_prev1 = ta.valuewhen(fractal_bot1, wt1 , 0)
low_price1 = ta.valuewhen(fractal_bot1, low , 0)
regular_bearish_div1 = fractal_top1 and high > high_price1 and wt1 < high_prev1 and divregbear == true
hidden_bearish_div1 = fractal_top1 and high < high_price1 and wt1 > high_prev1 and divhidbear == true
regular_bullish_div1 = fractal_bot1 and low < low_price1 and wt1 > low_prev1 and divregbull == true
hidden_bullish_div1 = fractal_bot1 and low > low_price1 and wt1 < low_prev1 and divhidbull == true
col1 = regular_bearish_div1 ? Bearish : hidden_bearish_div1 ? Bearish : na
col2 = regular_bullish_div1 ? Strong_Bullish : hidden_bullish_div1 ? Strong_Bullish : na
//plot(title='Divergence Bearish', series=fractal_top1 ? wt1 : na, color=col1, linewidth=2, transp=0)
//plot(title='Divergence Bullish', series=fractal_bot1 ? wt1 : na, color=col2, linewidth=2, transp=0)
plotshape(regular_bearish_div1 and divregbear and Tags ? wt1 + ploff * 1 : na, title='Divergence Regular Bearish', text='Bear', location=location.absolute, style=shape.labeldown, size=size.tiny, color=color.new(Bearish, 0), textcolor=color.new(White, 0))
plotshape(hidden_bearish_div1 and divhidbear and Tags ? wt1 + ploff * 1 : na, title='Divergence Hidden Bearish', text='H Bear', location=location.absolute, style=shape.labeldown, size=size.tiny, color=color.new(Bearish, 0), textcolor=color.new(White, 0))
plotshape(regular_bullish_div1 and divregbull and Tags ? wt1 - ploff * 1 : na, title='Divergence Regular Bullish', text='Bull', location=location.absolute, style=shape.labelup, size=size.tiny, color=color.new(Strong_Bullish, 0), textcolor=color.new(White, 0))
plotshape(hidden_bullish_div1 and divhidbull and Tags ? wt1 - ploff * 1 : na, title='Divergence Hidden Bullish', text='H Bull', location=location.absolute, style=shape.labelup, size=size.tiny, color=color.new(Strong_Bullish, 0), textcolor=color.new(White, 0))
/////// Unfazed Alerts //////
////////////////////////////////////////////////-MISTERMOTA MOMENTUM-/////////////////////////////////////
source = input(close)
responsiveness = math.max(0.00001, input.float(0.9, minval=0.0, maxval=1.0))
periodd = input(50)
sd = ta.stdev(source, 50) * responsiveness
var worm = source
diff = source - worm
delta = math.abs(diff) > sd ? math.sign(diff) * sd : diff
worm += delta
ma = ta.sma(source, periodd)
raw_momentum = (worm - ma) / worm
current_med = raw_momentum
min_med = ta.lowest(current_med, periodd)
max_med = ta.highest(current_med, periodd)
temp = (current_med - min_med) / (max_med - min_med)
value = 0.5 * 2
value *= (temp - .5 + .5 * nz(value ))
value := value > .9999 ? .9999 : value
value := value < -0.9999 ? -0.9999 : value
temp2 = (1 + value) / (1 - value)
momentum = .25 * math.log(temp2)
momentum += .5 * nz(momentum )
//momentum := raw_momentum
signal = nz(momentum )
trend = math.abs(momentum) <= math.abs(momentum )
////////////////////////////////////////////////-GROWING/FAILING-//////////////////////////////////////////
length = input.int(title="MOM Period", minval=1, defval=14, group="MOM Settings")
srcc = input(title="MOM Source", defval=hlc3, group="MOM Settings")
txtcol_grow_above = input(#1a7b24, "Above Grow", group="MOM Settings", inline="Above")
txtcol_fall_above = input(#672ec5, "Fall", group="MOM Settings", inline="Above")
txtcol_grow_below = input(#F37121, "Below Grow", group="MOM Settings", inline="Below")
txtcol_fall_below = input(#be0606, "Fall", group="MOM Settings", inline="Below")
ma(source, length, type) =>
switch type
"SMA" => ta.sma(source, length)
"EMA" => ta.ema(source, length)
"SMMA (RMA)" => ta.rma(source, length)
"WMA" => ta.wma(source, length)
"VWMA" => ta.vwma(source, length)
typeMA = input.string(title = "Method", defval = "SMA", options= , group="MA Settings")
smoothingLength = input.int(title = "Length", defval = 5, minval = 1, maxval = 100, group="MA Settings")
smoothingLine = ma(delta, smoothingLength, typeMA)
deltaText=(delta > 0 ? (delta > delta ? " MOM > 0 and ▲ Growing, MOM = " + str.tostring(delta , "#.##") :" MOM > 0 and ▼ Falling, MOM = " + str.tostring(delta , "#.##") ) : (delta > delta ? "MOM < 0 and ▲ Growing, MOM = " + str.tostring(delta , "#.##"): " MOM < 0 and ▼ Falling, MOM = " + str.tostring(delta , "#.##")))
oneDay = 24 * 60 * 60 * 1000
barsAhead = 3
tmf = if timeframe.ismonthly
barsAhead * oneDay * 30
else if timeframe.isweekly
barsAhead * oneDay * 7
else if timeframe.isdaily
barsAhead * oneDay
else if timeframe.isminutes
barsAhead * oneDay * timeframe.multiplier / 1440
else if timeframe.isseconds
barsAhead * oneDay * timeframe.multiplier / 86400
else
0
angle(_src) =>
rad2degree = 180 / 3.14159265359
//pi
ang = rad2degree * math.atan((_src - _src ) / ta.atr(14))
ang
emae = angle(smoothingLine)
emaanglestat = emae > emae ? "▲ Growing": "▼ Falling"
deltaTextxxx = "MOM MA/ATR angle value is " + str.tostring(emae, "#.##") + "° and is " + emaanglestat
deltacolorxxx = emae >0 and emae >=emae ? txtcol_grow_above : txtcol_fall_below
// Label
label lpt1 = label.new(time, -30, text=deltaTextxxx , color=deltacolorxxx, xloc=xloc.bar_time, style=label.style_label_left, textcolor=color.white, textalign=text.align_left, size=size.normal)
label.set_x(lpt1, label.get_x(lpt1) + tmf)
label.delete(lpt1 )
txtdeltaColors = (delta > 50 ? (delta < delta ? txtcol_grow_above : txtcol_fall_above) : (delta < delta ? txtcol_grow_below : txtcol_fall_below))
label ldelta1 = label.new(time, 30, text=deltaText , color=txtdeltaColors, xloc=xloc.bar_time, style=label.style_label_left, textcolor=color.white, textalign=text.align_left, size=size.normal)
label.set_x(ldelta1, label.get_x(ldelta1) + tmf)
label.delete(ldelta1 )

Ultimate Market Structure [Alpha Extract]Ultimate Market Structure
A comprehensive market structure analysis tool that combines advanced swing point detection, imbalance zone identification, and intelligent break analysis to identify high-probability trading opportunities.Utilizing a sophisticated trend scoring system, this indicator classifies market conditions and provides clear signals for structure breaks, directional changes, and fair value gap detection with institutional-grade precision.
🔶 Advanced Swing Point Detection
Identifies pivot highs and lows using configurable lookback periods with optional close-based analysis for cleaner signals. The system automatically labels swing points as Higher Highs (HH), Lower Highs (LH), Higher Lows (HL), and Lower Lows (LL) while providing advanced classifications including "rising_high", "falling_high", "rising_low", "falling_low", "peak_high", and "valley_low" for nuanced market analysis.
swingHighPrice = useClosesForStructure ? ta.pivothigh(close, swingLength, swingLength) : ta.pivothigh(high, swingLength, swingLength)
swingLowPrice = useClosesForStructure ? ta.pivotlow(close, swingLength, swingLength) : ta.pivotlow(low, swingLength, swingLength)
classification = classifyStructurePoint(structureHighPrice, upperStructure, true)
significance = calculateSignificance(structureHighPrice, upperStructure, true)
🔶 Significance Scoring System
Each structure point receives a significance level on a 1-5 scale based on its distance from previous points, helping prioritize the most important levels. This intelligent scoring system ensures traders focus on the most meaningful structure breaks while filtering out minor noise.
🔶 Comprehensive Trend Analysis
Calculates momentum, strength, direction, and confidence levels using volatility-normalized price changes and multi-timeframe correlation. The system provides real-time trend state tracking with bullish (+1), bearish (-1), or neutral (0) direction assessment and 0-100 confidence scoring.
// Calculate trend momentum using rate of change and volatility
calculateTrendMomentum(lookback) =>
priceChange = (close - close ) / close * 100
avgVolatility = ta.atr(lookback) / close * 100
momentum = priceChange / (avgVolatility + 0.0001)
momentum
// Calculate trend strength using multiple timeframe correlation
calculateTrendStrength(shortPeriod, longPeriod) =>
shortMA = ta.sma(close, shortPeriod)
longMA = ta.sma(close, longPeriod)
separation = math.abs(shortMA - longMA) / longMA * 100
strength = separation * slopeAlignment
❓How It Works
🔶 Imbalance Zone Detection
Identifies Fair Value Gaps (FVGs) between consecutive candles where price gaps create unfilled areas. These zones are displayed as semi-transparent boxes with optional center line mitigation tracking, highlighting potential support and resistance levels where institutional players often react.
// Detect Fair Value Gaps
detectPriceImbalance() =>
currentHigh = high
currentLow = low
refHigh = high
refLow = low
if currentOpen > currentClose
if currentHigh - refLow < 0
upperBound = currentClose - (currentClose - refLow)
lowerBound = currentClose - (currentClose - currentHigh)
centerPoint = (upperBound + lowerBound) / 2
newZone = ImbalanceZone.new(
zoneBox = box.new(bar_index, upperBound, rightEdge, lowerBound,
bgcolor=bullishImbalanceColor, border_color=hiddenColor)
)
🔶 Structure Break Analysis
Determines Break of Structure (BOS) for trend continuation and Directional Change (DC) for trend reversals with advanced classification as "continuation", "reversal", or "neutral". The system compares pre-trend and post-trend states for each break, providing comprehensive trend change momentum analysis.
🔶 Intelligent Zone Management
Features partial mitigation tracking when price enters but doesn't fully fill zones, with automatic zone boundary adjustment during partial fills. Smart array management keeps only recent structure points for optimal performance while preventing duplicate signals from the same level.
🔶 Liquidity Zone Detection
Automatically identifies potential liquidity zones at key structure points for institutional trading analysis. The system tracks broken structure points and provides adaptive zone extension with configurable time-based limits for imbalance areas.
🔶 Visual Structure Mapping
Provides clear visual indicators including swing labels with color-coded significance levels, dashed lines connecting break points with BOS/DC labels, and break signals for continuation and reversal patterns. The adaptive zones feature smart management with automatic mitigation tracking.
🔶 Market Structure Interpretation
HH/HL patterns indicate bullish market structure with trend continuation likelihood, while LH/LL patterns signal bearish structure with downtrend continuation expected. BOS signals represent structure breaks in trend direction for continuation opportunities, while DC signals warn of potential reversals.
🔶 Performance Optimization
Automatic cleanup of old structure points (keeps last 8 points), recent break tracking (keeps last 5 break events), and efficient array management ensure smooth performance across all timeframes and market conditions.
Why Choose Ultimate Market Structure ?
This indicator provides traders with institutional-grade market structure analysis, combining multiple analytical approaches into one comprehensive tool. By identifying key structure levels, imbalance zones, and break patterns with advanced significance scoring, it helps traders understand market dynamics and position themselves for high-probability trade setups in alignment with smart money concepts. The sophisticated trend scoring system and intelligent zone management make it an essential tool for any serious trader looking to decode market structure with precision and confidence.

Earnings [theUltimator5]This indicator highlights daily price changes on earnings announcement days using dynamic colors, labels, and optional earnings markers.
🔍 Key Features:
Earnings Detection:
Highlights only the days when an earnings event occurs.
Price Change Calculation:
Computes the percentage change from open to close on earnings day.
Color-coded Labels:
Displays the % change as a floating label above the chart on earnings days.
Color intensity reflects the size and direction of the move:
Bright green for large gains (≥ +10%)
Bright red for large losses (≤ -10%)
White for negligible change
Gradient fades between those extremes
Optional "Earnings" Marker:
A small label marked “Earnings” appears beneath the % change label, controlled by a user toggle.
Background Highlight:
The chart background is shaded on earnings days with a semi-transparent color based on the % change.
⚙️ User Input:
✅ Show 'E' Marker: Toggles the visibility of the "Earnings" label below the main price change label.
✅ Ideal Use Case:
Use this indicator to visually analyze how a stock reacts on earnings days, helping traders spot consistent behavior patterns (e.g., post-earnings rallies or selloffs).

Intraday Spark Chart [AstrideUnicorn]The Intraday Spark Chart (ISC) is a minimalist yet powerful tool designed to track an asset’s performance relative to its daily opening price. Inspired by Nasdaq’s real-time analytics analog dashboards. It visualizes intraday percentage changes as a color-coded sparkline, helping traders quickly gauge momentum and session bias.
Ideal for: Day traders, scalpers, and multi-asset monitors.
Best paired with: 1m to 4H timeframes (auto-warns on higher TFs).
Key metrics:
Real-time % change from daily open.
Final daily % change (updated at session close).
Daily open price labels for orientation.
HOW TO USE
Visual Guide
Sparkline Plot:
A green area/line indicates price is above the daily open (bullish).
A red area/line signals price is below the daily open (bearish).
The baseline (0%) represents the daily open price.
Session Markers:
The dotted vertical lines separate trading days.
Gray labels near the baseline show the exact daily open price at the start of each session.
Dynamic Labels:
The labels in the upper left corner of each session range display the current (or final) daily % change. Color matches the trend (green/red) for instant readability.
Practical Use Cases
Opening Range Breakouts: Spot early momentum by observing how price reacts to the daily open.
Multi-Asset Screening: Compare intraday strength across symbols by applying the indicator to multiple charts.
Session Close Prep: Anticipate daily settlement by tracking the final % change (useful for futures/swing traders).
SETTINGS
Asset (Input Symbol): Defaults to the current chart symbol. Switch to monitor other assets.

Crypto Trend StrengthCrypto Trend Strength Dashboard (11-Point System)
Description:
This indicator is a visually enhanced dashboard that evaluates 11 key technical signals to assess bullish momentum for crypto. Each condition is displayed in a easy reading table for quick interpretation and visual appeal.
Signals include:
Higher highs and higher lows
Price above SMA18 and SMA365
SMA180 > SMA365
Positive slope on SMA180 and SMA365
RSI trending upward
Ideal for traders who want a clean, at-a-glance summary of market strength without scanning multiple charts or indicators.

LBB + RSI Multi-Level + Compact TableBB and RSI scalping script for daily or scalp zone with signals


Область Покупателя/Продавца (Упрощённая версия)Buyer/Seller Zones — Simplified Version
This indicator highlights key candles with increased buyer or seller activity based on anomalous volume and volatility. These candles often mark the beginning of significant price moves.
After detection, the indicator plots zones of interest, which traders can monitor for potential retests or reaction areas.
How to use:
These levels can act as reference points for limit entries on retests.
However, not every zone should be traded blindly. It is strongly advised to combine with other tools (e.g., trend context, volume confirmation, higher timeframe structure).
Note: Display customization is available — choose between box, circle, or diamond highlights, and tune volume/volatility filters to your needs.

Momentum-Reversal System Signals Pro
Momentum-Reversal System Signals Pro
Overview
A sophisticated signaling system designed to identify high-probability trend-following entries after a price pullback. This indicator is optimized for index futures like the S&P 500 (ES/SPX) on a 5-minute timeframe .
It performs best during periods of established trends and lower volatility. To aid in this, the indicator includes a customizable "No-Trade Zone" highlighter, which is pre-set to the often volatile 8:30 AM - 11:30 AM EST market open. While the default settings are robust and effective in most conditions, the indicator is fully customizable to suit your specific trading style.
How It Works
The core logic is based on a three-step process to filter for high-quality setups:
Trend Confirmation: The script first establishes the overall market direction using an EMA on a higher timeframe (15-minute by default). This ensures you are only looking for trades that align with the dominant trend.
Pullback Detection: Once the trend is confirmed, the script waits for the price to pull back to a dynamic area of value on the main chart (5-minute by default). This "pullback zone" is defined by the 5m EMA and an ATR-based channel around it, which adapts to current market volatility.
Momentum Entry: After a valid pullback occurs, the script waits for a clear sign that momentum is returning in the direction of the primary trend. This is confirmed by a combination of a MACD crossover and a strong RSI reading, signaling that the pullback has likely ended and the trend is ready to resume.
Advanced Quality Filters
What makes this indicator powerful is its multi-layered filtering system designed to weed out low-probability signals and avoid choppy market conditions.
Trend Strength: It doesn't just check the trend direction; it measures the slope of the 15m EMA to ensure the trend has sufficient strength. This is a key filter for avoiding flat, sideways markets.
Momentum Confirmation: An RSI "Dead Zone" around the 50-level ensures that the RSI shows decisive momentum before a signal is generated.
Signal Cooldown: A built-in timer ( Min Bars Between Signals ) prevents the same signal from firing repeatedly in a short period, reducing noise and over-trading.
RSI Volatility: The script checks that the RSI itself is not flat, which is often a sign of market indecision and a precursor to chop.
Pullback Quality: An optional filter ensures that by the time the signal fires, the price has already moved back to the "correct" side of the 5m EMA, confirming the reversal's strength.
Volatility Filter: A crucial risk management filter that blocks signals on abnormally large, high-risk "gasoline" bars that could lead to immediate stops.
How To Use
For Long Signals (Green 'Long' Tag):
Look for the 15m EMA to be green and trending upwards.
Wait for price to pull back towards the orange 5m EMA.
A "Long" signal appears when momentum indicators confirm a reversal back in the direction of the trend.
For Short Signals (Red 'Short' Tag):
Look for the 15m EMA to be red and trending downwards.
Wait for price to pull back towards the orange 5m EMA.
A "Short" signal appears when momentum indicators confirm a reversal back in the direction of the trend.
This tool provides high-probability signals, not guarantees. It is designed to be a core component of a complete trading plan. Always use proper risk management and confluence from your own analysis.
Fine-Tuning & Customization
All settings are fully adjustable in the script's "Inputs" tab to match your risk tolerance and market conditions.
Timeframe & EMA Settings: Adjust the core moving averages that define the trend and pullback zones.
Pullback Settings: Define what constitutes a valid pullback by adjusting the lookback period and the size of the ATR-based "near" zone.
Quality Filters: This is the most important section for tailoring the script's strictness. Increase the EMA Slope, RSI Dead Zone, or Signal Cooldown to receive fewer but potentially higher-quality signals.
Advanced Filters: Enable or disable the Pullback Quality and Volatility filters for an extra layer of confirmation or risk management.
No-Trade Zone Highlighter: Adjust the session and timezone to highlight periods you wish to avoid, such as news events or low-liquidity hours.
Happy trading, and please use this tool responsibly.

تنبؤ حركة الشارت (حجم وخطوط اتجاه)this indicator for estimated movement on 15 or 5 mints try it and note the R & S lines .
good luke

Trend Buy/Sell Fibonacci Range - KLTThe Trend Buy/Sell Fibonacci Range – KLT indicator identifies bullish and bearish trends based on where the closing price is located within a Fibonacci range calculated from the last N candles (default is 10). Instead of analyzing individual candles, this tool takes a broader view of price action using Fibonacci retracement levels across a dynamic multi-candle range.
How It Works:
Range Calculation
The indicator calculates the highest high and lowest low over the last N candles to define the active price range (default: 10 bars).
Fibonacci Levels
Within this range, Fibonacci levels (0.236, 0.382, 0.5, 0.618, 0.786) are dynamically computed. These levels act as internal thresholds to evaluate bullish or bearish pressure.
Trend Identification (via Close Position):
If the closing price is above the 0.618 level, it indicates strong buy pressure → the candle turns green and an upward triangle appears.
If the closing price is below the 0.382 level, it suggests strong sell pressure → the candle turns red and a downward triangle is displayed.
If the close lies between 0.382 and 0.618, the market is considered neutral, and the candle is gray.
Visual Elements:
Colored candles to immediately spot trend conditions.
Triangle signals (optional) for clear Buy/Sell markers.
Fibonacci level lines plotted on the chart for full context (can be toggled on/off).
Customization Options:
Lookback period (number of candles to calculate the range)
Fibonacci threshold levels (upper/lower)
Show/hide arrows and Fibonacci lines
Why Use This Indicator?
This tool is perfect for traders who want a simple visual method to assess trend strength based on price structure, not indicators derived from lagging moving averages. It offers:
Cleaner market structure analysis
Objective trend zones
Customizable sensitivity
Recommended Use:
Works well in conjunction with support/resistance zones, volume, or momentum indicators.
Applicable to any asset class or timeframe.
Credits:
Developed by KLT, combining structure-based logic with Fibonacci precision.

VPT Ribbon (Fixed V6-Compatible)A visual ribbon of EMAs (Exponential Moving Averages) applied to the Volume Price Trend (VPT) line.
It helps you see volume-backed momentum trends — not just price.
---
📈 What VPT Does:
VPT = cumulative sum of (volume × percentage price change)
It rises sharply when price increases on high volume = strong buying
It falls when price decreases on high volume = strong selling
Flat movement = low conviction
---
🧠 What the Ribbon Shows:
Each line in the ribbon is an EMA of the VPT line, colored like this:
Color Meaning
Green shades Strong uptrend supported by volume
Lime Early signs of weakening or pause
Orange Neutral to bearish transition zone
Red shades Strong volume-backed downtrend
When the lines spread and point upward → strong bullish volume momentum.
When the ribbon compresses or flips down → weakening or bearish trend.
---
✅ How to Use:
Observation Interpretation
All EMAs rising + green tones Bullish volume trend
Ribbon narrowing + lime/orange emerging Caution – possible reversal or slowdown
Red tones + EMAs turning downward Bearish volume momentum

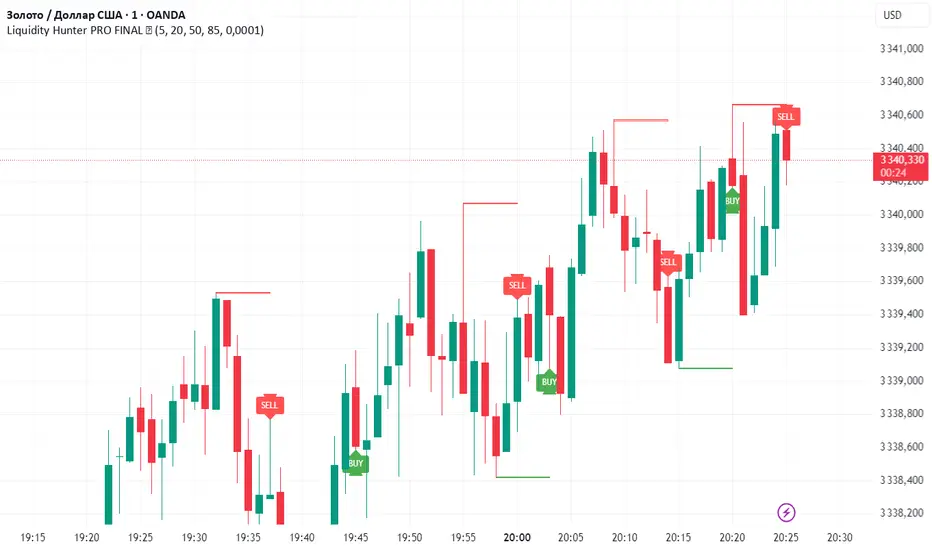
Liquidity Hunter PRO FINAL ✅Liquidity Hunter PRO ✅ is a smart tool designed for traders who want to spot key liquidity sweeps and hunt stop runs with precision.
🔑 How it works:
Automatically plots significant swing highs and lows (liquidity levels) using pivots.
Monitors these levels in real-time and detects when price sweeps above highs or below lows.
Draws clear lines, boxes, and sweep zones to visualize where liquidity was grabbed.
Highlights BUY/SELL opportunities after stop hunts with clean triangle markers and labels.
Fully customizable: set pivot lookback, maximum levels, line age, buffer zone, and visual style.
📌 Features:
✔️ Automatic swing high/low detection
✔️ Dynamic liquidity sweep boxes
✔️ BUY/SELL labels and triangle signals
✔️ Alerts for sweeps above highs and below lows
✔️ Adjustable buffer and line lifetime
✔️ Lightweight, clear and easy to use
💡 Idea: This script helps traders follow Smart Money Concepts (SMC) by showing where the market hunts liquidity before reversals. Combine with your own confluence and strategy for powerful entries.
⚠️ Reminder: Always use this tool with proper risk management — it does not guarantee entries by itself.