OPEN-SOURCE SCRIPT
Rate Of Change - Absolute Value
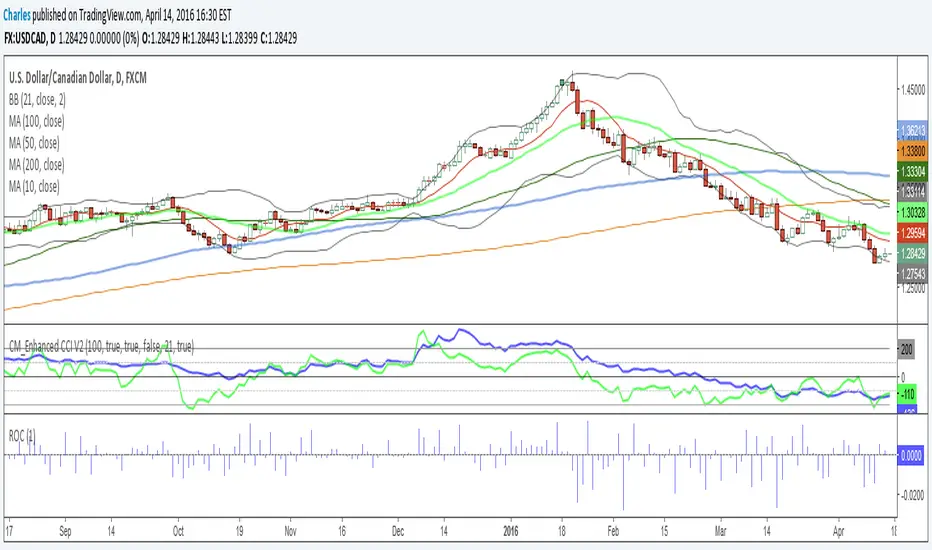
Measures the period's change in terms of the instrument's value (e.g. pip, dollar, etc) instead of as a percentage. I generally use it on a daily time frame with a period=1 to see how the current day's move compares with prior days' moves in order to gain a perspective into how this move ranks historically.
Açık kaynak kodlu komut dosyası
Gerçek TradingView ruhuna uygun olarak, bu komut dosyasının oluşturucusu bunu açık kaynaklı hale getirmiştir, böylece yatırımcılar betiğin işlevselliğini inceleyip doğrulayabilir. Yazara saygı! Ücretsiz olarak kullanabilirsiniz, ancak kodu yeniden yayınlamanın Site Kurallarımıza tabi olduğunu unutmayın.
Feragatname
Bilgiler ve yayınlar, TradingView tarafından sağlanan veya onaylanan finansal, yatırım, işlem veya diğer türden tavsiye veya tavsiyeler anlamına gelmez ve teşkil etmez. Kullanım Şartları'nda daha fazlasını okuyun.