Rate Of Change - Weekly SignalsRate of Change - Weekly Signals
This indicator gives a potential "buy signal" using Rate of Change of SPX and VIX together,
using the following criteria:
SPX Weekly ROC(10) has been BELOW -9 and now rises ABOVE -5
*PLUS*
VIX Weekly ROC(10) has been ABOVE +80 and now falls BELOW +10
The background will turn RED when ROC(SPX) is below -9 and ROC(VIX) is above +80.
The background will turn GREEN when ROC(SPX) is above -5 and ROC(VIX) is below +10.
So the potential "buy signal" is when you start to get GREEN BARS AFTER RED - usually with
some white/empty bars in between...but wait for the green. This indicates that the volatility
has settled down, and the market is starting to turn up.
This indicator gives excellent entry points, but be careful of the occasional false signals.
See Nov. 2001 and Nov. 2008, in both cases the market dropped another 25-30% before the final
bottom was formed. Always have an exit strategy, especially when buying in after a downtrend.
How I use this indicator, pretty much as shown in the preview. Weekly SPX as the main chart with
some medium/long moving averages to identify the trend, VIX added as a "Compare Symbol" in red,
and then the Weekly ROC signals below.
For the ROC graphs, you can show SPX+VIX together, SPX alone, or VIX alone. I prefer to display
them separately because they don't scale well together (VIX crowds out the SPX when it spikes).
Background color is still based on both SPX/VIX together, regardless of which graph is shown.
Note that there is no VIX data available on Trading View prior to 1990, so for those dates the
formula is using only ROC(SPX) and the assigned thresholds (-9 and -5, or whatever you choose).
Değişim Yüzdesi (ROC)

Hull MA and rate of changeUse of hull moving average and rate of change to get buy and sell signals.
Feedback is most welcomed.

COVID-19: Daily change per capita (EU only)New confirmed cases per day (daily change) is one thing, just an absolute value but when we put this number in context of population (per million people) of each country the situation is a bit different.
We can easily see that, at the moment (Apr 2nd, 2020), the most affected country is Spain (~150 new cases per million people per day) and surprisingly the second one is Switzerland (CH). We can also see Spain or Belgium's steep curve relative to other countries.
I know that some countries run more tests than the others and the outcome might not be reflect the reality but this is the official data that is available.

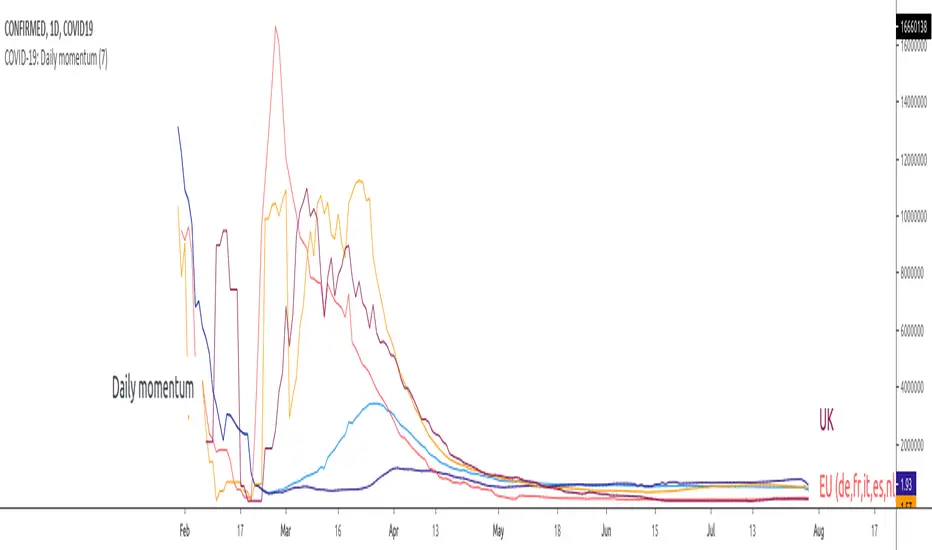
COVID-19: Daily momentumThis indicator shows 14-days moving average of daily rate of change (momentum, acceleration), in other words:
- up trends means that virus accelerates at the rate displayed on the right scale
- consolidation/horizontal movement - virus spreads at constant rate
- down trend - virus looses momentum IMPORTANT: the virus STILL accelerates but at a lower rate
By default the graphic displays World vs. EU vs. US vs. Asia while individual countries are available in Settings.
- EU includes the following countries (DE, FR, IT, ES, CH), all with more than 10k confirmed cases and more than 1k new daily infections.
- Asia includes CH and KR
To use the indicator it is important to disconnect main chart from the right scale, on main chart click on More (the 3 dots) -> Pin to scale -> Select "No Scale".
Return on Investment (ROI)Return on Investment (ROI) is a performance measure used to evaluate the efficiency of an investment in a particular asset.
This tool provides a %-based ROI that can be calculated starting from a specific date or across the entire history of an instrument.
Don't forget to toss a coin to your witcher (see the requisites below)

GMS: RSI & ROC StrategyThis is a basic strategy like the RSI one I posted. This one adds in the Rate of Change indicator as well.
You can separate the two for RSI only and ROC only. Everything else is the same as the RSI strategy.
- Simple moving average trend filter.
- Simple moving average trade exit.
- Both long and short or each on it's own.
The source code should be open if you want to see it or modify it for your own project. I hope it helps!
Andre
Global Market Signals

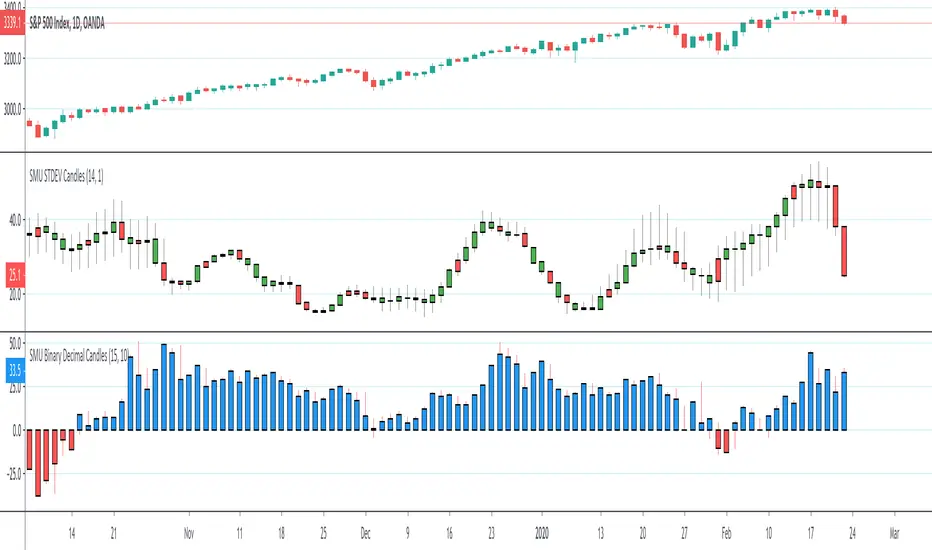
SMU Binary Decimal CandlesThis script creates a Decimal and Binary representation of the price using ROC. The idea is to simplify the price action into a distance from Zero to upside and downside.
You can see clearly trend develops in the ROC in the decimal view, kind of like MACD but based on raw price action change. I'm' a big fan of raw price action, so my scripts are super simple.
You can also use this script in a binary mode close higher = 1 and lower is -1. I use the binary mode to remove the psychological pressure of watching the stock going against me. I turn off the actual price and only focus on number of reds vs blue. On a Quantum physics level, when I short, I observe /wish for more reds like last night 1% sell-off
The main message form all my scripts is think outside the box, experiment with something crazy that doesn't make sense at first and make it to make sense. I always start with an idea that pops into my head, script with Pine script super simple and then watch it for hours to see what is trying to tell me. I have many work in progress that still doesn't make sense but looks really weird and wonderful. When I figure out what is trying to tell me I publish it
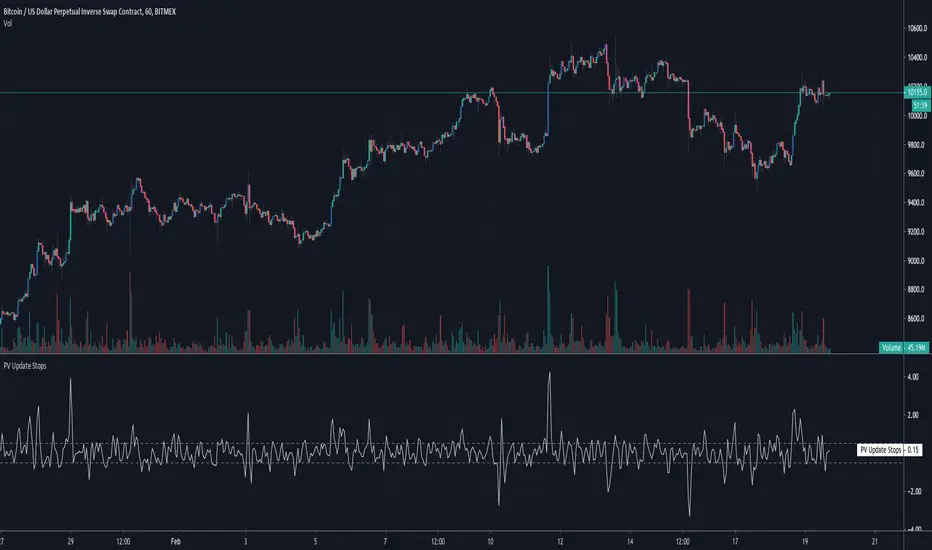
ROC Alerts (Update PV Stops)Measures the Rate of Change (%, ROC) over the previous X bars and fires an Up or Down alerts which you can use to update your TP/SL stops, increase or decrease your position... or anything else really. Basic but proven useful :)
Growing or Waning Patterns [Alerts]Example how to color patterns of 3 bodies growing or waning by percentage with or without trend. Also included option for alert triggers. The yellow triangles on the chart denote where the alert triggers will fire.
• Choose Pattern Of Filter: shows bodies growing or waning or both.
• Sample Lengths Of AvgBar: number of recent bars to use for average size.
• BigBar Is Min% Of AvgBar: the minimum percent of average the big bar must be.
• MedBar Is Max% Of BigBar: the maximum percent of big bar the medium bar can be.
• SmlBar Is Max% Of MedBar: the maximum percent of medium bar the small bar can be.
• Repeat Pattern If n Bars: the number of bars to ignore repeat patterns, 1 allows all.
• Trending: on requires the growing or waning patterns to also be trending.
• GrayBars: colors non pattern bodies gray.
NOTICE: This is an example script and not meant to be used as an actual strategy. By using this script or any portion thereof, you acknowledge that you have read and understood that this is for research purposes only and I am not responsible for any financial losses you may incur by using this script!

Rate Of Change Earnings Move - ROCEMRate Of Change Earnings Move
What is it and how does it work?
The Rate of Change Earnings Move indicator or ROCEM is an indicator designed for giving the user an idea of how much a stock has moved up or down in past earnings reports. This is ideal for options traders who can use ROCEM to calculate whether or not their long straddles are actually probable of happening.
How it works
The indicator measures the absolute value rate of change and then calculates the average rate of change for the day of the earnings report for the past 8 earnings reports (2 years). It then takes the current stock price and finds the upper and lower price based on the average rate of change for past earnings.
I have also included a moving average (purple line), use this to see if the current rate of change is higher than usual.
Additionally, earnings reports are marked with a red x on the indicator.
How to trade ROCEM
This is primarily made for options trading so I will be explaining how it can be used for that. It is not suited for traditional stock trading as it does not determine a market direction.
Select a stock with an upcoming earnings
Enter your per leg commissions in the indicator if you want it to calculate new upper and lower prices (makes it easier to determine if the options trade will pass the breakeven when commissions are factored in)
Compare your long straddle breakevens with the upper and lower prices of the indicator. If the upper breakeven is smaller than the upper price in ROCEM and the lower breakeven is larger than the lower price in ROCEM, then a long straddle position could be considered a reasonable trade based on past earnings performance.

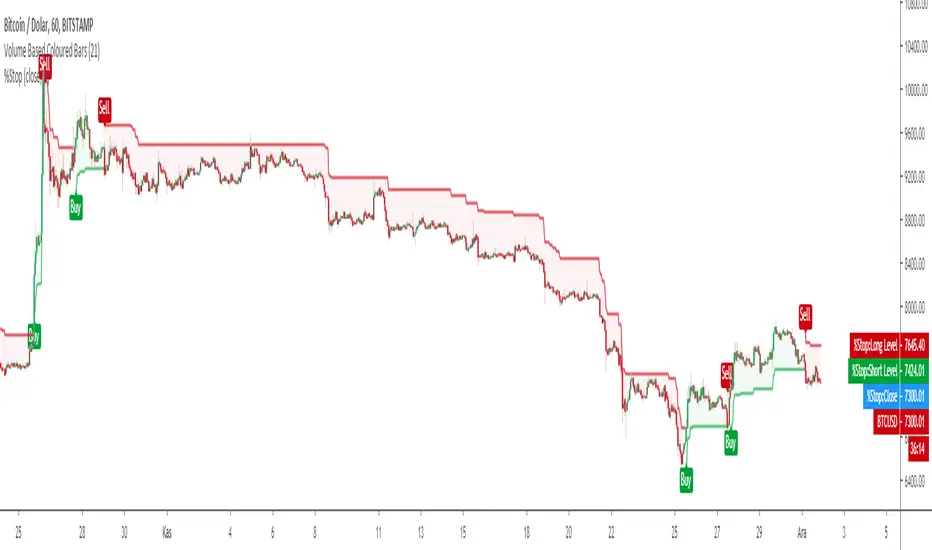
Trailing % StopTrailing % Stop is a simple Stop Loss indicator which users have to define a % percent rate to trail the price like MOVING STOP LOSS "MOST" Indicator.
The main difference is MOST refers to exponential moving averages although Trail % Stop refers to source price.
Default price of source is CLOSE price which can be optimized by the user.
"What is a Trailing Stop-Loss?
A trailing stop-loss order is a special type of trade order where the stop-loss price is not set at a single, absolute dollar amount, but instead is set at a certain percentage or a certain dollar amount below the market price. A trailing stop-loss is sometime referred to simply as a trailing stop.
How a Trailing Stop-Loss Works
When the price goes up, it drags the trailing stop-loss along with it, but when the price stops going up, the stop-loss price remains at the level it was dragged to.
A trailing stop-loss is a way to automatically protect yourself from an investment's downside while locking in the upside.
For example, you buy Company XYZ for $10. You decide that you don't want to lose more than 5% on your investment, but you want to be able to take advantage of any price increases. You also don't want to have to constantly monitor your trades to lock in gains.
You set a trailing stop on XYZ that orders your broker to automatically sell if the price dips more than 5% below the market price.
The benefits of the trailing stop are two-fold. First, if the stock moves against you, the trailing stop will trigger when XYZ hits $9.50, protecting you from futher downside.
But if the stock goes up to $20, the trigger price for the trailing stop comes up along with it. At a price of $20, the trailing stop will only trigger a sale if the stock drops below $19. This helps you lock in most of the gains from the stock's rally.
In the example, you could also decide you don't want to lose more than $2 on your $10 investment. If the stock goes up to $20, the trailing stop-loss would drag along behind the price and only trigger a sale if the stock falls to $18.
Why a Trailing Stop-Loss Matters
A trailing stop-loss can be good for investors who may not have enough discipline to lock-in gains or cut losses. It removes some of the emotion from the trading process and offers some capital protection automatically.
There are some drawbacks to consider. First, you need to consider your trailing stop percentage or amount very carefully. If you're investing in a particularly volatile stock, you could find the stop level triggered fairly frequently."
Long Short signals and alarms are also included.

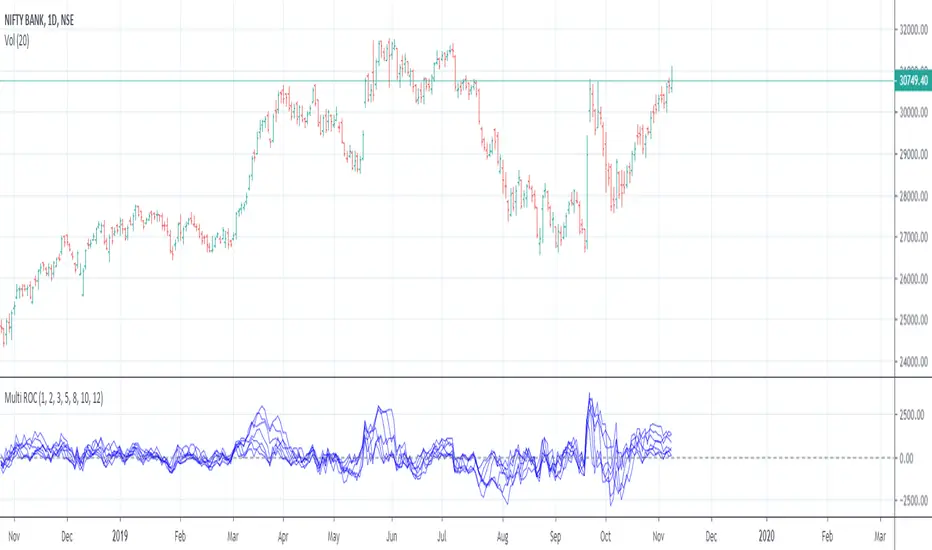
Multiple Rate Of ChangeConvergence of Multiple period Rates of Change near the Zero line shows contraction in volatility.
Soon we can expect expansion in volatility.
Ideal strategy would be to buy ATM Straddles when different period ROCs converge near Zero line.
(Also check implied volatility of options before going for this strategy)
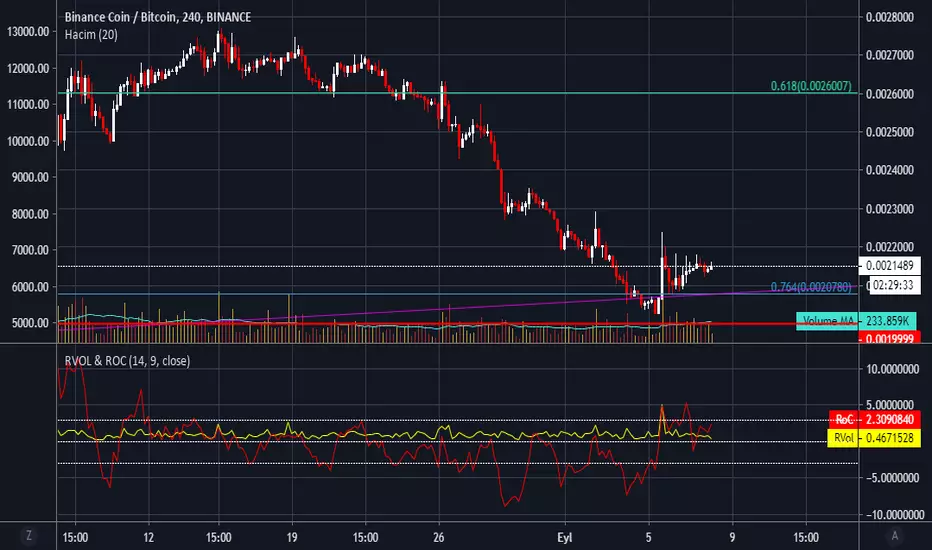
RVol & RoC - Relative Volume & Rate of Change by haciyatmazRelative Volume ( RVol ) is a critical measure of volume flows. It measures current volume in relation to the "usual" volume for this time of the day.
Rate of Change ( RoC ) is a momentum-based technical indicator that measures the percentage change in price between the current price and the price a certain number of periods ago.

Close-to-Close % Change DistributionThis is a graphical representation of things you see everyday in your watchlists - % Changes. This tool uses the entire history of an instrument. Different instruments have different distributions.
Oil
Gold
Bitcoin

(JS) RSI Divergence OscillatorPretty simple really - when the oscillator is positive it means that there's bull RSI divergence, negative means there is bear RSI divergence.
Simple formula to make it, Rate of Change on RSI vs. Rate of Change on price, smoothed out using an EMA.

Breakout Reversal Entry on WMA - NG1! Overnight ver 1This script is for learning purposes only
This strategy will plot arrows when price breaks so far above/below WMA. The strategy will enter when the price breaks away from WMA. All entries are reversals. Users can set WMA length and source; also the distance of the price away from WMA to enter. Adjustable bracket orders are placed for exit, with trailing stop or market stop choice. Last, users can set the time of day they want to enter a trade.
My Preference: I am testing this strategy on NG1! over night on 1 minute candle. with .003 on price drop/climb, I get entries almost every night. Also 10 tick stop and 5 tick profit seems backward to most, but with a high win/loss ratio, it performs quite well. Trailing stops generally help out as well.
INPUTS:
Length - The is the WMA length
Source - WMA source (High, Low, Open, Close...)
When Price Drops - This is the distance in ticks when the price drops away from WMA, an arrow is plotted, and reversal entry order is placed
When Price Climbs - Same as price drop, just in the opposite direction
Trailing Stop check box - Check if you want to place a trailing stop so many tick away from entry. Unchecked is Market (hard) stop so many ticks from entry.
Stop - Number of ticks away from entry a the stop or trailing stop is set (for NG 1 tick = $0.001)
Limit Out - Number of ticks away from entry a limit order is placed to take profits
Limit Time of day check box - check to use the time of day to limit what time of day order entry will occur.
Start/Stop Trades (Est Time) - First box is when the strategy will be allowed to start buying and stop is when the strategy will stop being allowed to buy. Sell orders continue until a stop or limit triggers an exit. These times are Eastern time zone
PROPERTIES:
Pyramiding - This feature will allow multiple entries to occur. If set to 1, the strategy should only trade 1 contract at a time. If set to 2, the strategy will enter a second order if entry requirements are met. This allows you to be holding 2 contracts. Basically on a good day, it will multiply your earnings, on a bad day, you'll just lose more. For testing, I keep this on 1.
TIPS:
- If you want to go long only, set "When Price Climbs" to an impossible number, like 10,000. It's not possible for NG to move $10 is a matter of minutes so it will not enter the market with a short order. Also keep in mind you can set different requirements for going long vs going short. If you think there is more pull on the market in a particular direction.

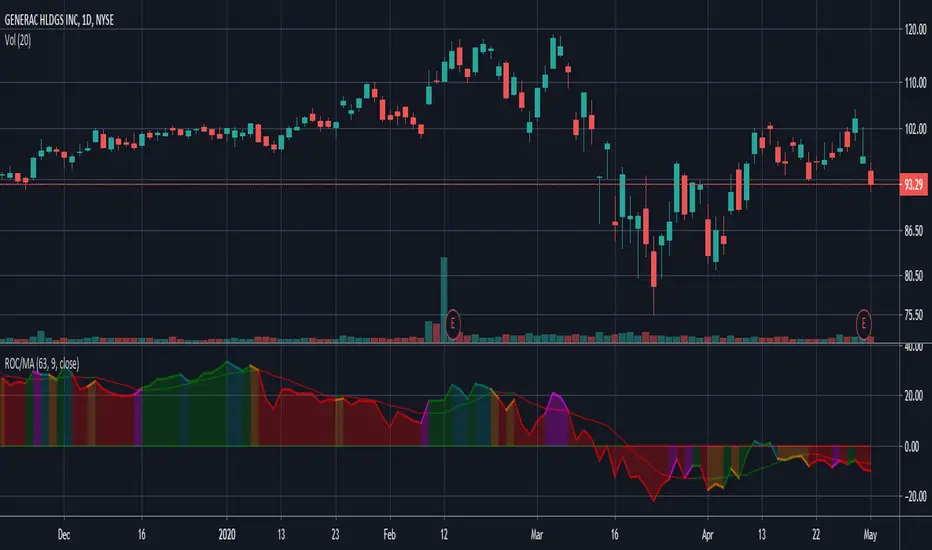
Rate of Change w/ Moving AverageThis is a small spin on the Rate of Change (ROC) indicator where I overlay a simple moving average of the indicator over the prior days.
Year Open Price LevelAn utility tool that plots a dynamic level using the opening price of each year on the chart.
Allows to highlight the change in the price relative to this level.

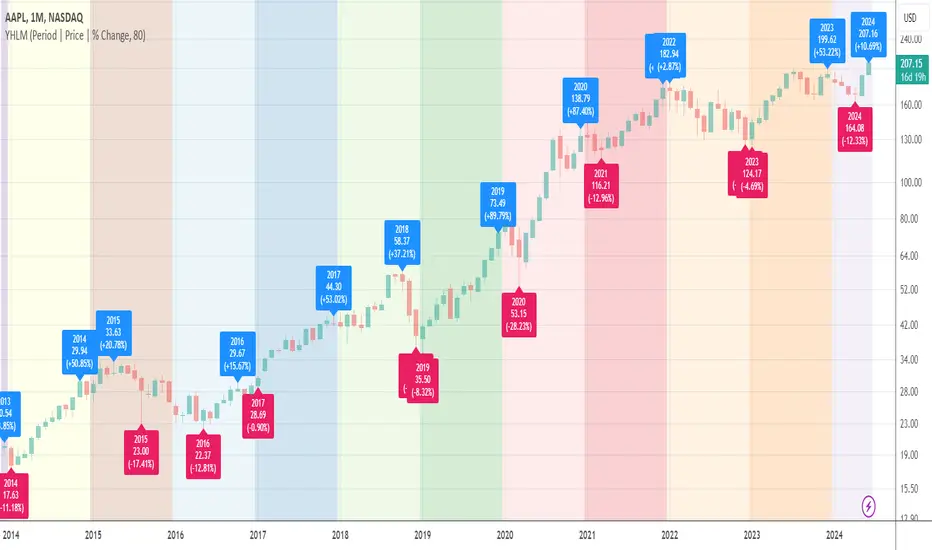
Yearly High/Low MarksAn utility tool for analysts. It marks the highest and lowest prices for each year down to 1989.
Works everywhere and doesn't use any calls of built-in functions that relate to the data extraction.
AAPL, D
AAPL, M
BLX, D
BLX, W
BLX, M
TympanumTrioI started from scratch and borrowed nothing from any source, so its completely unique. Named TypanumTrio, it will evolve into a trend-detector, chop-detector, & volatility detector. Currently its only a trend-detector. Its not a full strategy, rather is an eviron-detection module which will become part of other IMQ strategies, such as Alduin. Tympanum is the hearing organ of dragons & dinosaurs. The trio of companions to Alduin are: Dimetrodon, Spinosaurus, & Ludodactylus. Each of these ancient monsters have either a crest or a sail; Personally I imagine they are sense organs. But they remind me of the crests & sails of the crypto histogram, so I've colorized this first pterodactyl histogram prehistoric hues of green & orange.

Combo Month-to-Month % Return (July - December)This tool acts as Month-to-Month % Return but in Combo mode. Allows to compare the asset's monthly performances across the preferred years. It works everywhere but better in use on the daily timeframe.