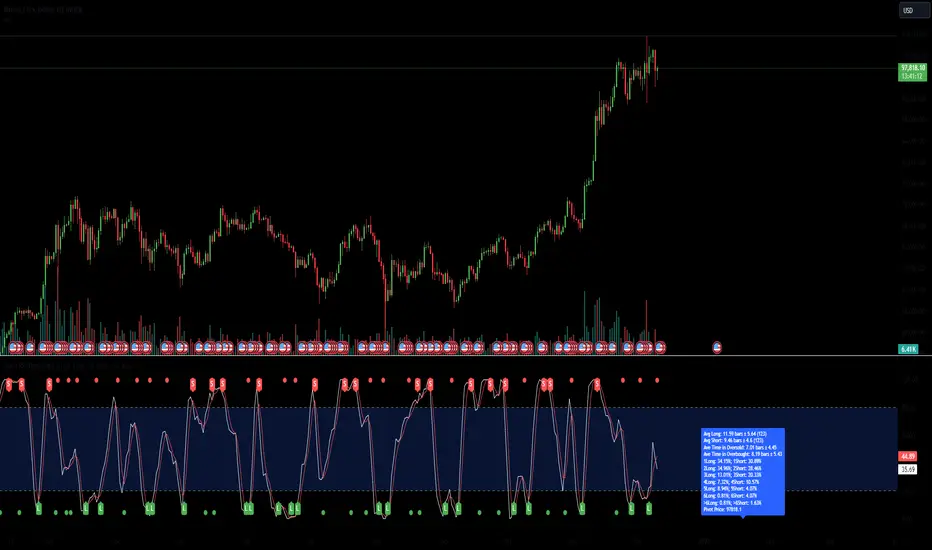
Updated to Pine V5 Enter upon a filtered or aggressive entry If there are multiple entry signals, allow pyramiding Exit when there is Stochastic RSI crossover above 80 Work with some futures and futures timeframes Based on Chris Moody's Vix Fix
>> How to use this indicator : 1. Set your teadingview theme to dark theme. 2. My indicator is valid for forex, stock and but more valid for crypto. 3. Use three timeframe for more validation (choose between those, that fit to your trading style) : - Timeframe 1m, 5m, and 15m for Scalping - Timeframe 30m, 1h and 4h for Intraday - Timeframe 4h, 1D and 1W for...
What is the StochRSI + MA Strategy? This premium indicator was inspired by my desire to find and place high probability forex trades in any market, direction, or time of day. Why Forex? The Forex markets operate 24 hours, 5.5 days a week Access to meaningful leverage Ability to easily trade long or short High liquidity How to use it! ----- First, start by...
This script is based off of Chris Moody's Vix Fix Indicator modified by OskarGallard and BigBitsIO's Stochastic Weights. This script is a compilation of several different stochastic indicators (and RSI ) where the K value of each indicator is equally weighted. The purpose of the indicator is to combine many indicators together in a fashion that weights them...
This indicator indicates that 'Momentum Discrepancy Reversal Point' = 'MDRP'. Mixing and modifying several general indicators to find support and resistance It is created to predict the change point of the trend by overlaying it on the chart. The 4 support and resistance lines are drawn live, and the changed support and resistance lines are It erases the line and...
This strategy uses Hull Suite with Stoch RSI Uses Hull Suite as trend and only trades with the direction of the trend. Entry conditions: Hull Suite as a trend Stoch RSI overbought for short entries & oversold for long entries Current parameters works best on BINANCE:BNBBUSDPERP pair.
The code is based on the Stochastic RSI Heatmap, but uses a normal Stochastic instead the Stochastic RSI when calculating "k" for more accuracy. Credit for the idea goes to Indicator-Jones. The heatmap starts from the oversold (20) / overbought (80) levels respectively. The more oversold / overbought the price, the more intense the color (blue / fuchsia)
Hello, one of my first public scripts! This strategy uses: 1. 2 EMA's 2. Stochastic RSI 3. ATR Very simple, yet effective strategy. The strategy will go long when stochastic crosses under the oversold area and and price has pulled back to the fast EMA - while price is above the long term EMA. Vice versa for shorts. The stop loss and take trofit are both...
MTF Stochastic Zones w/ Candle and Swing Hi/Lo Indicators by // © KaizenTraderB This indicator will display the Stochastic RSI as color zones utilizing 3 Timeframes of your choice as well as key reversal candles: Entry Timeframe StochRSI Crossovers and Long Wick Reversal Candles (Hammer and Hanging Man) and Engulfing Candles That correlate with Swing Highs and...
MTF Stochastic RSI w/ Zones by // © KaizenTraderB I revamped my original Stochastic RSI Band indicator with more accurate algorithms, cleaner coding and more adjustable options. I will be soon releasing a variation of this indicator that prints over price chart with key candle indicators This indicator will display the Stochastic RSI in 3 Timeframes of your...
Stochastic RSI Bands by // © drbarry92064859 It is suggested to view this indicator on 15m or 5m timeframe with current Default Settings. This indicator is based on the StochRsi. It creates color bands based on the direction of multiple timeframe StochRsi. When the MTF StochRsi's are opposed in direction it produces darker bands and when aligned in...
Stochastic RSI presented as a heatmap starting from the oversold (20) / overbought (80) levels respectively. The more oversold / overbought the price, the more intense the color (blue / fuchsia).
This Stochastic scanner can be use to identify overbought and oversold of 10 symbols over multiple timeframes it will give you a quick overview which pair is more overbough or more oversold and also signals tops and bottoms in the AVG row light red/green cell = weak bearish (Stoch = 30-20) / bullish (Stoch = 70-80) medium red/green cell = bearish (Stoch =...
INDICATOR DIRECTION TABLE WITH BULLISH AND BEARISH LABELS This is a table that shows the bullish, bearish or neutral trend for nine different popular indicators. Each indicator label will change color in real time to make you aware of each change in direction. This way you don’t have to read and analyze a bunch of different indicators constantly and you can focus...
Welcome to Market Sniper! This indicator attempts to catch market tops and bottoms based on the market being extremely extended in its respectful direction. It combines a Triple Stochastic RSI as well as MACD convergences to strengthen the signal. A standard RSI can also be shown if needed. Highlighted green means that you are moving towards a potential...
The RSI signal is displayed with different color zones to reflect the value on the chart. This makes field evaluation more efficient. RSI values of different time frames are displayed in the table, helping to evaluate the market more objectively. A Retest Buy signal is given when the RSI value decreases from the area of more than 80 to 50. Retest Sell signal is...
A indicator which combines the QQE indicator, which is a momentum based indicator to determine trend and sideways. The Qualitative Quantitative Estimation (QQE) indicator works like a smoother version of the popular Relative Strength Index ( RSI ) indicator. QQE expands on RSI by adding two volatility based trailing stop lines. These trailing stop lines are...