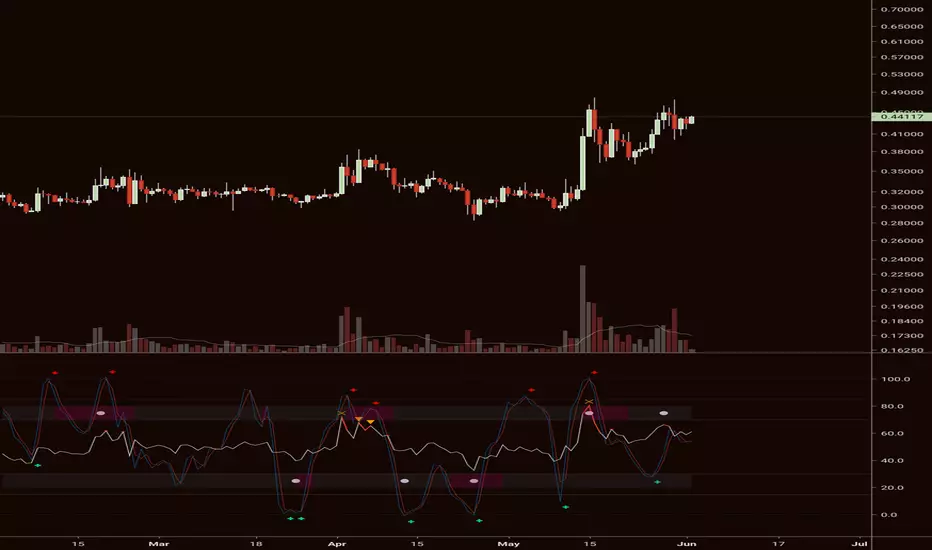
Cynotronic Divergence toolThis tool was developed to accurately capture divergences. Back-testing has shown it's relatively more accurate in detecting all types of divergences (both hidden and regular).
The tool is NOT to be used in isolation; it's best used in conjunction with moving averages (preferably the 20 SMA);
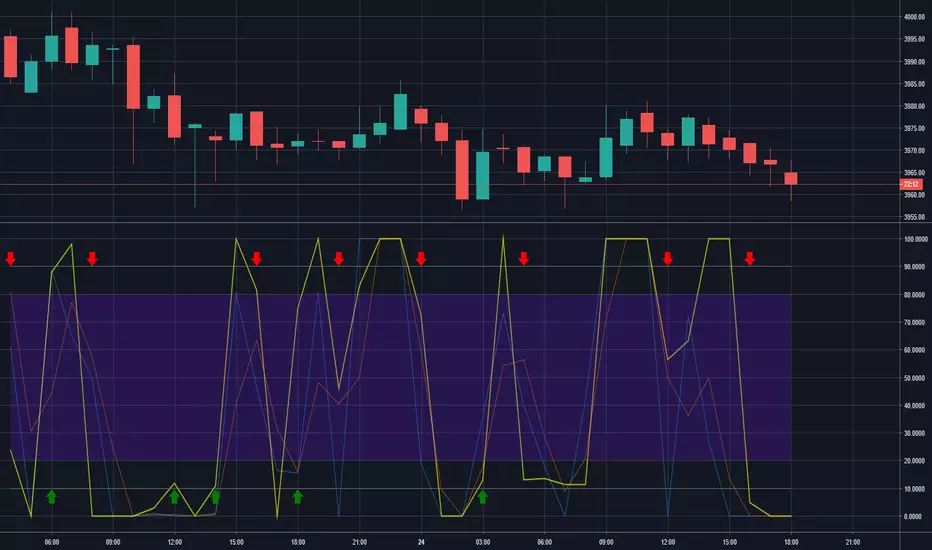
How to use
1. The indicator background indicates bullish (green background color) or bearish (red background color) sentiments;
2. Indicator reversal is most bullish when price action is above MA;
3. Indicator reversal + Green background + price above MA is extremely Bullish ;
4. Indicator reversal + Green background + price below MA is indicative of an incoming distribution phase;
5. Indicator reversal + Red background + price above MA is slightly bullish ;
6. Indicator reversal + Red background + price above MA is indicative of an incoming accumulation period.
Stokastik RSI (STOCH RSI)

PA Researcher MTF Stoch RSIThis is {A Researcher MTF Stoch RSI
OverSold/OverBought HighLight
Ability to Change Time-Frame

Crypto HODLCrypto indicator for the longterm traders. Getting good low entries and with the right stragety highly profitble.

Eagles_nestCredit goes to Chrismoody for building this , Defaults to current timeframe Ability to change to different timeframe, or plot two RSI's on different timeframes.
Edited for Color Customization


(bullyena) Stoch RSI + RSI with alertsStoch RSI and RSI with alerts
Stoch RSI is smoothed using Ehler's formula
BOSS Smooth Stochastic RSI Histogram Oscillator With Alerts THE BEST FOREX, BINARY OPTIONS, AND CRYPTO INDICATORS FOR TRADINGVIEW.COM
Our smooth stochastic rsi in column form with buy and sell alerts.

[AU] Precision StochPrecision Stoch v01
StochRSI with precision crossovers, godmode caution dots, and chande momentum
Adjust "Amped Phase" parameter to adjust lag vs overshoot balance (precision responsiveness)

Ori Stochastic RSI Color CandlesPaints the candles if stoch rsi is higher or lower from given inputs.
Ori Stochastic RSIStotastic RSI with D 4h 1h 30m grids. Grids changes color above 70 or below 30. Green arrow when 3 small timeframe oversold red arrow when 3 small timeframe overbought.


BOSS Smooth Stochastic Bull/Bear Oscillator With Alerts THE BEST FOREX, BINARY OPTIONS, AND CRYPTO INDICATORS FOR TRADINGVIEW.COM
Short Entry
During a price downtrend and you get a sell signal (red dot) enter short when the "K" line (green line) drops below 65 (mid upper band).
Long Entry
During an uptrend, buy when you get a long signal (green dot) and "D" line (red line) rises above 35 (mid lower band) .
Bull/Bear
Green background indicates bullish price action (uptrend)
Red background indicates bearish price action (downtrend)
Available At bosscripts.com
Website bosscripts.com


Stoch + Stoch RSI [R1984]Simple comparison of stochastic based on price versus stochastic based on RSI.
Plan to add more features later like divergence indications, light/dark mode toggle, etc.

Stochastic RSI Signal LinesThis script is for private use only. I created it as step 1 for my Renko Trading Strategy.
Tested on BitMex on XBTUSD.

StochastiXMy indicator is probably the most accurate indicator you can use today to make the most profitable trades. It will be open to the public for a limited time only so enjoy it while it is there. Come DM me if you want exactly how to use it or have the source code. I accept paypal only. Tips and donations are welcome! I hope you have fun with it ;)
ArkWork:: Vector of Candlesこのインジケータは連続した蝋燭とRSIを調べます。
買われ過ぎや売られ過ぎに見える背景にペイントします。
力強い価格変動の場合は、他の抵抗やサポート、修正波、ラインを見てください。
(次のチャンネルレベルへの更新の引き金となる可能性がありますので)
あくまでご参考までに。
This indicator look at the consecutive candle and RSI.
Paint to background of like a overbought or oversold.
If price movement of powerful, please look at the other resistance and support, corrective waves, lines.
(maybe have possibility, to the trigger of update to next channel level)
for your information.

EMA Stochastic Color changeindicator based on "CM Stochastic POP Method 1 - Jake Bernstein_V1", but with some changes.
Are they:
Alteration of SMA by EMA.
Removed the color change of the bars (was conflicting with another candles change indicator)
Changed overbought and oversold values

4 Stochastic + RSI + Stochastic RSI by Theo ParkThis indicator contains :
4 stochastics
1 RSI
1 Stochastic RSI

Bottomed Out v1Bottomed Out - Heads Up
Indicators used internally
Bollinger Bands
Chaikin Money Flow
Money Flow Index
Stoch
Stoch RSI
True Strength Index
Chop Index
Fisher Transform
The main idea behind this indicator is let you know when market is bottoming out, it works on all time frames, higher time frames are recommended.
You can change the bottom value in the properties section this will give you a wider or tighter signal depending on the values.
*Notes:
If price goes lower after a signal, this is possible a bullish divergence, since indicators are going out of the bottomed zone but price is making a new lower low.
