CustomCrossCorrelations+AlertsJust a bunch of neatly displayed commonly used/_reused_ indicators that I mainly use alongside cross-correlation. Simply put, this script might help other traders to enter trades indicative of moves to the upside/downside and want to see more confirmation such as crosses and/or confluence areas.
Feel free to customize to your liking and adjust the options as needed. Credits are given to the other authors whose scripts were referenced and used as boilerplate. Feedback appreciated as well!
Disclaimer: Potential signals are subjective, to each his own. Although some settings may need to be tweaked to the trader's preferences, some prove worthy.
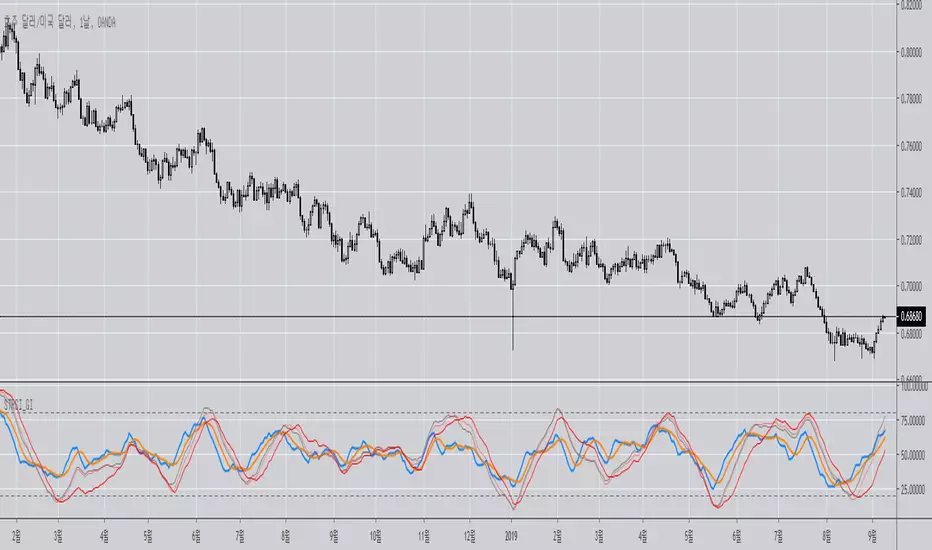
Stokastik RSI (STOCH RSI)

Multi momentum indicatorScript contains couple momentum oscillators all in one pane
List of indicators:
RSI
Stochastic RSI
MACD
CCI
WaveTrend by LazyBear
MFI
Default active indicators are RSI and Stochastic RSI
Other indicators are disabled by default
RSI, StochRSI and MFI are modified to be bounded to range from 100 to -100. That's why overbought is 40 and 60 instead 70 and 80 while oversold -40 and -60 instead 30 and 20.
MACD and CCI as they are not bounded to 100 or 200 range, they are limited to 100 - -100 by default when activated (extras are simply hidden) but there is an option to show full indicator.
In settings there are couple more options like show crosses or show only histogram.
Default source for all indicators is close (except WaveTrend and MFI which use hlc3) and it could be changed but for all indicators.
There is an option for 2nd RSI which can be set for any timeframe and background calculated by Fibonacci levels.

Cloud S.RSIThis indicator included Stochastic RSI, background color changing based on Exponential Moving Average (EMA) crossed Simple Moving Average(SMA), and plotted line 100, 85, 50, 15, and 0. Buy on green background, and Sell on red background.

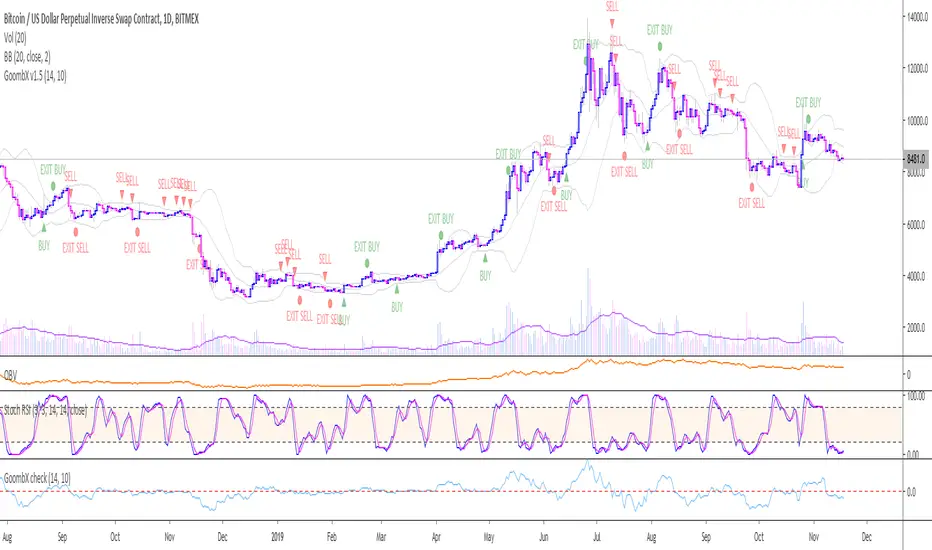
GoombX v1.1 - A trend catcherThis is an MA and stoch RSI based indicator which looks for particular crosses to identify strong trends.
It produces clear signals for:
- LONG ENTRY when it detects a significant MA cross and the right stoch RSI conditions
- LONG EXIT when certain stoch RSI conditions are met
- LONG STOP when price moves x% below entry (default 10%)
- SHORT ENTRY when it detects a significant MA cross and the right stoch RSI conditions
- SHORT EXIT when certain stoch RSI conditions are met
- SHORT STOP when price moves x% above entry (default 10%)
In testing it it performed best on daily chart with a 14 days Lookback window and 10% stop loss
NOTE that a signal is only definitive once the trigger candle has closed
To setup an alert with GoombX, follow these steps:
- Set up GoombX on your chart with the desired parameters and Time Frame
- Click on alerts in the right side of the screen and then Add (+)
- Under Conditions, choose the alert you are looking for (LONG ENTRY, LONG STOP,....)
- Under Options, choose "Once per bar close"
- Create
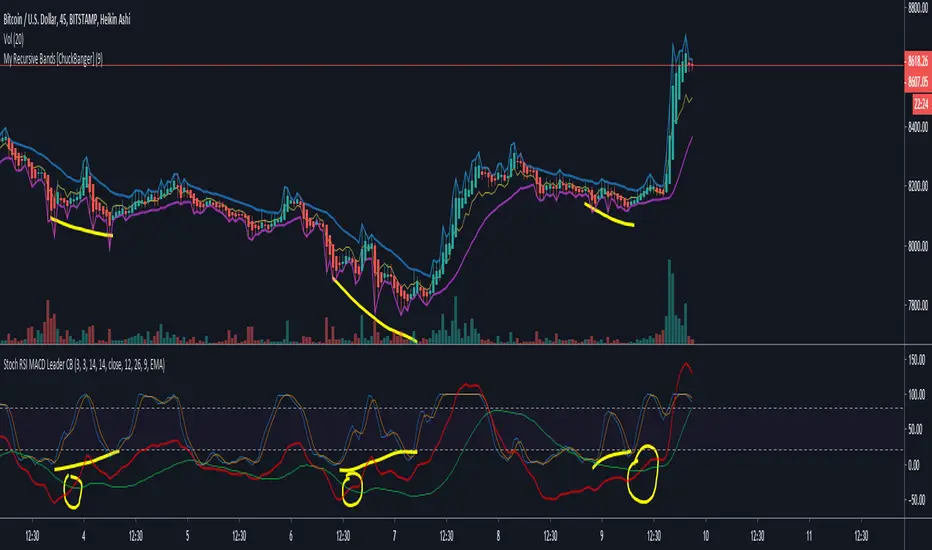
Stochastic RSI and MACD leader [ChuckBanger]Here I have combined Stochastic RSI with my MACD leader.
MACD leader and Stochastic RSI works well together and they are powerful in combination with My Recursive Bands. It is up to you to back test this properly before you use it in real life trades. But in my opinion it is very powerful.
Because of MACD nature it's a little messy when you turn on the MACD's histogram so I commented that out.
MACD Leader:
My Recursive Bands:
Dow Factor Stoch RSIThe indicator was generated by adding the Dow Factor to the Stochastic Relative Strength Index.( Stoch RSI )
The Dow factor is the effect of the correlation coefficient, which determines the relationship between volume and price, on the existing indicators.
With these codes we are able to integrate them numerically into the indicators.
For more information on the Dow factor, please see my indicator:
This code is open source under the MIT license. ( github.com )
My dow factor updates will continue.We adapted the indicators and saw successful results, now it is time to examine and develop the factor itself.
Stay tuned , best regards.

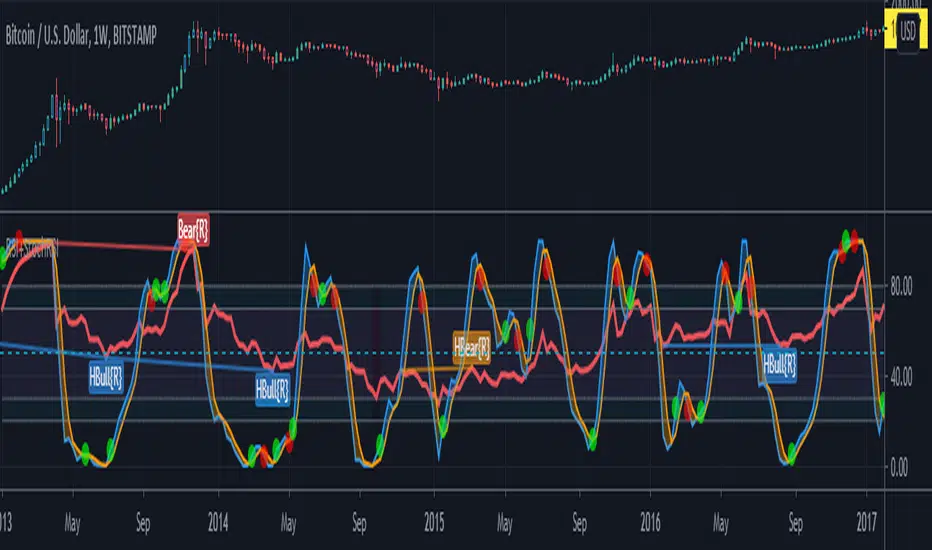
Three StochRSI ComboThree StochRSI with adjustable lengths in one indicator, with no extra bells or whistles. Lazybear's Apirine Slow RSI is used for the RSI formula for the third Stoch.
14-period StochRSI (red) is considered short term.
20-period StochRSI is another short to mid term preset I've seen used in various indicators on different platforms by default, and is included as the yellow stochRSI.
Lazybear's Apirine Slow RSI is used as the base for the third, slower stoch - parameter input adjustment for your specific timeframe and instrument is recommended. The Apirine Slow RSI doesn't have as effective strong divergences during established trends, so the way it would react in when run through a stoch should be more synergistic than not during trending periods for longer term trends.
StochRSI:
StochRSI measures the value of RSI relative to its high/low range over a set number of periods - It's important to note that StochRSI is technically an indicator of an indicator (RSI), which makes it the second derivative of price. This is part of the main contributing factors to how it looks and functions in relation to price.
A move above 80 ---> considered overbought.
A move below 20 ---> considered oversold.
Moves around the midline (50) can also be interpreted as continuation of upward/downwards trend depending on whether the midline is acting more of as a support (uptrend) or a resistance level (downtrend).
Stoch K-line disabled by default/D-line enabled by default.
Stoch K/D lengths are set to 3/3/14/14 (red), 6/6/20/20 (yellow), 12/12 (green) by default.
Midline (50) set to white/silver to make more visible on darkmode charts.
Additional adjustable levels for Overbought/Oversold beyond 20/80 (set at 10/90 by default - see dashed grey line. Dotted line is 20/80.)
Three stochRSI with 3/3/14/14, 6/6/20/20, and 12/12/14/14/6 length are shown below the indicator for reference.
Acknowledgements:
// Aprine Slow RSI - Lazybear
//
// Stockcharts for StochRSI reference
// school.stockcharts.com
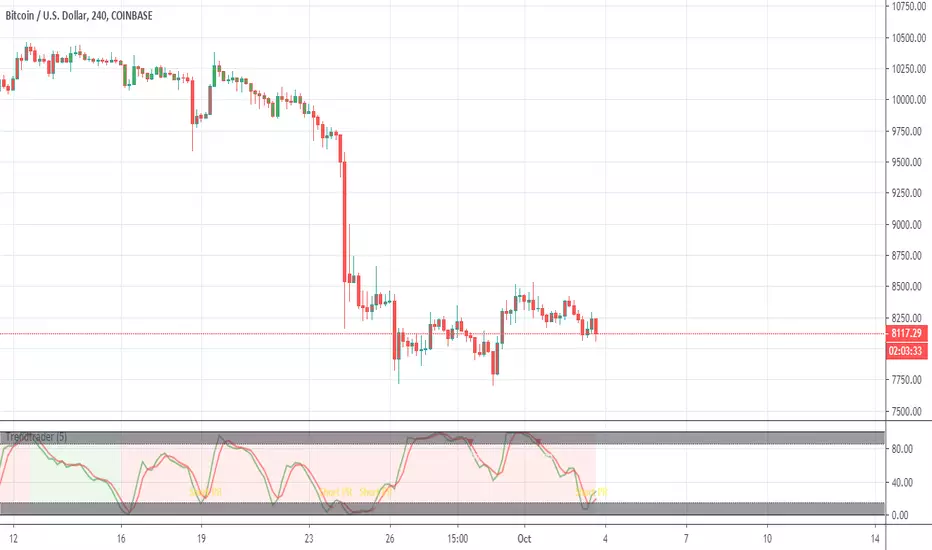
Trendtrader with profit/rentry==Strategy==
Adjust trend code until the majority of the up-trends are green and the downtrends are red. Take 20% profits at the first and second take profit levels while leaving the rest of the trade in until close.
==Indicator includes==
EMA cross, trend analysis, stoc-RSI TP and re-entries.
==Credits==
Trade Indicators for the strategy, jhanson107, for the trend indicator, and Zekis for helping with the TP and re-entries.
MBY_Stochastic RSIthis indicator decrease the noise what standard Stoch RSI has.
so, this indicator more helpful your trading.
good signal : crossover k and b
bad signal : crossunder d and k

AlgoNinja RSI/MACDAlgoNinja buy/sell signal based on MADC/RSI/StochRSI data. BETA - Use at your own risk!

BTC Daily Strategy BFStrategy based on code by @CredibleHulk so thanks for that.
This is a strategy for the Daily Bitcoin chart which uses the MACD, RSI, Stochastic RSI and a moving average.
The conditions for long or short signals depend on the indicators above crossing user-defined thresholds.
Long signal = (Stochastic RSI k value is below Stochastic Sell Threshold) AND EITHER (MACD delta crosses above MACD Threshold OR RSI crosses above RSI Threshold)
Short signal = (MACD delta crosses below 0) AND EITHER (Close Price - an SMA of the ohlc4 values crosses below the DMA threshold OR Stochastic RSI k value is above Stochastic Sell Threshold)
INSTRUCTIONS
Green background = go long
Red background = go short
You can adjust stop loss values for long or short signals in settings as well as all parameters for the indicators.

Sto2 Stochastic RSI for BitcoinStochastic RSI based oscillator with a Rate of Change function added to avoid sideways movements.
Designed around BTC/USD but may be useful elsewhere.
INSTRUCTIONS
Green = go long
Red = go short
White = No trade zone (sideways with not much volatility)

CBCI RSI ParallelParallel version of CBCI Cu + RSI w/ SMA and EMA. It's both indicators, but combined into one indicator space with an adjustable bidirectional offset for the spacing and location.
According to Constance Brown, both the CBCI and RSI are technically supposed to be used in tandem to easily spot divergences - this is an attempt to put that into practice, in one indicator, in the context of tradingview subscription limitations for non Pro/Premium users.

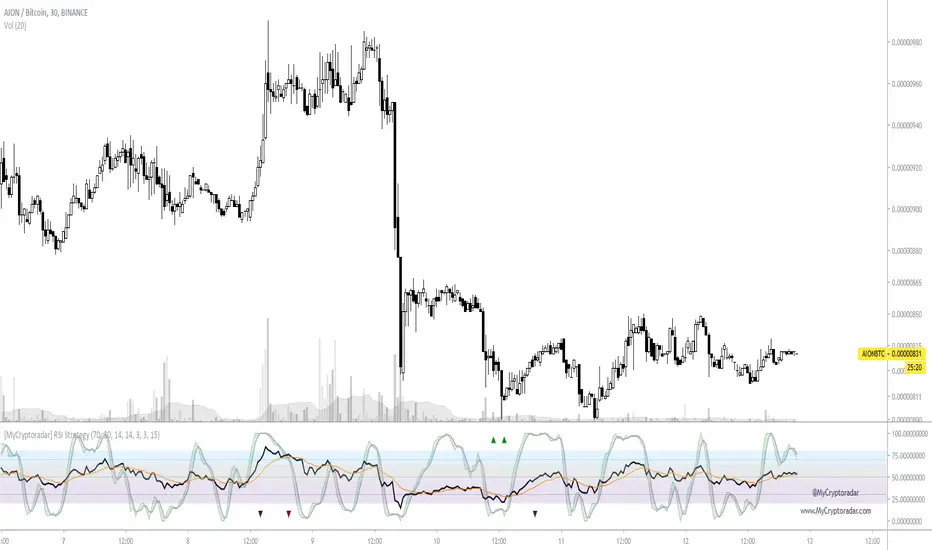
[Coingrats]RSI Divergence + StochRSIThis indicator shows the RSI and StochRSI. RSI divergence will also be marked.
- Bullish divergence - green triangle,
- Hidden bullish divergence - gray triangle
- Bearish divergence = red triangle
- Hidden bearish divergence - gray triangle
Credits to BabyWhale83 for the code to spotting divergence
WANNA TIP ME? BUY ME SOME BEERS!
BTC: 3BMEXX5JrX94ziUSoQMLEmi51WcYwphAg3
ETH: 0x541e504bb461aa141de6ddce09dc89eb16f58f9c
LTC: LPBJXzUZJksCuCK27AY2qAVYGGGiUfejok
DON'T FORGET TO LOOK AT OUR SITE MYCRYPTODARAR.COM
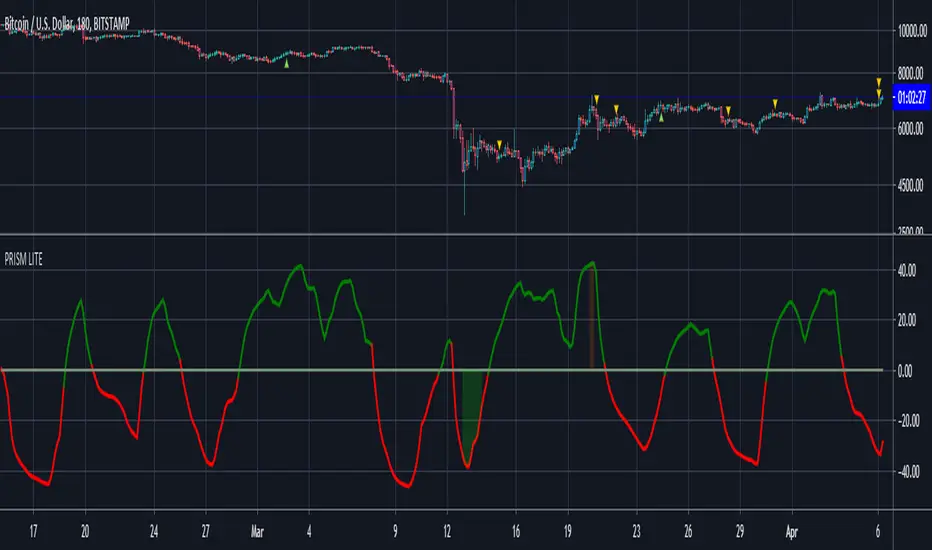
PRISMpSAR derived oscillator with its set of RSI & StochRSI and MAJestic (Momentum, Acceleration, Jerk) Oscillators Set
pSAR and MAJ oscillators can be disabled and hidden.
~ * ~ * ~ * ~ * ~ * ~ * ~ * ~ * ~ * ~ * ~ * ~ * ~ * ~ * ~ * ~ * ~ * ~ * ~ * ~ * ~
Note:
In no way is this intended as a financial/investment/trading advice. You are responsible for your own investment decisions and trades.
Please exercise your own judgement for your own trades base on your own risk-aversion level and goals as an investor or a trader. The use of OTHER indicators and analysis in conjunction (tailored to your own style of investing/trading) will help improve confidence of your analysis, for you to determine your own trade decisions.
~ * ~ * ~ * ~ * ~ * ~ * ~ * ~ * ~ * ~ * ~ * ~ * ~ * ~ * ~ * ~ * ~ * ~ * ~ * ~ * ~
Please check out my other indicators sets and series, e.g.
LIVIDITIUM (dynamic levels),
AEONDRIFT (multi-levels standard deviation bands),
FUSIONGAPS (MA based oscillators),
MAJESTIC (Momentum/Acceleration/Jerk Oscillators),
PRISM (pSAR based oscillator, with RSI/StochRSI as well as Momentum/Acceleration/Jerk indicators),
PDF (parabolic SAR /w HighLow Trends Indicator/Bar-color-marking + Dynamic Fib Retrace and Extension Level)
and more to come.
Constructive feedback and suggestions are welcome.
If you like any of my set of indicators, and it has benefited you in some ways, please consider tipping a little to my HRT fund. =D
cybernetwork @ EOS
37DzRVwodp5UZBYjCKvVoZ5bDdDqhr7798 @ BTC
MPr8Zhmpsx2uh3F5R4WD98MRJJpwuLBhA3 @ LTC
1Je6c1vvSCW7V2vA6RYDt6CEvqGYgT44F4 @ BCH
AS259bXGthuj4VZ1QPzD39W3ut4fQV5giC @ NEO
rDonew8fRDkZFv7dZYe5w3L1vJSE51zFAx @ Ripple XRP
0xc0161d27201914FC0bAe5e350a193c8658fc4742 @ ETH
GAX6UDAJ52OGZW4FVVG3WLGIOJLGG2C7CTO5ZDUK2P6M6QMYBJMSJTDL @ Stellar XLM
xrb_16s8cj8eoangfa96shsnkir3wctdzy76ajui4zexek6xmqssweu85rdjxrt4 @ Nano
~ JuniAiko
(=^~^=)v~

DAX Shooter 5M StrategyThis is a simple strategy that applies very well for scaling indices to 5 minutes especially for the DAX. The algorithm provides for buying or selling when the market is very "pulled". The rules are as follows:
you buy when:
1- The ADX indicator with the standard settings is greater than 32.
2- the RSI indicator set to 7 periods is crossing upwards the oversold line at 30
3- the candle minimum is lower than the lower band of bollinger bands set to 50 periods.
is sold when:
1- ADX indicator with standard settings is greater than 32.
2 - the RSI indicator set to 7 periods is crossing downwards the overbought line at 70
3- the maximum of the candle is higher than the upper band of the bollinger bands set to 50 periods.
Money management is at the discretion of the trader but usually it is better to set a fixed stop loss and a take profit on reaching the opposite bollinger band.
Enjoy trading at all!

Volatility WatchREAD ME FOR INSTRUCTIONS ==>
Signal = Green (bullish) Red (bearish)
Strength indicator = Blue line
Slow Stochastic = Black line
Low- line = Purple dashed
High- line = Red dashed
Has been tested on Stocks, Crypto, and other Currencies
Get help to find trade ideas!! => I look for Daily conditions to be oversold (Signal and Stochastic to be under low- line with Strength moving up)
DIRECTIONS ==>
PART 1 --> When SIGNAL line turns green and STRENGTH line (blue line) are both greater than or equal to the SLOW STOCHASTIC (Black line) -- This indicates Bullish Trend
PART 2 --> IF SIGNAL line, Strength line, and Slow Stochastic are Below the LOW-LINE (Marked at 20) this is an indication of "Oversold" conditions.
PART 3 --> IF SIGNAL line crosses above Slow Stochastic while they are both below the LOW-LINE (Purple dashed line) and Strength line (blue line) has already
crossed above Slow Stochastic line (black line), this indicates a potential buying opportunity and...
depending on time frame the user could use this indicator to accumulate for Long position, day trade the 2 minute chart, or swing trade.


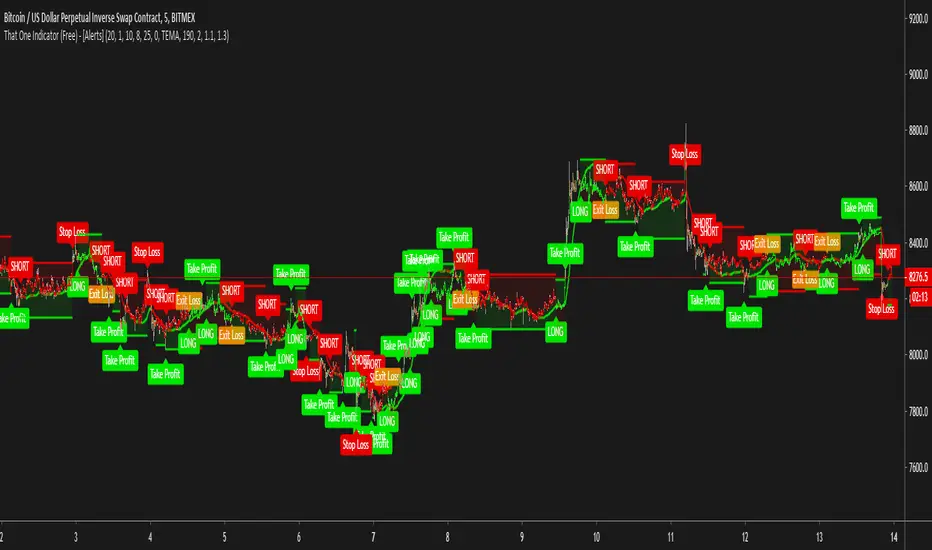
That One Indicator (Free) - [ALERTS]This script comes with the following indicators:
Bollinger Bands
Stochastic
Moving Average Trend Confirmation Filter (EMA, SMA)
Long/Short Alerts
Stop Loss Alerts
And a few more indicators in the back-end to increase accuracy
This script works really well as a scalper on lower Time Frames as well as on higher Time Frames. Besides that you can also trade it on pretty much any coin or asset.
This script is not repainting. We advise to use alerts on “Once Per Bar Close” .
If you’d like to automate this script you can do that by using AutoView, ProfitView, ProfitTrailer, CryptoHopper etc.
Alerts are set very clearly as Long and Short to avoid confusion.
A new script is being published soon with a lot more functionality, which includes noise filtering, all MA Types, RSI and other types of volatility measurements to filter out “less profitable” trades.
Feel free to leave a comment and share it with your friends.
RSI , Products of Nha Son Pleikugiao dịch forex bằng RSI. công cụ tuyệt vời nhất. Mọi người có thể sử dụng hoặc copy chiến lược của mình trên copyhotforex.
