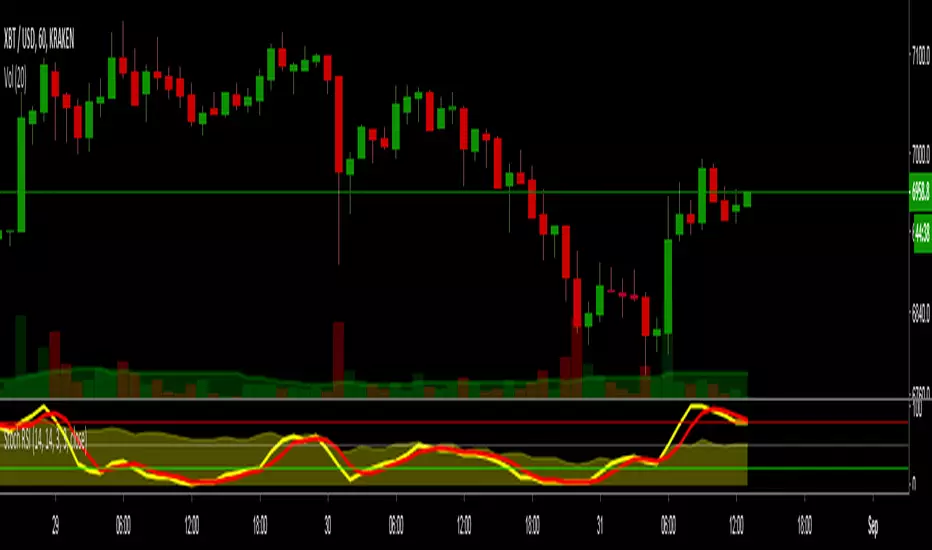
Ultimate Strength Index (USI),Stoch Multi Time Frame(MTF)[cI8DH]Ultimate Strength Index ( USI ) adds stochastic, multi time frame, signal line, histogram, and bar coloring options to RSI and Absolute Strength Index ( ASI ) . It can also turn into an indicator similar to Awesome Oscillator/MACD line. This indicator can be used for analyzing momentum and trendiness/choppiness, as well as identifying swings (stoch). The fix applied in True RSI is also applied here. Chart below shows example multi-TF setup with bar coloring.
For analyzing volume, I made a similar indicator based on money flow and accumulation/distribution, which you can find in the link below.
Aggregation Method
aggregation method = MA Percent => True RSI: momentum and divergence, failure swings
aggregation method = MA => Absolute Strength Index: accurate momentum and divergence
aggregation method = Cumulative => Awesome Oscillator alternative : momentum and divergence, twin peaks, ... (set the smoothing to 5 and signal length to 29ish)
Smoothing, signal line and histogram to detect trend and choppiness
You can apply additional smoothing to USI . Also, you can add a signal line and histogram (histogram is the difference between main line and signal line). To do so, set the signal length to a number greater than one. Signal line can help you detect changes in trend similar to the signal line on MACD. If signal line criss-crosses USI , it shows market is choppy. The worst case is when this criss-crossing coincides with USI flattening near neutral line and histogram height is relatively short; that means market is ded (until it is not; expansion following a contraction period is a common phenomena)! (Bear in mind that histogram will be hidden in stoch mode, and main and signal lines will be hidden in cumulative mode)
Stochastic
To enable stoch, change the stoch length to a number greater than 1 (default stoch length for the built-in RSI stoch is 14). This length should be calibrated depending on TF and asset. If done correctly, it can be a powerful tool for identifying swings. Stoch can be combined with any aggregation method. I recommend using stoch with MA aggregation (i.e. ASI ). For conventional uses of stochastic, please read www.tradingview.com(STOCH) and www.tradingview.com(STOCH_RSI).
Experimental Bar coloring Feature
There is an option to color bars depending on USI's position relative to the signal line. If both TFs are used in coloring and they are in disagreement, the TF with greater histogram height wins. There are two shades of green and red. The darker shade means both TFs agree. If you use the signal line, bar coloring can help with calibrating the indicator (play with parameters until you see a good looking chart i.e. a lot of green candles followed by a lot of red candles in a row). Please note that bar colors might change until candle(s) close(s). The bar coloring rules will most likely change in the future.
Notes
- Smooth MA length N = EMA length 2*N-1
- With correct settings, you can also create an alternative to normalized MACD line in the cumulative mode.
True RSI
Absolute Strength Index
Please give a like, and share the interesting configurations you find in the comments.
Stokastik RSI (STOCH RSI)

[ProfitTrailer] Stoch RSI studyProfitTrailer Stoch RSI study with buy/sell strategies.
The script highlights the regions where trailing is most likely to succeed.

[ProfitTrailer] Stoch RSI Cross StudyProfitTrailer StochRSI Cross study that supports all PT parameters for both buy/sell strategies.
The script highlights the regions where trailing is most likely to succeed.

RSI+RSI+ is an augmented version of standard Relative Strength Index (RSI) enhanced with a EMA cloud and some momentum background highlights.
Includes 7 Color Themes (4 dark, 3 light).

Merge Of RSI & Stochastic RSI [salar88]This Indicator Include Stochastic RSI And Multiple Time Frame RSI
I Wish Its gonna useful for tradingview users

Assassin Stochastic RSIchange from standard Stochastic RSI.
Your can modify the rsi length and the stoch length from input version now.
Calculate divergence from Stochastic RSI move and price move, The divergence mark show at 70/30 line as a little black cross.
add fill color for %k and %d.


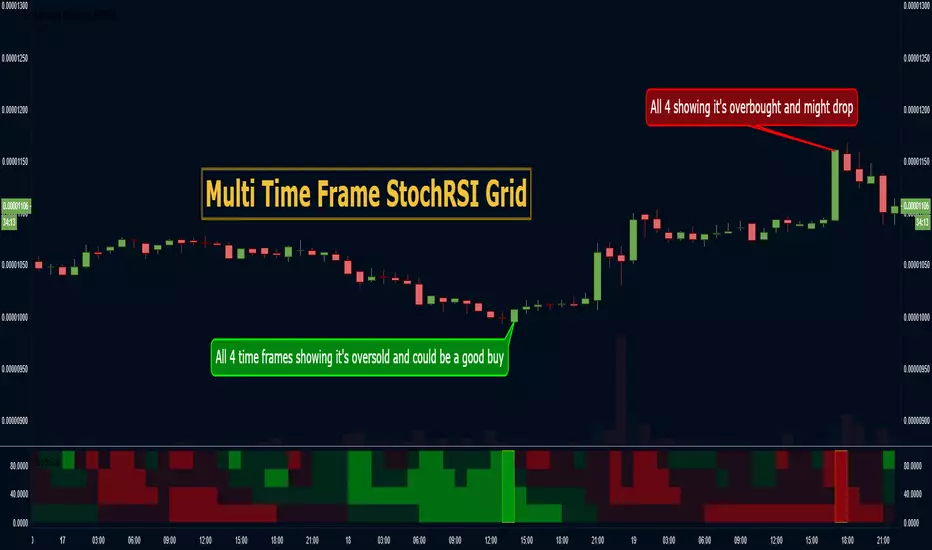
MTF StochRSI Grid v2.0 - CryptoProToolsNew version has added the following :
- Custom Time Frames (not limited to TradingViews default resolution selection)
- Optional Medium Strength Signals (Matching 3 x OB or OS instead of the full 4)
- Toggle Highlight Bar Colors ON and OFF
- Signal arrows visible above and below the grid
Original Version Can Be Found Here :
Get Access To This + All of our other current and future indicator releases with a CryptoProTools Lifetime Membership
------------------------------------------------
Other Popular CryptoProTools Releases

yutas_CCI+RCIS+StochRSIver .1.0
CCI×3
RCI×3
StochRSI cross sign × 1
It can be used as a material to judge the flow by closing CCI, RCI and StochRSI.
Three CCIs and three RCIs can be displayed.
With the time axis change function, you can check the flow on one screen.
CCIとRCIとStochRSIのクロスで流れを判断する材料に使えます。
CCIとRCIはそれぞれ3本表示可能。
時間軸変更機能により、1画面で流れを確認出来ます。

Stoch-RSI Divergence PointerThis script points regular and optionally hidden types of bullish and bearish Stoch-RSI divergences on the chart by drawing the divergence lines and optionally labels.
Hidden divergence is disabled by default, it can be enabled over settings window.
Regular divergence is enabled by default, it can be disabled over settings window.
There is an option to display the price channel additionally.

MTF StochRSI Grid - CryptoProToolsUsing this Grid you can monitor StochRSI OB and OS levels across multiple time frames with ease!
----------------------------------------------------------------------
Popular Recent Releases by CryptoProTools
----------------------------------------------------------------------
----------------------------------------------------------------------
May the profit be with you!
Stoch Money Flow (ADMF) & Absolute Strength Index (ASI) [cI8DH]This indicator can apply my previous indicator, Historical and Standard Stochastic, to Money Flow (ADMF) or Absolute Strength Index (ASI) or both at the same time. It can also display those two indicators in regular mode as well as showing visual cues when the indicators make new ATH or ATL.
ASI is basically a new name I am giving to my Gain/Loss Moving Average indicator. If you normalize ASI with the moving average of all the changes in price, it becomes identical to RSI. So ASI is basically non-normalized RSI, that is why it should be a more accurate representation of price momentum.
ADMF is an accumulation/distribution and money flow momentum indicator. Both ASI and ADMF are not range-bound so it is not easy to compare them against each other. When stochastic equation is applied to them, they both become range-bound and comparable. The gaps between the two indicator can reveal valuable information about market dynamics. The chart below shows some examples (note the settings).
For conventional usages of stochastic, please read www.tradingview.com(STOCH) and www.tradingview.com(STOCH_RSI). I recommend you to find the optimal length by playing with the stoch length in the indicator settings. If this parameter is calibrated properly, this indicator can be a powerful tool for identifying market cycle.
You can get these features ( ATH , ATL detection and historical stochastic) for any other indicator using the script below:

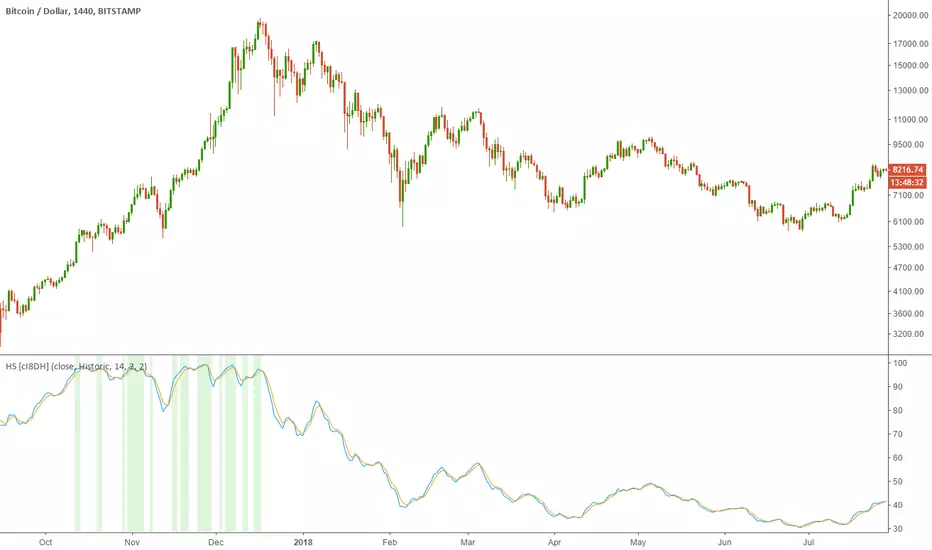
Historical Stochatic (HS) [cI8DH]This indicator calculates historical stochastic (HS). It also includes the standard stoch. HS works similar to the standard stochastic . The difference is that the standard stochastic has a set look-back period, while HS looks as far back as the first bar. This allows identifying ATHs and ATLs (background highlights green and red respectively). Basically, HS shows inverse retracement from ATL to ATH in percentage.
This indicator works best on non-range bound indicators such as MACD. As you can see in the chart below, MACD is not useful to compare against periods that price is wildly different. Applying HS on MACD fixes this issue (To achieve the same results, add MACD indicator > change the source to MACD on HS settings > since MACD is a smoothed indicator, smoothing length is set to 1. To get similar smoothing length on the signal as in standard MACD, set %D to 5 smoothed MA which is equivalent to 9 EMA smoothing on standard MACD).
Gain/Loss Moving Average (GLMA) is another indicator that can benefit well from HS. GLMA is the simplest and probably the most accurate momentum indicator. But it is not as convenient as RSI since it is not range bound. HS can make it range bound without compromising its accuracy. (To achieve the same results, add GLMA indicator > change the source to GLMA on HS settings > set %K length to 1).
Chart below shows HS applied to Accumulation/Distribution Money Flow (ADMF) and compares it against its range bound counter part, ADP.
Conclusion:
There are different ways of making an indicator normalized or range bound. Some indicators use RSI's approach (positive changes MA / all changes MA) such as MFI, CMF, ADP. This approach is great but the divergence near extremes can sometimes be misleading. HS fixes this problem as long as the indicator is not making a new ATH or ATL . When it does make new ATH or ATL , this indicator gives a warning to avoid using it for detecting divergence.
PS:
It is a bit geeky to apply HS on other indicators. I will publish some of my indicators with HS and standard stoch built-in. So stay tuned if u r interested in this indicator.
Read more here about using stochastic
www.tradingview.com(STOCH)

Stoch Momentum Index* Original code from UCSgears.
* Added circles for when Stoch MI and signal line crosses.

Stochastic RSIThis indicator is the standard Stochastic RSI as well as the normal RSI indicator displayed in the background as an area.
This allows you to see both indicatrs at the same time