Mby_test straegythis indicator based on Mby_stoch and CCI flow +etc this indicator got about 66% benefits. Pine Script® stratejisiYonggg92 tarafından6
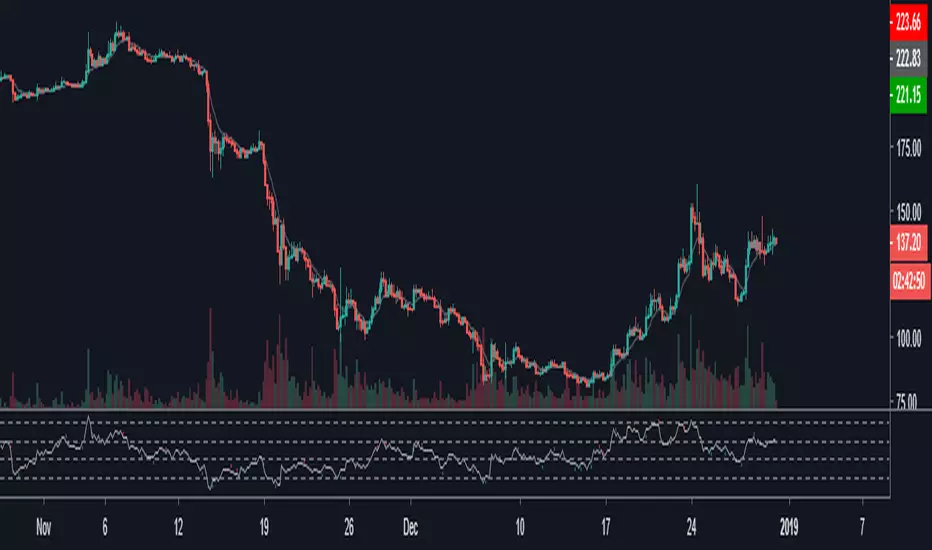
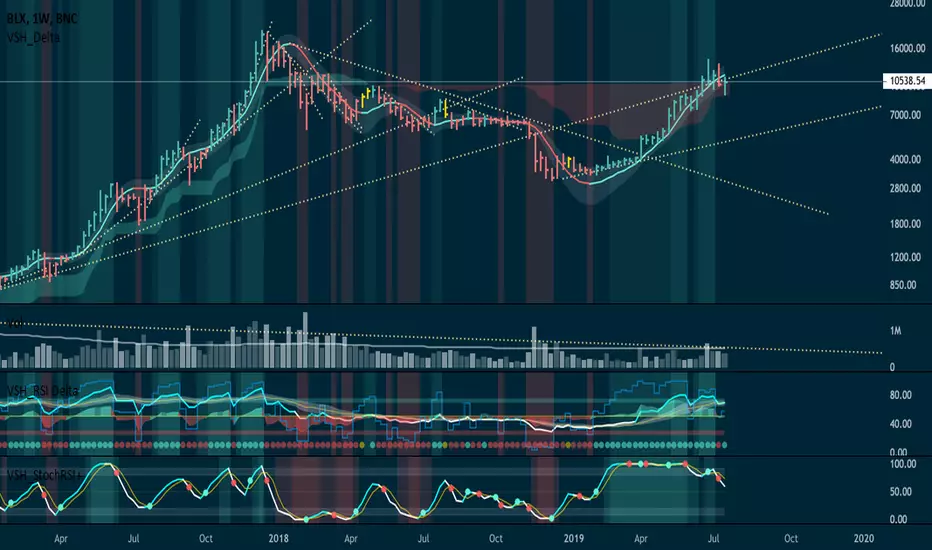
RSI + Stochastic RSI Indicator CombinedFree to use RSI and Stochastic RSI, combined within one indicator. The RSI and Stochastic RSI are two of the most commonly used and respected indicators in trading technical analysis. By placing them on top of each other you can save valuable space on your chart and stay more easily within your TradingView indicator limit. The RSI is bright blue, with the "neutral" 30-70 chart area shaded blue. The Stoch RSI is red and blue, with the "neutral" 20-80 chart area shaded purple. None of the other annotations shown above will appear, they are only to demonstrate how they can be interpreted. So what does the RSI do? Broadly speaking, the Relative Strength Index measures the strength and movements of a market. Above 70 the RSI is considered oversold = an increased likelihood of an incoming price drop. Below 30 the RSI is considered undersold = an increased likelihood of an incoming price rise. What does the Stochastic RSI do? Broadly speaking, the Stochastic RSI measures the momentum of a market. It does this by measuring the RSI relative to its own high/low over the previous period. Above 80 the Stoch RSI is considered oversold = an increased likelihood of an incoming price drop. Below 20 the Stoch RSI is considered undersold = an increased likelihood of an incoming price rise. Look for when the two Stoch RSI lines cross over - it is an important signal. When the blue line is on top we have momentum driving the price up; when the red line is on top we have momentum driving the price down. The key here is to look for periods where both the RSI and Stoch RSI are both low at the same time (especially on the daily chart) = an extremely promising entry point to catch a move up. Equally, looking for periods where both the RSI and Stoch RSI are very high is likely a good exit point (or at least a time to make absolutely certain you have a suitable stop-loss in place), because a price drop is likely not far away. Remember: the Stoch RSI does not always fluctuate cleanly between the top and bottom. At any time it can change direction to reflect market conditions, which is why a stop loss is essential at all times. Equally, just because the RSI or Stoch RSI is at 100, it is still possible for it to keep going up due to whale action or traders FOMOing in. The same applies at low levels. Both these indicators represent historical data and therefore are not strictly predictive in nature, but show trends that may be in action. Please give me a thumbs up and follow me if you found this useful. This tool is for educational purposes only and not a recommendation to buy or sell. Always do your own research before trading. Make sure to add this to your favourite scripts. Best wishes, BCryptological ps - combine this powerful indicator with knowledge of strong support and resistance points with the 50/100/200 Moving Average . This will help you identify likely entry/exit points to maximise the accuracy of your predictions.Pine Script® göstergesiBCryptological tarafından1111 1.3 K
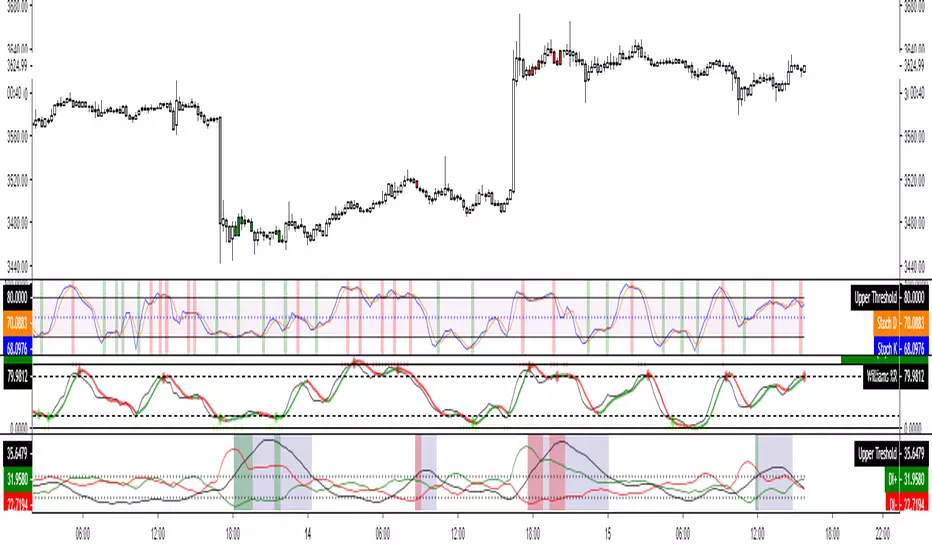
3 Oscillator (RSI + Stochastics + MFI) with over bought/soldThis is a combined oscillator indicator which includes: Relative Strength Index ( RSI ) Money Flow Index ( MFI ) Stochastic or StochasticRSI In addition there are some advanced features including: Custom time frame (Have the indicator running 5 minute candles while on a 1 hour chart) Highlight Overbought/Oversold (The intensity of highlight changes when it is 5% below the threshold to 5% above the threshold) Moving average trend for highlights (This will prevent the threshold-5 highlight from showing in a uptrend to reduce false signals) It is important to know that the highlight feature is not designed as a buy/sell signal, it is only there as and oversold/overbought indicator to suggest when a trend change may be approaching. The highlights are dependent on all three oscillators being above or below their thresholds respectively, this is to provide confluence that the market is indeed oversold and not just a single indicator.Pine Script® göstergesiGalacticGauntlet tarafındanGüncellendi 77228
(C)RSI, (Ehler's) Stoch, (Ehler's) SRSIA collection of the following indicators: *Connor's RSI *RSI *Stoch *Stoch by Ehler *Stoch RSI *Stoch RSI by Ehler The last four have long and short conditions and there are plenty of options to change the indicators to the ticker and timeframe.Pine Script® göstergesiCoinpocalypse tarafındanGüncellendi 1164
AJCrows RSI and Stochastic RSIBoth RSI and Stochastic RSI on the same indicator. Also option to use different resolution (time frame).Pine Script® göstergesiaeinola tarafındanGüncellendi 17
Multiple MACD RSI simple strategySimple strategy script I've had for a while but looks like I never published. Although it is one of my most simple it seems to have the best profitability. It is pretty rough though. the Stoch RSI has only a little weight to the trade trigger. I'll refine it more over time or you can by all means. Basically the Stoch RSI current K line has to be OVER 40 to trigger a SELL. It has no effect on buy side. The triggers are roughly as follows: Year - since so many assets have gone 2x, 3x, 10x+ since 2013 having a strategy that earns a 500% return from 2013 to now isn't that good if buy-and-holding would have got you 800%. This eliminates some of that noise and makes it a little easier to quickly gauge success. So buy/sell trigger need a value of greater or equal to 2018 (default) MACD 1 - First MACD (short) needs to indicate greater than 0 to buy or less than 0 to sell. MACD 2 - Same as MACD1 but for second MACD set (long) Uptrend - Latest close + high divided by last periods close + high needs to be grater than 1. So if latest is 34.30 close and 34.60 high and previous interval is 34.80 close and 34.82 high, that is 0.99 and will not trigger a buy trade. Downtrend - Same thing but close + low and less than 1. This script/strategy is pretty rough but if there is interest I'll polish it more since it is a pretty solid but simple strategy for most assets. Pine Script® stratejisiRyanMartin tarafından44690
CryptoPeep Trade Signals (6 In 1)I am always looking at different indicators, and wanted a quick way to check my favorite 6 indicators in one for a quick check on crypto trades. This script includes the following, in order from top to bottom. 1). RSI 2). Bollinger Bands 3). Stochastic RSI 4). Stochastic Only 5). MACD 6). Weighted Moving Avg. If the indicator show a buy/oversold that corresponding line will go green and red if overbought. if undecided with be a white circle. If there are 4 showing the same the background will change to match. Hope it helps, please tel me know your thoughts. If you would like to be kept up to date please FOLLOW us and try our indicators and strategies here: uk.tradingview.com Please click the LIKE button if you use it.Pine Script® göstergesiCryptoPeep tarafındanGüncellendi 4470
RSI with StochRSI CrossesRelative strength index plotted with arrow up/down to indicate StochRSI crossovers.Pine Script® göstergesistuehmer tarafından87
Stochastic RSIThis is a standard stochastic rsi, but the rsi passed through a momentum formula before given to stochastic, also, unlike standard stochastic rsi, it has different lookup length for low and high of rsi. The result is almost identical to stochastic but when stochastic hits top and bottom levels and gets locked because of clamping, this version will behave properly. The source is hidden but this script has global access. Take note that this is not a script that I would use in my own system but some of my friends were looking for such script. Also, it's worth mentioning that the range of this script was changed from standard 0 to 100, and it's -100 to 100. There's still a chance for getting locked on top and bottom specially in parabolic moves but that is the nature of RSI and also stochastic and without tweaking the standard formula drastically, it won't go away and this is exactly why i wouldn't put this in my own methodology.Pine Script® göstergesiCAB_Member tarafındanGüncellendi 22171
Stochastic RSI Momentum TranformThis is my version of Stochastic RSI, but not the stochastic RSI alone, hell no, it's a lagging indicator, I don't like lagging indicators. This is a leading indicator that has momentum calculations in it and not only that, it has a momentum shifting calculation based on modified ehler's transformation ! Simple for user, a hell to program ! Price and how to get access to ? contact me in PM !Pine Script® göstergesiCAB_Member tarafındanGüncellendi 1122
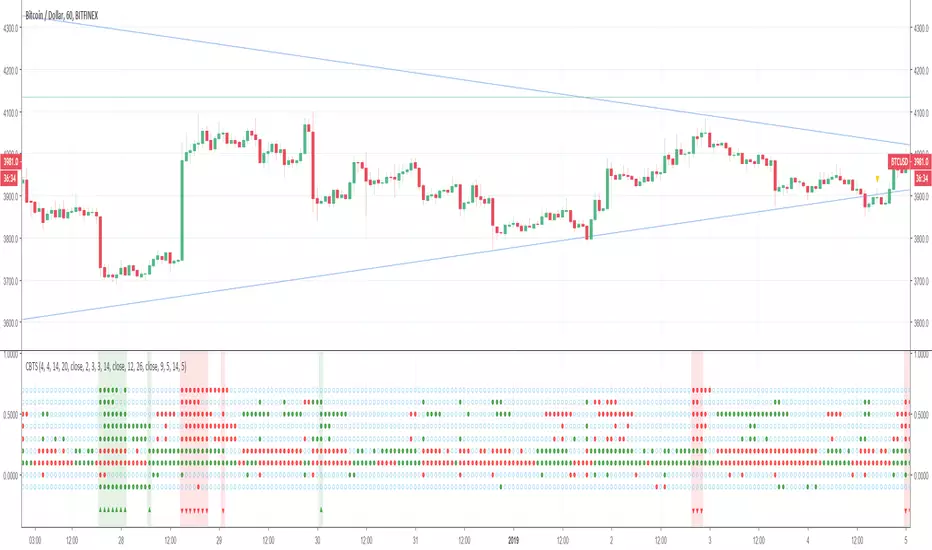
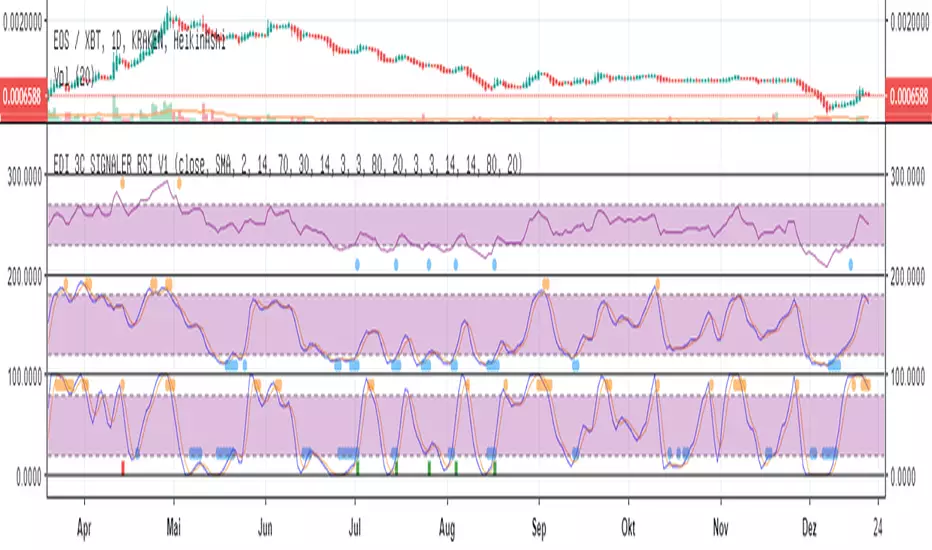
Eds Bot Signaler on Basis of RSI Stoch StochRSIEDS AWESOME BOT SIGNALER Specially for use with e.g. 3commas or autoview But can also be used just in normal manual (visual) mode This Script is very early Beta. Works for visual manual use.... and also for 3Commas Bot as "Signaler" (how to connect with Bot, see the docu on 3commas). ... but can use as Signaler for any Bot who is able to get Tradingview sms-mails. (e.g. autoview) It combines RSI, Stoch and Stoch-RSI. You can choose normal RSI, or " returning RSI " (signals when leaving the sell/buy-zone. much higher profits with this) You can choose how many of the indicators are needed to "fire". You can choose if one of the indicators is a "must" For Stoch & Stoch-RSI you can Choose sma or ema calculations of the moving average. All the Values speak for themselves, if you are used to technical analyses (stay away in the moment, if you dont know, what rsi, stoch etc is used. The Signals are also shown in the chart, the single ones, but also the combined which fires the Bot-Signal (shown as green and red column-candle at bottom) Enjoy !! Free use in the moment. More detailled Explanation in the future. Just play around! If you wanna give something back: BTC: 15buigKjh4JYnuVwcEWiYMpYvP3Lbp4ypLPine Script® göstergesiedilit49 tarafındanGüncellendi 77428
CS Basic Scripts - Stochastic Special (Strategy)This Stochastic Special Strategy features inputs for: - Custom Backtesting Date Range - Long and Short Strategy Discinctions - Utilize SMI, RSI, Martingale, and Body-Filter Strategy - Adjust the SMI Percent Lengths and Limit - Automate with the Autoview Trading Bot Strategy script may be tested by favoriting and adding to any chart. Study script is available for automated trading at www.cryptoscores.orgPine Script® stratejisicryptoscores tarafından145
RSI + STOCHRSI - combinedRSI + Stoch RSI combined script Very usable for free accounts with indicator limits. Use 2 indicators as 1Pine Script® göstergesiUnknownUnicorn1060835 tarafındanGüncellendi 85
MBY_BTC_Long&ShortThis indicator based on 15Min Bitfinex BTC chart. Can help you watching short/long position on your sheet. 이 인디케이터는 비트파이넥스 15분 봉 비트코인 차트가 기본이 됩니다. 수정하실 수 없습니다. 이 지표는 비트코인 롱/숏 포지션을 사용자의 차트에 표시해줍니다. 감사합니다. 사용을 희망하는 분은 관심과 좋아요 부탁드리겠습니다.Pine Script® göstergesiYonggg92 tarafındanGüncellendi 7719
Khaled Cross Attachementthis is supporting for another indicator Pine Script® göstergesibassol85 tarafından2211
TTM Tsunami Multi Time Frame Stochastic RSITo The Moon's Apollo 11 program Stochastic RSI for leverage trading, scalping, or even trend trading with proper knowledge and settings. Basic idea: The indicator's histogram is the "K" Stochastic RSI signal from a higher time frame you define (1hr default) for overall trend indication. The Current time frame's K & D signals are shown as the solid lines. When the current time frame's K & D cross or lift off from the highest or lowest threshold, enter or exit a position; if leverage trading you can pyramid, or reverse your position. It may take a bit of time to get a feel for the proper entry & exit signals and is not a crystal ball, but this can help keep your trades in a trend longer for greater profits.Pine Script® göstergesifauxlife tarafındanGüncellendi 11198
Stochastic Momentum Indexon indicators you can buy oversold when marked with a green cross. and selling overbought is marked with a red cross.Pine Script® göstergesiSITEKONG tarafındanGüncellendi 11111
SITEKONG RSI + Stoch RSIon this indicator I combine 2 indicators, namely RSI and Stochastic. here I give yellow to RSI and Green and red to Stochastic. You can buy during oversold and sell during overbough.Pine Script® göstergesiSITEKONG tarafındanGüncellendi 62
Stochastic RSI Divergences for short term trades @D4NN1_0C34N Altcoin / Bitcoin -0.38% Stoch RSI Overlay signals: Bull divergence Bear divergence Hidden bull divergence Hidden bear divergence All divergence signals are under special circumstances. Later versions might include additional parameters. Find me on Twitter: @D4NN1_0C34N our german website: cointrend.de or youtube: www.youtube.de Pine Script® göstergesiCointrendDE tarafından49
StochRSI+StochRSI+ is a Stoch RSI study enhanced with some background highlights and flags to enhance the visual reading of standard oscillator. Default Settings: RSI: 13 Stoch RSI: 13 %K: 3 %D: 3 Oversold: 20 Extended Oversold: 7 Overbought: 80 Extended Overbought: 93 Activate Highlights and/or Flags for: - Stoch RSI Oversold/Overbought. (Default: Active) - Stoch RSI Extended Oversold/Overbought. (Default: Active) - %K crosses %D. (Default: Inactive) Pine Script® göstergesiD7R tarafındanGüncellendi 1212 2 K
StochRSI + RSI + MACDStochasticRSI, RSI, and a MACD all in one. StochRSI with an RSI overlay. Relatively, the Overbought and Oversold lines are set at 30.9 and 69.1, respectively Down below, a Normalized MACD. The MACD, in the settings, can be adjusted between Exponential(closest to normal MACD) or Smoothed (Less Noise). Normalization can be adjusted as well. Optionally, you can change the background color of the MACD area based on the direction the MACD line is heading.Pine Script® göstergesimattzab tarafından318
Bitfinex Longs vs. Shorts RSILongs VS shorts RSI indicator. You can chose length and source. Uses BitFinex exchange to get long and short data.Pine Script® göstergesiWealthMurphy tarafından106
Multi pretty stochastics by Theo Park4 pretty stochastics Light and Dark Theme adaptedPine Script® göstergesiJiyoungPark tarafındanGüncellendi 22218