Donochian zonesThis indicator give the ratio between the high and low of donochian channel and if we take ratio and add it to each other then we can calculate if it + meaning bullish trend or negative meaning bearish trend
using non repainting MTF we can see the zone of the channel at different time set
we can use this indicator to filter bad signal or make it stand alone
here example of amazon stock with 360 min mtf over one hour graph
here facebook 240min over 15 min graph
"zone" için komut dosyalarını ara

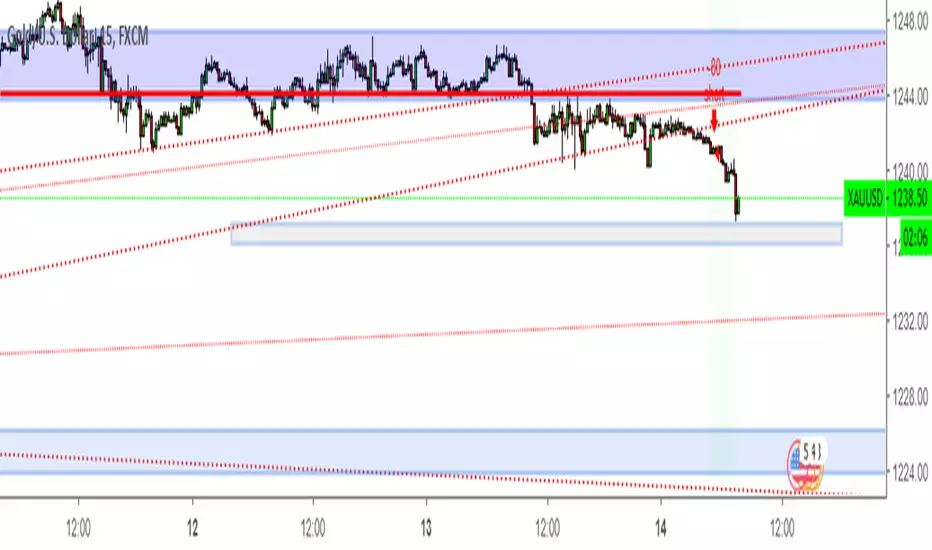
BuySell Gold Test Script by Breakout and SR zone I test this for test overall report and set fix price after 14 dec 2018 that i set from manual trade in zone.
will improve to better automate again after this.
Disaresta Buyer/Seller ZoneThis indicator was built to show buyer and seller's zone. Use this indicator to compliment your already existing trading system by confirming whether its buyer or seller that have dominance in current price movements.

RSI Bands Multi Time Frame [Jigga + LazyBear]This is a modified version of LazyBear's RSI Bands script. I added the possibility to display multiple RSI bands, so you can see the zones, where it is viable to enter a long or a short. You can also use different time frames, so you can visually see where any specific value of RSI is for your given time frame. This gives you a lot of possibilities. Default settings use 1h time frame and the most common reversal areas for RSI. Feel free to change the settings as you see fit. If the script makes your candles too small, you can go to style and turn off individual RSI bands. After that you will still be able to see the zones, but the scale of your chart won't be affected.
It also displays the middle line, which shows you the current trend and can prevent you from entering a long, when RSI is oversold during a strong downtrend or a short, when RSI is overbought during a strong uptrend.
Do not forget to use a proper stop loss and risk management.
Here you can see it in action in different markets:
BTC - BitMex
NASDAQ Composite - Stocks
EUR / USD - Forex


Better CME Margin Zones 25-200%Better indicator for CME Margin Zones
25%,50%,100%,200% zones included)

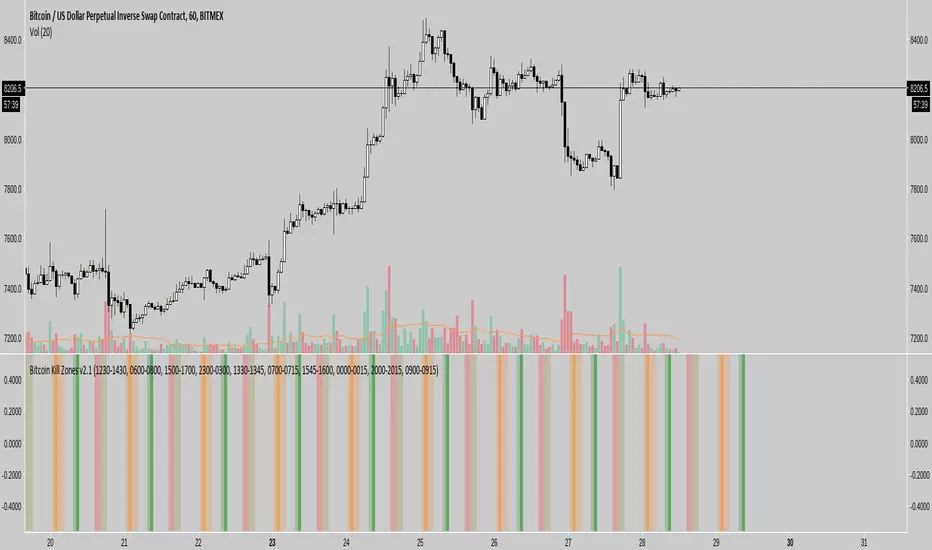
Bitcoin Kill Zones v2 [oscarvs] (UTC + 8)The Kill Zone script was modified to UTC + 8, Singapore to Beijing time.

Dynamic ZonesA port of the MT4 indicator of Mladen Rakic found at www.mql5.com
which is based on Dynamic Zones that was originally published in Stocks & Commodities 1996 issue.
Dynamic Zones is meant to be applied to oscillators to get dynamic overbought and oversold levels
quantified using statistical methods.

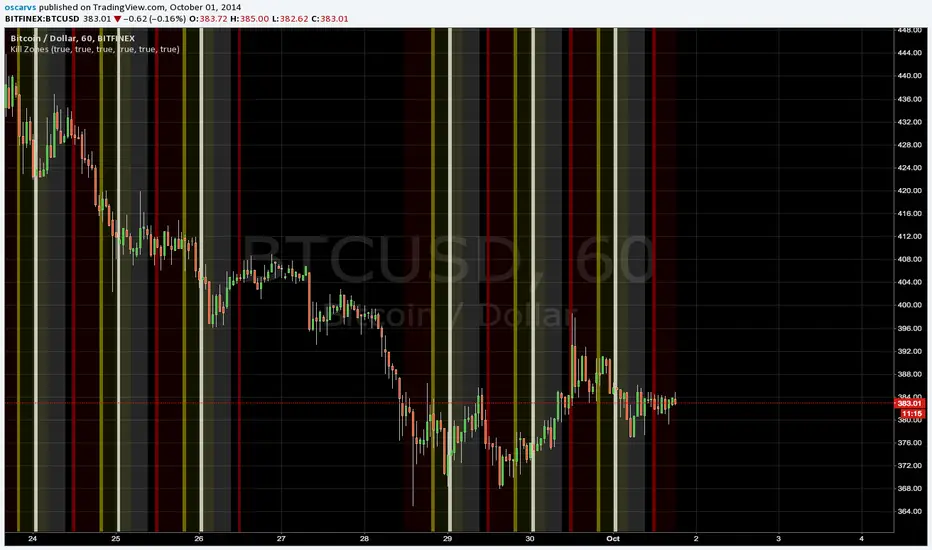
Kill Zones******* UPDATED VERSION *******
Use this one:
****************************************
>> OLD STUFF, please use the UPDATED version!!! <<
COPY & PASTE the code and change manually hours to reflect reality regardless selected TimeZone:
doNYOpen "1300-1310"
doNYSession "1300-0000"
doTokyoOpen "0030-0040"
doTokyoSession "0030-0930"
doLondonOpen "0800-0810"
doLondonSession "0800-1700"
MAJOR PA Zones + Structure + Targets (Gray/Purple)This script highlights major price-action structure (HH/HL/LH/LL), marks BOS/CHOCH events, and draws key supply/demand zones to help visualize trend shifts and potential targets.

Manual Zones SafeUse cases:
Support and resistance levels
Supply and demand zones
Price action areas for manual trading strategies

RBR/DBD Zones JaRBR and DBD zones with multiple timeframe. designed to identify support and resistance area on the chart

RSI + EMA Dynamic Zones + Volume + Divergence (with RSI 50 line)RSI + EMA Dynamic Zones + Volume + Divergence (with RSI 50 line)

V3 9-20 Smart EMA Cross + RSI + FVG Zones (Instant Signal)V3 9-20 Smart EMA Cross + RSI + FVG Zones (Instant Signal)

Weekly Zones +RSI ColorWeekly analysis of stocks, cryptos etc.
chart, you will see:
The Weekly levels (PWH, PWL, 4 quadrants).
The Weekly control zones (the red, green, or grey boxes).
The Weekly analysis in the table.
Your 1-Hour candles will be colored green (strong), red (weak), or grey (neutral) based on the 1-hour RSI.
This should give you a very effective trading system.
