Dual Fibonacci Zone & Ranged Vol DCA Strategy - R3c0nTraderWhat does this do?
This is for educational purposes and allows one to backtest two Fibonacci Zones simultaneously. This also includes an option for Ranged Volume as a parameter.
Pre-requisites:
First off, this is a Long only strategy as I wrote it with DCA in mind. It cannot be used for shorting. Shorting defeats the purpose of a DCA bot which has a goal that is Long a position not Short a position. If you want to short, there are plenty of free scripts out there that do this.
You must have some base knowledge or experience with Fibonacci trading, understanding what is ADX, +DI (and -DI), etc.
You can use this script without a 3Commas account and see how 3Commas DCA Bot would perform. However, I highly recommend inexperienced uses get a free account and going through the tutorials, FAQ's and knowledgebase. This would give you a base understanding of the settings you will see in this strategy and why you will need to know them. Only then should you try testing this strategy with a paper bot.
Background
After I had created and released "Fibonacci Zone DCA Strategy", I began expanding and testing other ideas.
The first idea was to add Ranged Volume to the Fibonacci Zone DCA strategy which I wanted for providing further confirmation before entering a trade. The second idea was to add a second Fibonacci Zone that was just as configurable as the first Fibonacci Zone. I managed to add both and they can be easily enabled or disabled via the strategy settings menu.
Things Got Real Interesting
Things got real interesting when I started testing strategies with two Fibonacci zones. Here's a quick list of what I found I was able to do:
Mix and match exit strategies. I could set the Fib-1 zone strategy to exit with a take profit % and separately set the Fib-2 zone strategy to exit when the price crosses the top-high fib border
Trade the trend. A common phrase amongst traders is "the Trend is your friend" and with the help of an additional Fib Zone, I was able to trade the trend more often by using two different Fib Zone strategies which if configured properly can shorten time to re-deploy capital, increase number of closed trades, and in some cases increase net profit.
Trade both bull market uptrends and bear market downtrends in the same strategy. I found I could configure one Fib Zone strategy to be really good in uptrends and another Fib Zone strategy to be really good in downtrends. In some cases, with both Fib Zone strategies enabled together in a single strategy I got better results than if the strategies were backtested separately.
There are many other trade strategies I am finding with this. One could be to trade a convergence or divergence of the two different Fib Zones. This could possibly be achieved by setting one strategy to have different Fibonacci length.
Credits:
Thank you "EvoCrypto" for granting me permission to use "Ranged Volume" to create this strategy
Thank you "eykpunter" for granting me permission to use "Fibonacci Zones" to create this strategy
Thank you "junyou0424" for granting me permission to use "DCA Bot with SuperTrend Emulator" which I used for adding bot inputs, calculations, and strategy
"zone" için komut dosyalarını ara

Deluxo Dow Kill ZonesCAPITALCOM:US30
Edit* under settings remove the plot line its not needed.
Deluxo Capital
Dow Kill Zone Indicator
PLEASE READ ALL
About: This will help you find large moves that happen often on US30. This will work for gj and probably other indices but I've designed this to work for US30 day trades.
If I see a trade I will scalp within the blue zone, besides that the best trades are anywhere outside the colored zones and you will generally find good entry's/exits just as those zones end.
So you're just scalping between these zones. Stay with me tho.
How to use: You can trade the blue session or wait it out because that's a high risk area but with time you will enjoy trading it as you get to know how price reacts or how the order blocks/order flow looks.
This works for: Day trades mainly but can be for swing trades.
Time fame USE: 1-15min I like 5-15m
Red Zone = This zone I like to enter shorts or longs all the way to the blue zone depending how price action reacted to the Asian high or low. Was the Asian high taken out?/was the Asian low taken out? Trades are taken around when this zone ends down to the blue zone.
Blue Zone = Modified New York Session hours High vol window good scalps or enter trades after the blue zone to the next zone the
Gray zone = 30 min Pre-Spread Warning. This zone is always the best time to exit your trades its just grays out 30 min before spreads open up. Some of the best trades are after the blue zone to this gray zone.
EXTRA* I also use this indicator and I recommend you to use this aswell these two together work great I use them daily.
AsiaSessionHighLowMidLines by marekmajer
This is my personal system for scalping dow. I hope this helps you as much as it helps me and I'm sure as you see how price reacts you too can see the value in this. Please enjoy!
You can adjust the colors and remove the plot line over the candles I don't code well this is my first time I just tossed this together and I can't remove the plot line so just uncheck it.
Thank you
Deluxo Capital

Volume-based Support & Resistance ZonesThe new and improved Support & Resistance Zones indicator is here. This indicator is based on high volume at fractal lows or fractal highs with the zones based on the size of the wick for that timeframe’s candle.
This helps traders visualize which price levels are of the most significance for either reversals or continuation of the trend when zones are broken and then re-tested.
Original script is thanks to synapticex and additional modifications is thanks to Lij_MC. Credit to both of them for most of the logic behind this script.
Since then I have made many changes to this script as noted below:
Changed default S/R lines from plots to lines, and gave option to user to change between solid line, dashed line, or dotted line for both S/R lines.
Added additional time frame and gave more TF options for TF1 other than current TF. Now you will have 4 time frames to plot S/R zones from.
Gave user option to easily change line thickness for all S/R lines.
Made it easier to change colors of S/R lines and zones by consolidating the options under settings (rather than under style).
Added extensions to active SR Zones to extend all the way right.
Added option to extend or not extend the previous S/R zones up to next S/R zone.
Added optional time frame labels to active S/R zones, with left and right options as well as option to adjust how far to the right label is set.
Fixed issue where the higher time frame S/R zone was not properly starting from the high/low of fractal. Now any higher time frame S/R will begin exactly at the High/Low points. Note that this may not work perfectly on stocks and if a fractal high/low is too many bars in the past, it will revert to a default max bars back to avoid script errors.
Added to script a function that will prevent S/R zones from lower time frames displaying while on a higher time frame. This helps clean up the chart quite a bit.
Created arrays for each time frame's boxes and lines so that the number of S/R zones can be controlled for each time frame and limit memory consumption.
New alert options added and customized alert messages.
- The way this indicator works is it looks for fractal highs or fractal lows with volume that pierces above the volume's Moving Average. This moving average value can be modified in the settings for each time frame.
- The fractal highs will be confirmed with 3 successive higher highs followed by 2 successive lower highs and vice versa for the fractal lows.
- The zone is created from the fractal high/low and the close of the candle for whatever time frame you selected. The bigger the zone, the more significant that zone is.
- You can disable any zone, change the zones to show lines only, and modify all the colors, transparencies, and thickness of lines for all the zones.
- To create alerts, you first want to enable the types of alerts you want for each time frame in the indicator's settings. Then after you apply changes, right click on one of the zones on the chart, and click "Add Alert on Vol S/R Zones". You do not need to add a title as the correct alert messages are already built-in.
- More changes will be coming in the future!
I hope you find this indicator useful, if so please give it a thumbs up!
If you have any suggestions or features you would like to see, just let me know in the comment section. Thanks and enjoy!

Auto Reaction Zones (XAUUSD)
✅ Auto Reaction Zones (XAUUSD) OANDA:XAUUSD
Auto Reaction Zones (XAUUSD) is an advanced supply & demand mapping tool designed to detect high-probability reaction zones using price impulses, volatility filters, market structure, and adaptive confirmation logic.
This indicator automatically identifies strong bullish and bearish reaction bases formed before impulsive movements, then plots dynamic demand and supply zones that help traders anticipate future reactions, reversals, or continuation points.
🔍 Core Features
▪ Automatic Supply & Demand Zone Detection
Identifies zones based on structural breakout impulses using ATR-based thresholds, volume confirmation, and validated base levels.
▪ Adaptive Confirmation Distance (ADR-Based)
The zone becomes active/confirmed only after price moves a configurable number of points.
A unique 3-case ADR logic adjusts the required confirmation distance based on current market volatility:
Case 1: Low ADR → smaller confirmation required
Case 2: Moderate ADR → medium confirmation
Case 3: High ADR → higher confirmation (more filtering)
This ensures stronger zones in high-volatility conditions (e.g., XAUUSD).
▪ Smart Zone Management
Automatic extension until tested or consumed
Optional lifetime limits (bars or days)
Auto-delete unconfirmed zones if price violates them too early
Hide tested or consumed zones for a cleaner chart
▪ Adjustable Zone Size Filtering
Option to enforce a minimum or maximum zone size, useful for cleaning noise and ultra-small reaction levels.
▪ ADR-Based Zone Spacing Filter
Prevents the creation of zones that are too close to each other.
Different spacing rules for same-direction and opposite-direction zones.
▪ Multi-Timeframe Mode
Overlay zones detected from higher timeframes directly onto your current chart.
▪ Directional Bias (EMA Filter)
Optionally restrict long/short zones based on EMA trend alignment.
▪ Real-Time Alerts
Receive alerts when price touches any active zone or only fresh zones.
🎯 Why This Indicator Is Different
Unlike typical supply/demand indicators that print every swing,
Auto Reaction Zones focuses on:
Only strong reaction bases
Only valid impulse-generated levels
Only zones confirmed by price movement
Only zones that respect volatility and minimum spacing rules
This results in cleaner charting, fewer false zones, and far more reliable reaction levels, especially on volatile instruments like XAUUSD.
⚠️ Disclaimer
This tool is not financial advice. Always combine zone analysis with broader market context and risk management.

Block-Based Trend Breakout (UTB/DTB) & S/R ZonesThis indicator is designed to detect potential trend reversals or volatility bursts by analyzing price action structured into "blocks." Its primary goal is to capture the earliest signals that a defined trend structure is weakening or breaking.
Signal Generation:
🟢 DTB (Downtrend Breakout): When a confirmed downtrend is identified (e.g., price has been falling for 2 blocks), the indicator waits for the price to break above the highest high of the last completed block in that trend. When this break occurs, it signals a potential bullish reversal with a green DTB triangle below the bar.
🔴 UTB (Uptrend Breakdown): When a confirmed uptrend is identified (e.g., price has been rising for 2 blocks), the indicator waits for the price to break below the lowest low of the last completed block. When this break occurs, it signals a potential bearish reversal with a red UTB triangle above the bar.
🛠️ Key Settings
Block Size (bars): The number of bars in each block used to analyze the trend structure. Lower values track short-term trends; higher values track long-term trends.
Trend Confirmation (steps): The minimum number of consecutive blocks required to "confirm" a trend.
Tolerance: Allowed Off-Trend Steps: The number of "noise" blocks allowed while confirming a trend.
Show Support/Resistance Zones: Toggles the histogram-based S/R zones on or off.
S/R Lookback (blocks): Determines how many blocks to look back for calculating S/R zones.
S/R Zone Width (in ATR): Sets the thickness of the S/R zones, denominated in ATRs.
If you find this useful please reach out and let me know how you use it as it's fairly unique... and thus different than anything I've ever seen or used.

EWC Precision Blocks📌 EWC Precision Blocks
🔎 Overview
EWC Precision Blocks is a professional market analysis tool designed to highlight high-probability trading zones on the chart. Instead of relying on lagging signals, this indicator maps out Alpha Zones (bullish) and Beta Zones (bearish), allowing traders to identify potential market reaction areas with clarity.
The algorithm is built to adapt across Scalp, Swing, and Position trading modes, making it flexible for short-term intraday traders as well as long-term investors.
⚡ Key Features
Multi-Mode Detection – Switch between Scalp, Swing, or Position modes depending on your trading style.
EWC Alpha Zone (Bullish Detection) – Highlights areas where the market may find strong upward momentum.
EWC Beta Zone (Bearish Detection) – Highlights areas where the market may face downward pressure.
Zone Break Tracking – Visualizes when a zone has been invalidated or broken.
Body-Based Detection – Option to base calculations on candle bodies instead of wicks for precision.
Zone Flips – Displays polarity shifts when zones transition from supportive to resistive behavior (and vice versa).
Custom Styling – Full control of zone and break colors for clear chart visualization.
🎯 How to Use
Select Your Mode
Scalp → Designed for fast intraday moves.
Swing → Medium-term setups, ideal for session trading.
Position → Long-term outlook, suitable for investors.
Watch the Alpha Zones
Highlighted bullish areas can serve as potential support or accumulation zones.
Watch the Beta Zones
Highlighted bearish areas may act as resistance or distribution zones.
Monitor Breaks & Flips
Alpha Breaks → Bullish zones failing.
Beta Breaks → Bearish zones failing.
Zone Flips → Polarity changes, often powerful signals.
🛠 Inputs & Customization
EWC Mode → Choose Scalp, Swing, or Position.
Show Last Alpha Zone → Set how many bullish zones to display.
Show Last Beta Zone → Set how many bearish zones to display.
Body-Based Detection → Toggle candle body vs. wick calculation.
EWC Alpha Zone / Beta Zone Styling → Customize zone colors.
Alpha Break / Beta Break Colors → Adjust break visuals.
Show Zone Flips → Enable/disable historical polarity labels.
Status Bar → Display inputs directly in the chart status line.
📈 Best Practices
Works across all timeframes and markets (forex, crypto, indices, stocks).
Combine with your existing strategy for confirmation.
Use in alignment with higher timeframe structure for maximum accuracy.
⚠ Disclaimer
EWC Precision Blocks is a market visualization tool provided for educational purposes only. It does not provide financial advice, signals, or guaranteed results. Always do your own research and manage risk responsibly.
🔹 About EWC
EWC (EastWave Capital) is dedicated to developing professional-grade trading tools and strategies for traders across forex, crypto, commodities, and indices. With over a decade of combined market experience, our mission is to empower traders with precision, clarity, and confidence in their decision-making.
EWC Precision Blocks is one of our flagship tools, reflecting our commitment to innovation, transparency, and trader-focused solutions.
📌 Published by Usama Manzoor — Founder of EastWave Capital (EWC)
Beta Zones [MMT]Beta Zones
Overview
The Beta Zones indicator is a multi-timeframe analysis tool designed to identify and visualize price ranges (zones) across different timeframes on a TradingView chart. It draws boxes to represent high and low price levels for each enabled timeframe, helping traders spot key support and resistance zones, track price movements, and assess market signals relative to these zones. The indicator is highly customizable, allowing users to toggle timeframes, adjust colors, and control historical visibility.
Features
Multi-Timeframe Support : Tracks up to five user-defined timeframes (default: 15m, 1H, 4H, 1D, 1W) to display price zones.
Dynamic Price Boxes : Draws boxes on the chart to represent the high and low prices for each timeframe, updating dynamically as new bars form.
Signal Indicators : Provides directional signals (▲, ▼, →) based on the previous close relative to the current box's top and bottom.
Customizable Display : Includes options to show or hide historical boxes, adjust box colors, and configure a summary table.
Summary Table : Displays a table with timeframe status, price range, and signal information for quick reference.
Settings
Timeframes
Enable/Disable : Toggle each timeframe (e.g., 15m, 1H, 4H, 1D, 1W) to display or hide its respective zones.
Timeframe Selection : Choose custom timeframes for each of the five slots.
Color Customization : Set unique fill and border colors for each timeframe's boxes (default colors: green, blue, orange, purple, red).
Display
Max Historical Boxes : Limit the number of historical boxes per timeframe (default: 1, max: 50).
Show History : Toggle visibility of historical boxes (default: false, showing only the latest box).
Min Box Height : Ensures boxes have a minimum height in ticks (default: 1.0, currently hardcoded).
Table
Show Table : Enable or disable the summary table (default: true).
Background Color : Customize the table's background color.
Header Color : Set the color for the table's header row.
Text Color : Adjust the text color for table content.
Table Columns
Timeframe : Displays the selected timeframe (e.g., 15m, 1H).
Color : Shows the color associated with the timeframe's boxes.
Status : Indicates if the timeframe is "Active" (valid and lower than the chart's timeframe), "Invalid" (enabled but not lower), or "Disabled".
Range : Shows the price range (high - low) of the current box.
Signal : Displays ▲ (price above box), ▼ (price below box), or → (price within box) based on the previous close.
How to Use
Add to Chart : Apply the indicator to your TradingView chart.
Configure Timeframes : Enable desired timeframes and adjust their settings (e.g., 15m, 1H) to match your trading strategy.
Analyze Zones : Use the boxes to identify key price levels for support, resistance, or breakout opportunities.
Monitor Signals : Check the table's "Signal" column to gauge price direction relative to each timeframe's zone.
Customize Appearance : Adjust colors and historical box visibility to suit your preferences.
Ideal For
Swing Traders : Identify key price zones across multiple timeframes for entry/exit points.
Day Traders : Monitor short-term price movements relative to higher timeframe zones.
Technical Analysts : Combine with other indicators to confirm support/resistance levels.

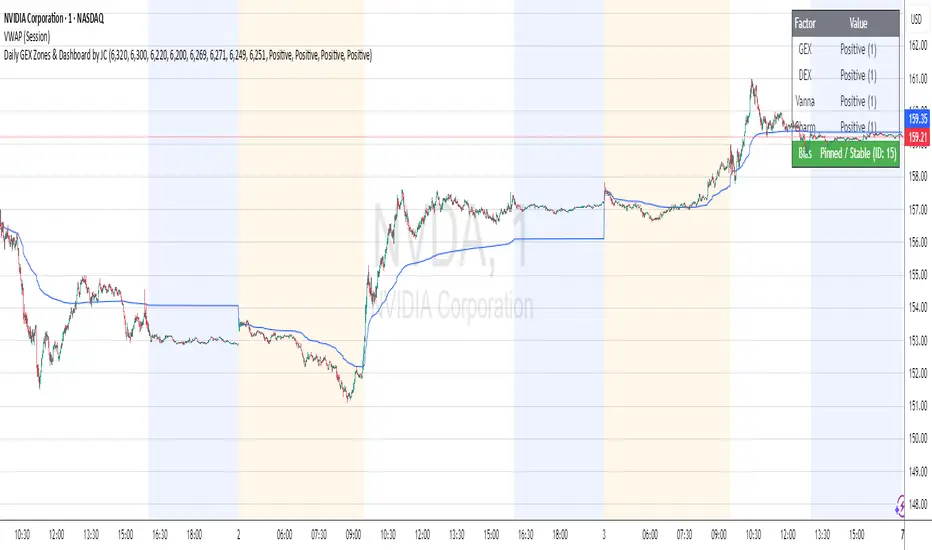
Daily GEX Zones & Dashboard by JCThis script plots daily options-driven gamma zones alongside a live sentiment dashboard to help traders visualize dealer positioning, support/resistance clusters, and expected price behavior.
Features:
📅 Date-based GEX Zones: Automatically draws GEX Resistance, GEX Support, Max Pain Zone, and Zero Gamma Line for a specific trading day.
📊 Gamma Flow Dashboard: Displays real-time GEX, DEX, Vanna, and Charm flows using intuitive dropdowns (Negative, Neutral, Positive) — no manual number typing.
🔢 Combo ID Calculation: Combines your gamma flow selections into a single Combo ID, quantifying net positioning pressure.
🎯 Automatic Bias Classification: Instantly highlights whether the day’s gamma structure is likely Pinned/Stable, Unpinned/Wild, Choppy, or Trap/Expansion — color-coded for quick reading.
📈 Zero Gamma Lines: Plots two critical levels where gamma flips from long to short, providing valuable confluence for intraday support/resistance.
How to Use:
1️⃣ Pick your target date (e.g., current day) to activate the GEX boxes.
2️⃣ Enter the day’s Resistance Wall, Support Wall, Max Pain, and Zero Gamma levels from your option chain analysis.
3️⃣ Use the radio-style dropdowns to select sentiment for GEX, DEX, Vanna, and Charm based on your interpretation of open interest, hedging, dealer flow, and market structure.
4️⃣ The dashboard will auto-calculate your Combo ID and bias class.
Designed for:
SPX, SPY, QQQ, NVDA, or any high-liquidity underlying with active options flow.
Active day traders, gamma scalpers, and market makers tracking dealer positioning.
Tip:
Combine with price action levels, VWAP, and intraday structure for high probability trade zones.
ICT IRL & ERL ZonesICT IRL & ERL Zones
This indicator visualizes Internal Range Liquidity (IRL) and External Range Liquidity (ERL) levels, based on ICT (Inner Circle Trader) concepts. It's designed to help traders identify key liquidity zones that often act as magnet levels or reversal points in price action.
🔍 How It Works
Lookback Range: The script analyzes the highest high and lowest low over a user-defined number of candles (default: 50).
IRL (Internal Range Liquidity):
Plots the highest high and lowest low within the lookback period.
Represented as orange lines and a shaded zone.
ERL (External Range Liquidity):
Extends the IRL boundaries by a small buffer (50 ticks above/below).
Visualizes zones where price may reach for liquidity beyond the current range.
Plotted as a green (high) and red (low) line.
⚙️ Inputs
Lookback Range: Number of candles to calculate the range (min 5).
Show IRL: Toggle visibility for Internal Range Liquidity zone.
Show ERL: Toggle visibility for External Range Liquidity buffer zone.
📊 Visual Elements
IRL High/Low: Orange lines with fill to mark the main liquidity range.
ERL High/Low: Green and red lines indicating potential liquidity sweep zones.
Zone Fill: Light orange shading to visually emphasize the IRL area.
📈 Use Case
Use this tool to:
Identify areas where price might consolidate or reverse.
Highlight likely zones of liquidity grabs before trend continuations or shifts.
Enhance entry/exit decisions based on smart money concepts.

Time Specific Standard Deviation Zones(10 am - 4hr candle)This indicator is designed for intraday traders who want to visualize volatility-based zones around the 10:00 AM New York session open, plotted precisely from 10:00 AM to 2:00 PM EST.
✅ Key Features:
📦 Automatically draws mirrored Standard Deviation (SD) zones:
0.5 SD, 1 SD, 1.5 SD above and below the 10AM open
Open Line reference for mean reversion tracking
📐 Internal Fibonacci Levels within each zone:
0.236, 0.382, 0.5, 0.618, 0.786
⏱️ Works across any timeframe
📊 Ideal for:
Breakout traders
Volatility compression strategies
Statistical mean reversion models
🔧 Built using precise New York session timestamps, ensuring accuracy across time zones and resolutions.

Rocky's Dynamic DikFat Supply & Demand ZonesDynamic Supply & Demand Zones
Overview
The Dynamic Supply & Demand Zones indicator identifies key supply and demand levels on your chart by detecting pivot highs and lows. It draws customizable boxes around these zones, helping traders visualize areas where price may react. With flexible display options and dynamic box behavior, this tool is designed to assist in identifying potential support and resistance levels for various trading strategies.
Key Features
Pivot-Based Zones: Automatically detects supply (resistance) and demand (support) zones using pivot highs and lows on the chart’s timeframe.
Dynamic Box Sizing: Boxes shrink when price enters them, reflecting reduced zone strength, and stop adjusting once price fully crosses through.
Customizable Display: Choose to show current-day boxes, historical boxes, or all boxes, with an option to update past box colors dynamically.
Session-Based Extension: Boxes can extend to the current bar or stop at 4:00 PM of the creation day’s 9:30 AM–4:00 PM trading session (ideal for stock markets).
Color Coding: Borders change color based on price position:
Green for demand zones (price above the box).
Red for supply zones (price below the box).
White for neutral zones (price inside the box).
User-Friendly Inputs: Adjust pivot lookback periods, box visibility, extension behavior, and colors via intuitive input settings.
How It Works
Zone Detection: The indicator uses pivot highs and lows to define supply and demand zones, plotting boxes between these levels.
Box Behavior:
Boxes are created when pivot highs and lows are confirmed, with no overlap with the previous box.
When price enters a box, it shrinks to reflect interaction, stopping once price exits completely.
Boxes can extend to the current bar or end at 4:00 PM of the creation day (or next trading day if created after 4:00 PM or on weekends).
Display Options:
Current Only: Shows boxes created on the current day.
Historical Only: Shows boxes from previous days, with optional color updates.
All Boxes: Shows all boxes, with an option to hide historical box color updates.
Performance: Limits the number of boxes to 200 to ensure smooth performance, removing older boxes as needed.
Inputs
Pivot Look Right/Left: Set the number of bars (default: 2) to confirm pivot highs and lows.
What Boxes to Show: Select Current Only, Historical Only, or All Boxes (default: Current Only).
Boxes On/Off: Toggle box visibility (default: on).
Extend Boxes to Current Bar: Choose whether boxes extend to the current bar or stop at 4:00 PM (default: off, stops at 4:00 PM).
Update Past Box Colors: Enable/disable color updates for historical boxes (default: on).
Demand/Supply/Neutral Box Color: Customize border colors (default: green, red, white).
How to Use
Add the indicator to your chart.
Adjust inputs to match your trading style (e.g., pivot lookback, box extension, colors).
Use the boxes to identify potential support (demand) and resistance (supply) zones:
Green-bordered boxes (price above) may act as support.
Red-bordered boxes (price below) may act as resistance.
White-bordered boxes (price inside) indicate active price interaction.
Combine with other analysis tools (e.g., trendlines, indicators) to confirm trade setups.
Monitor box shrinking to gauge zone strength and watch for breakouts when price fully crosses a box.
Understanding Supply and Demand in Stock Trading
In stock trading, supply and demand are fundamental forces driving price movements. Demand refers to the willingness of buyers to purchase a stock at a given price, often creating support levels where buying interest prevents further price declines. Supply represents the willingness of sellers to offload a stock, forming resistance levels where selling pressure halts price increases. These zones are critical because they highlight areas where significant buying or selling activity has occurred, influencing future price behavior.
The importance of supply and demand lies in their ability to reveal where institutional traders, with large orders, have entered or exited the market. Demand zones, often seen at pivot lows, indicate strong buying interest and potential areas for price reversals or bounces. Supply zones, typically at pivot highs, signal heavy selling and possible reversal points for downward moves. By identifying these zones, traders can anticipate where price is likely to stall, reverse, or break out, enabling better entry and exit decisions. This indicator visualizes these zones as dynamic boxes, making it easier to spot high-probability trading opportunities while emphasizing the core market dynamics of supply and demand.
Feedback
This indicator is designed to help traders visualize supply and demand zones effectively. If you have suggestions for improvements, please share your feedback in the comments!
Liquidity Zones [ActiveQuants]The Liquidity Zones indicator detects price areas where high trading volume coincides with below-average volatility , critical zones where large players often accumulate or distribute positions. Ideal for spotting potential reversal points and strategic liquidity pools.
Core Detection Formula
Liquidity Zone = (Volume > SMA(Volume, Length) × Multiplier) AND (Short-Term Volatility < 0.5 × Average Volatility)
Volume Surge Detection
Compares current volume to its SMA (user-defined length).
Multiplies threshold with " Volume Threshold Multiplier " parameter.
Volatility Contraction Filter
Calculates 5-bar volatility (standard deviation of closes).
Compares to average volatility over " Price Std. Dev. Length " period.
Requires short-term volatility < 50% of average.
█ KEY FEATURES
Merging Consecutive Zones
If the " Merge Consecutive Zones " option is enabled, the indicator will:
Calculate the number of consecutive bars that meet the liquidity zone criteria.
Sum the volume of these consecutive bars.
Display only the most recent label for the merged zone (previous labels in the sequence are removed).
Displays volume in either
Raw units (" Units ").
Dollar-equivalent (" Currency Value ") using closing price.
Alerts
An alert condition is built into the script. Traders can selectively enable alerts via TradingView’s alert system. Whenever a liquidity zone is detected, an alert is triggered with the message: " High-volume and low-volatility zone detected! ".
█ USER INPUTS
- Liquidity Zones Color
Sets the background color for liquidity zones.
Default: Orange (with 70 transparency).
- Volume SMA Length
Determines the number of bars over which the volume simple moving average is calculated.
Default: 20 bars.
- Volume Threshold Multiplier
Multiplies the volume SMA to establish a threshold. A bar’s volume must exceed this product to be considered high volume.
Default: 2.0.
- Price Std. Dev. Length
The period used to calculate the standard deviation of the closing prices. This is the basis for measuring average volatility.
Default: 14 bars.
- Zone Volume
A toggle to display a label with the volume value on liquidity zones.
Allows you to choose how the volume is displayed: Units (shows raw volume) or Currency Value (multiplies volume by the current closing price).
Allows you to choose the font size of the volume label.
- Merge Consecutive Zones
When enabled, volumes from consecutive liquidity zones are summed into a single total, and only the most recent label is displayed (previous labels in the sequence are removed).
Default: Enabled.
- Show Last
Specifies the number of bars back that the indicator will evaluate and plot liquidity zones.
Default: 500 bars.
- Timeframe
Analysis period.
Default: Chart.
█ CONCLUSION
The Liquidity Zones indicator is a powerful tool for traders seeking to identify key areas on the chart where liquidity is concentrated, characterized by high volume and low volatility . With customizable settings for volume analysis and volatility measurement , this indicator can be integrated into a wide range of trading strategies. It not only highlights these zones visually but also provides volume data labels and alerts for timely decision-making.
█ IMPORTANT NOTES
⚠ Volume and Volatility Settings: Adjust the Volume SMA Length , Volume Threshold Multiplier , and Price Std. Dev. Length to suit the typical trading volume and volatility of the asset you are analyzing.
⚠ Confirmed Bars Only: Signals are generated only on confirmed bars. This minimizes false signals due to intra-bar noise and also prevents indicator repainting .
⚠ Risk Management: Liquidity zones may signal areas of potential accumulation or distribution, but they should be used in conjunction with other technical analysis tools (e.g., support/resistance levels, trendlines, or momentum indicators). Trading involves risk, and it is recommended to combine this indicator with proper risk management techniques.
█ RISK DISCLAIMER
Trading involves substantial risk of loss. Liquidity zones indicate potential interest areas but don't guarantee price reactions. Always confirm with additional analysis and proper risk management. Past performance is not indicative of future results.
📈 Happy trading! 🚀

AO/AC Trading Zones Strategy [Skyrexio] Overview
AO/AC Trading Zones Strategy leverages the combination of Awesome Oscillator (AO), Acceleration/Deceleration Indicator (AC), Williams Fractals, Williams Alligator and Exponential Moving Average (EMA) to obtain the high probability long setups. Moreover, strategy uses multi trades system, adding funds to long position if it considered that current trend has likely became stronger. Combination of AO and AC is used for creating so-called trading zones to create the signals, while Alligator and Fractal are used in conjunction as an approximation of short-term trend to filter them. At the same time EMA (default EMA's period = 100) is used as high probability long-term trend filter to open long trades only if it considers current price action as an uptrend. More information in "Methodology" and "Justification of Methodology" paragraphs. The strategy opens only long trades.
Unique Features
No fixed stop-loss and take profit: Instead of fixed stop-loss level strategy utilizes technical condition obtained by Fractals and Alligator to identify when current uptrend is likely to be over. In some special cases strategy uses AO and AC combination to trail profit (more information in "Methodology" and "Justification of Methodology" paragraphs)
Configurable Trading Periods: Users can tailor the strategy to specific market windows, adapting to different market conditions.
Multilayer trades opening system: strategy uses only 10% of capital in every trade and open up to 5 trades at the same time if script consider current trend as strong one.
Short and long term trend trade filters: strategy uses EMA as high probability long-term trend filter and Alligator and Fractal combination as a short-term one.
Methodology
The strategy opens long trade when the following price met the conditions:
1. Price closed above EMA (by default, period = 100). Crossover is not obligatory.
2. Combination of Alligator and Williams Fractals shall consider current trend as an upward (all details in "Justification of Methodology" paragraph)
3. Both AC and AO shall print two consecutive increasing values. At the price candle close which corresponds to this condition algorithm opens the first long trade with 10% of capital.
4. If combination of Alligator and Williams Fractals shall consider current trend has been changed from up to downtrend, all long trades will be closed, no matter how many trades has been opened.
5. If AO and AC both continue printing the rising values strategy opens the long trade on each candle close with 10% of capital while number of opened trades reaches 5.
6. If AO and AC both has printed 5 rising values in a row algorithm close all trades if candle's low below the low of the 5-th candle with rising AO and AC values in a row.
Script also has additional visuals. If second long trade has been opened simultaneously the Alligator's teeth line is plotted with the green color. Also for every trade in a row from 2 to 5 the label "Buy More" is also plotted just below the teeth line. With every next simultaneously opened trade the green color of the space between teeth and price became less transparent.
Strategy settings
In the inputs window user can setup strategy setting:
EMA Length (by default = 100, period of EMA, used for long-term trend filtering EMA calculation).
User can choose the optimal parameters during backtesting on certain price chart.
Justification of Methodology
Let's explore the key concepts of this strategy and understand how they work together. We'll begin with the simplest: the EMA.
The Exponential Moving Average (EMA) is a type of moving average that assigns greater weight to recent price data, making it more responsive to current market changes compared to the Simple Moving Average (SMA). This tool is widely used in technical analysis to identify trends and generate buy or sell signals. The EMA is calculated as follows:
1.Calculate the Smoothing Multiplier:
Multiplier = 2 / (n + 1), Where n is the number of periods.
2. EMA Calculation
EMA = (Current Price) × Multiplier + (Previous EMA) × (1 − Multiplier)
In this strategy, the EMA acts as a long-term trend filter. For instance, long trades are considered only when the price closes above the EMA (default: 100-period). This increases the likelihood of entering trades aligned with the prevailing trend.
Next, let’s discuss the short-term trend filter, which combines the Williams Alligator and Williams Fractals. Williams Alligator
Developed by Bill Williams, the Alligator is a technical indicator that identifies trends and potential market reversals. It consists of three smoothed moving averages:
Jaw (Blue Line): The slowest of the three, based on a 13-period smoothed moving average shifted 8 bars ahead.
Teeth (Red Line): The medium-speed line, derived from an 8-period smoothed moving average shifted 5 bars forward.
Lips (Green Line): The fastest line, calculated using a 5-period smoothed moving average shifted 3 bars forward.
When the lines diverge and align in order, the "Alligator" is "awake," signaling a strong trend. When the lines overlap or intertwine, the "Alligator" is "asleep," indicating a range-bound or sideways market. This indicator helps traders determine when to enter or avoid trades.
Fractals, another tool by Bill Williams, help identify potential reversal points on a price chart. A fractal forms over at least five consecutive bars, with the middle bar showing either:
Up Fractal: Occurs when the middle bar has a higher high than the two preceding and two following bars, suggesting a potential downward reversal.
Down Fractal: Happens when the middle bar shows a lower low than the surrounding two bars, hinting at a possible upward reversal.
Traders often use fractals alongside other indicators to confirm trends or reversals, enhancing decision-making accuracy.
How do these tools work together in this strategy? Let’s consider an example of an uptrend.
When the price breaks above an up fractal, it signals a potential bullish trend. This occurs because the up fractal represents a shift in market behavior, where a temporary high was formed due to selling pressure. If the price revisits this level and breaks through, it suggests the market sentiment has turned bullish.
The breakout must occur above the Alligator’s teeth line to confirm the trend. A breakout below the teeth is considered invalid, and the downtrend might still persist. Conversely, in a downtrend, the same logic applies with down fractals.
In this strategy if the most recent up fractal breakout occurs above the Alligator's teeth and follows the last down fractal breakout below the teeth, the algorithm identifies an uptrend. Long trades can be opened during this phase if a signal aligns. If the price breaks a down fractal below the teeth line during an uptrend, the strategy assumes the uptrend has ended and closes all open long trades.
By combining the EMA as a long-term trend filter with the Alligator and fractals as short-term filters, this approach increases the likelihood of opening profitable trades while staying aligned with market dynamics.
Now let's talk about the trading zones concept and its signals. To understand this we need to briefly introduce what is AO and AC. The Awesome Oscillator (AO), developed by Bill Williams, is a momentum indicator designed to measure market momentum by contrasting recent price movements with a longer-term historical perspective. It helps traders detect potential trend reversals and assess the strength of ongoing trends.
The formula for AO is as follows:
AO = SMA5(Median Price) − SMA34(Median Price)
where:
Median Price = (High + Low) / 2
SMA5 = 5-period Simple Moving Average of the Median Price
SMA 34 = 34-period Simple Moving Average of the Median Price
The Acceleration/Deceleration (AC) Indicator, introduced by Bill Williams, measures the rate of change in market momentum. It highlights shifts in the driving force of price movements and helps traders spot early signs of trend changes. The AC Indicator is particularly useful for identifying whether the current momentum is accelerating or decelerating, which can indicate potential reversals or continuations. For AC calculation we shall use the AO calculated above is the following formula:
AC = AO − SMA5(AO) , where SMA5(AO)is the 5-period Simple Moving Average of the Awesome Oscillator
When the AC is above the zero line and rising, it suggests accelerating upward momentum.
When the AC is below the zero line and falling, it indicates accelerating downward momentum.
When the AC is below zero line and rising it suggests the decelerating the downtrend momentum. When AC is above the zero line and falling, it suggests the decelerating the uptrend momentum.
Now let's discuss the trading zones concept and how it can create the signal. Zones are created by the combination of AO and AC. We can divide three zone types:
Greed zone: when the AO and AC both are rising
Red zone: when the AO and AC both are decreasing
Gray zone: when one of AO or AC is rising, the other is falling
Gray zone is considered as uncertainty. AC and AO are moving in the opposite direction. Strategy skip such price action to decrease the chance to stuck in the losing trade during potential sideways. Red zone is also not interesting for the algorithm because both indicators consider the trend as bearish, but strategy opens only long trades. It is waiting for the green zone to increase the chance to open trade in the direction of the potential uptrend. When we have 2 candles in a row in the green zone script executes a long trade with 10% of capital.
Two green zone candles in a row is considered by algorithm as a bullish trend, but now so strong, that's the reason why trade is going to be closed when the combination of Alligator and Fractals will consider the the trend change from bullish to bearish. If id did not happens, algorithm starts to count the green zone candles in a row. When we have 5 in a row script change the trade closing condition. Such situation is considered is a high probability strong bull market and all trades will be closed if candle's low will be lower than fifth green zone candle's low. This is used to increase probability to secure the profit. If long trades are initiated, the strategy continues utilizing subsequent signals until the total number of trades reaches a maximum of 5. Each trade uses 10% of capital.
Why we use trading zones signals? If currently strategy algorithm considers the high probability of the short-term uptrend with the Alligator and Fractals combination pointed out above and the long-term trend is also suggested by the EMA filter as bullish. Rising AC and AO values in the direction of the most likely main trend signaling that we have the high probability of the fastest bullish phase on the market. The main idea is to take part in such rapid moves and add trades if this move continues its acceleration according to indicators.
Backtest Results
Operating window: Date range of backtests is 2023.01.01 - 2024.12.31. It is chosen to let the strategy to close all opened positions.
Commission and Slippage: Includes a standard Binance commission of 0.1% and accounts for possible slippage over 5 ticks.
Initial capital: 10000 USDT
Percent of capital used in every trade: 10%
Maximum Single Position Loss: -9.49%
Maximum Single Profit: +24.33%
Net Profit: +4374.70 USDT (+43.75%)
Total Trades: 278 (39.57% win rate)
Profit Factor: 2.203
Maximum Accumulated Loss: 668.16 USDT (-5.43%)
Average Profit per Trade: 15.74 USDT (+1.37%)
Average Trade Duration: 60 hours
How to Use
Add the script to favorites for easy access.
Apply to the desired timeframe and chart (optimal performance observed on 4h BTC/USDT).
Configure settings using the dropdown choice list in the built-in menu.
Set up alerts to automate strategy positions through web hook with the text: {{strategy.order.alert_message}}
Disclaimer:
Educational and informational tool reflecting Skyrex commitment to informed trading. Past performance does not guarantee future results. Test strategies in a simulated environment before live implementation
These results are obtained with realistic parameters representing trading conditions observed at major exchanges such as Binance and with realistic trading portfolio usage parameters.

Awesome_Accelerator_Zone OscillatorExplanation and Usage Guide for AO_AC_ZONE Oscillator
Indicator Overview
The **AO_AC_ZONE** oscillator is based on the concepts introduced by **Bill Williams** in his book *New Trading Dimensions*. This indicator combines the **Awesome Oscillator (AO)**, **Accelerator Oscillator (AC)**, and a custom **Zone Oscillator**, visualizing them together in a clear, color-coded format.
The Zone Oscillator is derived from the relationship between AO and AC, indicating the market's dominant momentum state (bullish, bearish, or neutral). It also integrates real-time candle coloring to visually align price bars with the Zone's momentum.
---
**Components**
1. **Awesome Oscillator (AO)**:
- AO measures the difference between a 5-period and 34-period Simple Moving Average (SMA) applied to the midpoints of candles.
- It reflects market momentum, where:
- Green bars = increasing momentum
- Red bars = decreasing momentum
2. **Accelerator Oscillator (AC)**:
- AC is calculated as the difference between AO and its 5-period SMA.
- It indicates the acceleration or deceleration of market momentum.
- Fuchsia bars = increasing momentum
- Purple bars = decreasing momentum
3. **Zone Oscillator**:
- The Zone combines AO and AC states:
- **Green Zone**: Both AO and AC are positive (bullish momentum).
- **Red Zone**: Both AO and AC are negative (bearish momentum).
- **Gray Zone**: AO and AC have differing signs (neutral/uncertain momentum).
- Candle colors dynamically match the Zone’s state for enhanced visual clarity.
---
**How to Use the Indicator**
**1. Interpreting the Oscillators**
- **AO**: Use it to detect momentum direction and changes. Pay attention to shifts in bar color:
- **Increasing AO (Aqua)**: Bullish momentum gaining strength.
- **Decreasing AO (Navy)**: Bullish momentum weakening or bearish momentum strengthening.
- **AC**: Provides early signals of momentum shifts.
- If AC changes color ahead of AO, it signals potential trend reversals or accelerations.
**2. Using the Zone Oscillator**
- **Green Zone**:
- Both AO and AC are positive.
- Indicates a strong bullish trend. Look for buying opportunities in line with the trend.
- **Red Zone**:
- Both AO and AC are negative.
- Signals strong bearish momentum. Look for shorting opportunities.
- **Gray Zone**:
- AO and AC are in conflict.
- Represents uncertainty; avoid trading or wait for a clear signal.
---
**Real-Time Application**
**Candle Coloring**
- The indicator modifies candle colors to match the Zone Oscillator's state:
- **Green Candles**: Strong bullish momentum.
- **Red Candles**: Strong bearish momentum.
- **Gray Candles**: Neutral momentum.
**Recommended Strategy (Based on New Trading Dimensions)**:
1. **Identify the Zone**:
- Focus on Green Zones for long entries and Red Zones for short entries.
2. **Look for AO/AC Confirmation**:
- Enter trades in the direction of both AO and AC when they align with the Zone.
- For exits, monitor when AO and AC conflict (Gray Zone).
3. **Use in Combination**:
- Combine this oscillator with fractals or trend indicators to confirm signals.
---
**Benefits**
- Visualizes momentum strength, acceleration, and alignment in one chart.
- Simplifies decision-making by integrating price action with oscillator dynamics.
- Supports faster trade identification and execution by highlighting bullish, bearish, and neutral zones.
---
**Disclaimer**
This indicator is a tool to assist in market analysis. Always incorporate proper risk management and avoid trading during uncertain conditions (Gray Zones). For optimal results, use this oscillator in conjunction with other analysis methods like support/resistance, volume analysis, and trend-following systems.

Time Zone PSenseiTitle: Time Zone PS Indicator
Author: Orlando Depablos
Description:
The Time Zone PS Indicator is a tool designed to help traders visualize different trading sessions on their charts. It allows users to specify three different trading sessions: the start of the day, the London session, and the New York (NYC) session. Each session is represented by a distinct color-coded background on the chart.
Features:
Customizable Sessions: Traders can define the start time and end time for each trading session according to their preference. This flexibility enables users to tailor the indicator to their specific trading strategies session time zones.
Session Display Control: Users have the option to choose whether they want to display each trading session on the chart. This feature allows for a clutter-free charting experience, where traders can focus on the sessions relevant to their analysis.
Visual Clarity: The indicator uses distinct colors for each trading session, making it easy for traders to differentiate between different time zones. This visual clarity aids in quickly identifying key trading periods throughout the day.
How to Use:
Setting Up Sessions: Use the input options to define the start and end times for the start of the day, the London session, and the NYC session. Adjust these values based on your trading preferences and time zone.
Display Preferences: Toggle the display options to choose which trading sessions you want to visualize on the chart. This allows for a customizable charting experience tailored to your specific needs.
Interpreting the Chart: Once configured, the indicator will display color-coded backgrounds on the chart corresponding to the defined trading sessions. Interpret these visual cues to identify key trading periods and plan your trading strategies accordingly.
Originality:
The Time Zone PS Indicator adds value to the TradingView community by providing traders with a customizable tool to visualize different trading sessions. While similar indicators exist, this script offers flexibility and ease of use, enhancing the charting experience for traders across various time zones.
Use Cases:
Session-Based Analysis: Traders can use the indicator to analyze price action within specific trading sessions, such as the London or NYC session, to identify potential trading opportunities.
Time Zone Adjustment: Traders operating in different time zones can adjust the indicator settings to align with their local trading hours, ensuring accurate visualization of relevant trading sessions.
Strategy Development: The indicator can aid in the development of trading strategies that capitalize on price movements during specific trading sessions, helping traders optimize their trading performance.
Chart Visualization:
The indicator provides a clear and concise visualization of different trading sessions on the chart. Each session is represented by a color-coded background, allowing traders to quickly identify key trading periods and make informed trading decisions.

Support and Resistance ZoneSupport and Resistance Zone Indicator :
Introduction :
The purpose of this indicator is to identify the chart symbol's main supports and resistances. It displays these key zones, which are very important psychological points for traders. Since support and resistance are not very precise levels, the indicator displays them as zones.
Pivots :
Pivots are a key concept in identifying support and resistance. The indicator uses two types of pivot:
Pivot high : This is a high point that has not been reached by a user-defined number of candles on either the left and right of this candle. The " left pivot leg " is the number of candles before this pivot point that have not reached the realized high, and the " right pivot leg " is the number of candles after this pivot point that have not reached this high. If these two conditions are met, the pivot point is considered a turning point, and resistance is probably the cause.
Pivot low : This is a low point that has not been reached by a user-defined number of candles on either the left or right. The " left pivot leg " is the number of candles before this pivot point that have not reached the candle low, and the " right pivot leg " is the number of candles after this pivot point that have not reached this low. If these two conditions are met, the pivot point is considered a turning point, and support is probably the cause.
Support/Resistance area :
If a pivot point has been identified, the indicator considers it a resistance if it's a pivot high, or a support if it's a pivot low. To define the support or resistance zone, we'll use the ATR (Average True Range), an indicator that measures asset volatility. We'll take the ATR of the candle for which the pivot was spotted, and use it as the width of the support or resistance zone. Thus the upper line of support/resistance is at pivot+atr/2 and the lower line is at pivot-atr/2 . The greater the volatility, the larger the zone.
New Support/Resistance :
If a new pivot has been identified, but the level of this pivot lies between the lower line and the upper line of the previous support or resistance, the indicator considers this to be the same support or resistance as before. In this case, no new support or resistance is created. The pivot must be outside the area of the previous support or resistance to be validated.
Anticipated Support/Resistance :
This indicator also allows early detection of support or resistance. To do this, the value of the right pivot legs will be shortened in order to find these areas more quickly. The support or resistance will then be considered anticipated and may disappear at any time if the high/low is reached. On the other hand, if the high/low is not reached, and a number of candles equal to the " Right Pivot Legs" parameter has elapsed since the detection of this anticipated support/resistance, it will be considered validated and will integrate the other supports/resistances of the chart.
Extended supports/resistances :
For a more optimal view, the indicator allows the user to choose the number of last support or resistance levels to be extended to the last candle. This must be specified in the indicator parameters.
Parameters :
Pivot Legs : Determine the left and right legs of the pivot i.e the number of candle before and after the pivot that doesn’t reach pivot point. The pivot is validated only if this two conditions are verified.
Extend Last Supports : Number of supports to extend to the last bar
Extend Last Resistances : Number of resistances to extend to the last bar
Show Support/Resistance Anticipated : If yes, will find anticipated support and resistance
Right Pivot Legs for Anticipation : Determine the right legs of pivots to find faster a support or a resistance.
Conclusion :
This indicator plot support and resistance zones based on pivot. The width of support and resistance zones are calculated with ATR. Possibility to find anticipated support and resistance in order to have more timeliness informations.
Enjoy the indicator and don’t forget to take the trade ;)
PPSignal - Fibonacci ZonesThis is a high probability analysis with Fibonacci Zones.
Zones:
E1 = 1.382
E = 1.00
D1 = 0.618
D = 0.50
Daily Pivot (Balance Point)
B = 0.50
B1 = 0.618
A = 1.00
A1 = 1.382
The Fibonacci ZonesTM are based on the High + Low + Close of TODAY (after the close) and then projecting the Zones for TOMORROW .
You can choose different periods of time to perform the zone calculations according to the timefreame. By default it is set to Weekly (W).

Session Highlighter with Kill Zones [Exponential-X]Session Highlighter with Kill Zones
Overview
This indicator provides comprehensive visualization of major forex trading sessions (Asian, London, and New York) with integrated kill zone detection and real-time session analytics. It helps traders identify optimal trading times by highlighting high-volatility periods and tracking session-specific price ranges.
What Makes This Original
While session indicators are common, this script uniquely combines several features that work together:
Kill Zone Integration: Highlights specific high-volatility windows within sessions (London: 02:00-05:00 EST, NY: 08:30-11:00 EST) when institutional activity typically peaks
Session Overlap Detection: Automatically detects and highlights when major sessions overlap (London-NY, Asian-London) with distinct visual cues
Real-Time Range Tracking: Calculates and displays percentage-based session ranges as they develop, not just historical data
Dynamic Statistics Dashboard: Live table showing current active session, session times, and comparative range percentages
Customizable Visual System: Flexible styling options including background shading, box overlays, and configurable line styles for session boundaries
How It Works
Session Detection Logic
The script uses timezone-normalized session detection based on EST/EDT times. It converts the current bar's timestamp to New York time and determines which session(s) are active using minute-based calculations. This approach ensures accurate session detection regardless of your chart's timezone settings.
Kill Zones
Kill zones represent periods within sessions when institutional traders are most active. The London kill zone (02:00-05:00 EST) captures pre-London open volatility, while the NY kill zone (08:30-11:00 EST) aligns with US economic data releases and market open activity.
Range Calculations
Session highs, lows, and opens are tracked from the first bar of each session and updated in real-time. Range percentages are calculated as: ((High - Low) / Low) × 100 , providing a volatility measure that's comparable across different instruments and price levels.
Visual System
Background shading: Color-coded zones for each session
Session boxes: Outline entire session ranges
H/L lines: Dynamic lines showing current session extremes
Open lines: Reference levels from session start
Overlap highlighting: Distinct colors when multiple sessions are active simultaneously
How to Use
Intraday Trading: Use kill zones to time entries during high-liquidity periods
Session Breakouts: Monitor for price breaks above/below session highs/lows
Range Trading: Trade between session boundaries during consolidation
Session Continuity: Observe how price behaves as sessions transition
Volatility Assessment: Compare current session ranges to typical values
Recommended Timeframes: Works on any timeframe, but most useful on 1m to 1H charts for intraday trading.
Settings Explained
Sessions Group
Toggle each major session on/off independently
Customize colors for visual clarity
Enable/disable overlap highlighting
Levels Group
Show/hide session high/low lines
Show/hide session open levels
Choose line styles (Solid/Dashed/Dotted)
Kill Zones Group
Toggle kill zone highlighting
Select which kill zones to display
Customize kill zone color intensity
Display Group
Show/hide statistics table
Show/hide session labels on chart
Important Notes
All times are displayed in EST/EDT
Session ranges reset at the start of each new session
Kill zones are session sub-periods, not separate sessions
Overlap colors override individual session colors when multiple sessions are active
The statistics table updates in real-time and shows percentage-based ranges for cross-instrument comparison
Session Times Reference
Asian Session: 19:00 - 04:00 EST (Tokyo open through early Sydney close)
London Session: 03:00 - 12:00 EST (Full European trading hours)
New York Session: 08:00 - 17:00 EST (US market hours)
London Kill Zone: 02:00 - 05:00 EST (Pre-London volatility spike)
NY Kill Zone: 08:30 - 11:00 EST (US open and news releases)
Alerts Available
The script includes six pre-configured alert conditions:
London Kill Zone start
NY Kill Zone start
London-NY Overlap start
Asian Session open
London Session open
NY Session open
Create alerts through TradingView's alert system to get notified when specific sessions or kill zones begin.
Disclaimer: This indicator is for informational purposes only. Session times and kill zones are based on typical market patterns but do not guarantee specific trading outcomes. Always use proper risk management.

Trendlines & SR ZonesIt's a comprehensive indicator (Pine Script v6) that represents two powerful technical analysis tools: automatic trendline detection based on pivot points and volume delta analysis with support/resistance zone identification. This overlay indicator helps traders identify potential trend directions and key price levels where significant buying or selling pressure has occurred.
Features: =
1. Price Trendlines
The indicator automatically identifies and draws trendlines based on pivot points, creating dynamic support and resistance levels.
Key Components:
Pivot Detection: Uses configurable left and right bars to identify significant pivot highs and lows
Trendline Filtering: Only draws downward-sloping resistance trendlines and upward-sloping support trendlines
Zone Creation: Creates filled zones around trendlines based on average price volatility
Automatic Management: Maintains only the 3 most recent significant trendlines to avoid chart clutter
Customization Options:
Left/Right Bars for Pivot: Adjust sensitivity of pivot detection (default: 10 bars each side)
Extension Length: Control how far trendlines extend past the second pivot (default: 50 bars)
Average Body Periods: Set the lookback period for volatility calculation (default: 100)
Tolerance Multiplier: Adjust the width of the trendline zones (default: 1.0)
Color Customization: Separate colors for high (resistance) and low (support) trendlines and their fills
2. Volume Delta % Bars
The indicator analyzes volume distribution across price levels to identify significant supply and demand zones.
Key Components:
Volume Profile Analysis: Divides the price range into rows and calculates volume delta at each level
Delta Visualization: Displays horizontal bars showing the percentage difference between buying and selling volume
Zone Identification: Automatically identifies the most significant supply and demand zones
Visual Integration: Connects volume delta bars with corresponding support/resistance zones on the price chart
Customization Options:
Lookback Period: Set the number of bars to analyze for volume (default: 200)
Price Rows: Control the granularity of the volume analysis (default: 50 rows)
Delta Sections: Adjust the number of horizontal delta bars displayed (default: 20)
Panel Appearance: Customize width, position, and direction of the delta panel
Zone Settings: Control the number of supply/demand zones and their extension (default: 3 zones)
How It Works-
Trendline Logic:
The script continuously scans for pivot highs and lows based on the specified left and right bars
When a pivot is detected, it creates a horizontal line at that price level
The script then looks for the previous pivot of the same type (high or low)
It connects these pivots with a trendline, extending it based on the user-specified setting
A parallel line is created to form a zone, with the distance based on average price volatility
The script filters out invalid trendlines (upward-sloping resistance and downward-sloping support). Only the 3 most recent trendlines are maintained to prevent chart clutter
Volume Delta Logic:
The script divides the price range over the lookback period into the specified number of rows
For each bar in the lookback period, it categorizes volume as bullish (close > open) or bearish (close < open). This volume is assigned to the appropriate price level based on the HLC3 price.
The price levels are grouped into sections, and the net delta (bullish - bearish volume) is calculated for each Horizontal bars are drawn to represent these delta percentages.
The most significant positive and negative deltas are identified and displayed as support and resistance zones. These zones are extended to the left on the price chart and connected to the delta panel with dotted lines.
Ideal Timeframes:
The indicator is versatile and can be used across multiple timeframes, but it performs optimally on specific timeframes depending on your trading style:
For Day Trading:
Optimal Timeframes: 15-minute to 1-hour charts
Why: These timeframes provide a good balance between noise reduction and sufficient volume data. The volume delta analysis is particularly effective on these timeframes as it captures intraday accumulation/distribution patterns while the trendlines remain reliable enough for intraday trading decisions.
For Swing Trading:
Optimal Timeframes: 1-hour to 4-hour charts
Why: These timeframes offer the best combination of reliable trendline formation and meaningful volume analysis. The trendlines on these timeframes are less prone to whipsaws, while the volume delta analysis captures multi-day trading sessions and institutional activity.
For Position Trading:
Optimal Timeframes: Daily and weekly charts
Why: On these higher timeframes, trendlines become extremely reliable as they represent significant market structure points. The volume delta analysis reveals longer-term accumulation and distribution patterns that can define major support and resistance zones for weeks or months.
Timeframe-Specific Adjustments:
Lower Timeframes (1-15 minutes):
Reduce left/right bars for pivots (5-8 bars)
Decrease lookback period for volume delta (50-100 bars)
Increase tolerance multiplier (1.2-1.5) to account for higher volatility
Higher Timeframes (Daily+):
Increase left/right bars for pivots (15-20 bars)
Extend lookback period for volume delta (300-500 bars)
Consider increasing the number of price rows (70-100) for more detailed volume analysis
Usage Guidelines-
For Trendline Analysis:
Use the trendlines as dynamic support and resistance levels
Price reactions at these levels can indicate potential trend continuation or reversal points
The filled zones around trendlines represent areas of price volatility or uncertainty
Consider the slope of the trendline as an indication of trend strength
For Volume Delta Analysis:
The horizontal delta bars show where buying or selling pressure has been concentrated
Green bars indicate areas where buying volume exceeded selling volume (demand)
Red bars indicate areas where selling volume exceeded buying volume (supply)
The highlighted supply and demand zones on the price chart represent significant price levels
These zones can act as future support or resistance areas as price revisits them
Customization Tips:
Trendline Sensitivity: Decrease left/right bars values to detect more pivots (more sensitive) or increase them for fewer, more significant pivots
Zone Width: Adjust the tolerance multiplier to make trendline zones wider or narrower based on your trading style
Volume Analysis: Increase the lookback period for a longer-term volume profile or decrease it for more recent activity
Visual Clarity: Adjust colors and transparency settings to match your chart theme and preferences
Conclusion:
This indicator provides traders with a comprehensive view of both trend dynamics and volume-based support/resistance levels. With these two analytical approaches, the indicator offers valuable insights for identifying potential entry and exit points, trend strength, and key price levels where significant market activity has occurred. The extensive customization options allow traders to adapt the indicator to various trading styles and timeframes, with optimal performance on 15-minute to daily charts depending on their trading horizon.
Chart Attached: NSE HINDZINC, EoD 12/12/25
DISCLAIMER: This information is provided for educational purposes only and should not be considered financial, investment, or trading advice. Please do boost if you like it. Happy Trading.

VCAI BOS-Zone PROVCAI BOS-Zone PRO is a structure-driven order-block mapper that tracks swing highs/lows, detects Break of Structure (BOS), and automatically draws clean bullish and bearish OB zones with midlines and directional flags.
It provides a clear, rules-based map of where structural shifts occurred and where price may react on future retests.
What it does:
Uses configurable swing pivots to define structure.
A bullish BOS is triggered when price closes above the last swing high;
a bearish BOS when price closes below the last swing low.
After each BOS, the script finds the last opposite candle (bearish before a bullish BOS, bullish before a bearish BOS) and builds an order-block zone from that candle’s high/low.
Each zone is projected a fixed number of bars into the future, keeping charts clean and preventing zones from extending into the price scale.
Only the latest N bullish and N bearish zones are kept, so the chart focuses on the most relevant active levels.
How to read it:
Yellow boxes + BULL flags = bullish demand zones.
Purple boxes + BEAR flags = bearish supply zones.
The edges of each zone act as potential support/resistance.
Reactions inside a yellow zone suggest buy-side interest;
rejection at a purple zone suggests sell-side pressure.
Optional midlines mark the 50% level of each zone, commonly used for refined entries, mitigations, and partial management.
How traders typically use it:
BOS-Zone PRO does not generate buy/sell alerts, but many traders use the zones as part of a broader decision process:
Bullish zones are often monitored for long setups when price returns and shows strength or continuation.
Bearish zones are often monitored for short setups when price retests and shows rejection or weakness.
Midlines provide refined entry levels with clearer invalidation points.
This tool is best used as structural context alongside your own entry model, risk settings, and trade management.
Notes & best practices:
BOS is directional, not predictive — treat zones as context, not guaranteed reversals.
Works on all symbols and timeframes.
Lower swing settings capture local structure; higher settings focus on major breaks and cleaner OB's.
Ideal as a structural map for discretionary traders or as a component inside automated systems.
Part of the VCAI toolset.
We develop a range of market-structure, volume, trend and liquidity tools designed to work together or stand alone.

XAUUSD 1m SMC Zones (BOS + Flexible TP Modes + Trailing Runner)//@version=6
strategy("XAUUSD 1m SMC Zones (BOS + Flexible TP Modes + Trailing Runner)",
overlay = true,
initial_capital = 10000,
pyramiding = 10,
process_orders_on_close = true)
//━━━━━━━━━━━━━━━━━━━
// 1. INPUTS
//━━━━━━━━━━━━━━━━━━━
// TP / SL
tp1Pips = input.int(10, "TP1 (pips)", minval = 1)
fixedSLpips = input.int(50, "Fixed SL (pips)", minval = 5)
runnerRR = input.float(3.0, "Runner RR (TP2 = SL * RR)", step = 0.1, minval = 1.0)
// Daily risk
maxDailyLossPct = input.float(5.0, "Max daily loss % (stop trading)", step = 0.5)
maxDailyProfitPct = input.float(20.0, "Max daily profit % (stop trading)", step = 1.0)
// HTF S/R (1H)
htfTF = input.string("60", "HTF timeframe (minutes) for S/R block")
// Profit strategy (Option C)
profitStrategy = input.string("Minimal Risk | Full BE after TP1", "Profit Strategy", options = )
// Runner stop mode (your option 4)
runnerStopMode = input.string( "BE only", "Runner Stop Mode", options = )
// ATR trail settings (only used if ATR mode selected)
atrTrailLen = input.int(14, "ATR Length (trail)", minval = 1)
atrTrailMult = input.float(1.0, "ATR Multiplier (trail)", step = 0.1, minval = 0.1)
// Pip size (for XAUUSD: 1 pip = 0.10 if tick = 0.01)
pipSize = syminfo.mintick * 10.0
tp1Points = tp1Pips * pipSize
slPoints = fixedSLpips * pipSize
baseQty = input.float (1.0, "Base order size" , step = 0.01, minval = 0.01)
//━━━━━━━━━━━━━━━━━━━
// 2. DAILY RISK MANAGEMENT
//━━━━━━━━━━━━━━━━━━━
isNewDay = ta.change(time("D")) != 0
var float dayStartEquity = na
var bool dailyStopped = false
equityNow = strategy.initial_capital + strategy.netprofit
if isNewDay or na(dayStartEquity)
dayStartEquity := equityNow
dailyStopped := false
dailyPnL = equityNow - dayStartEquity
dailyPnLPct = dayStartEquity != 0 ? (dailyPnL / dayStartEquity) * 100.0 : 0.0
if not dailyStopped
if dailyPnLPct <= -maxDailyLossPct
dailyStopped := true
if dailyPnLPct >= maxDailyProfitPct
dailyStopped := true
canTradeToday = not dailyStopped
//━━━━━━━━━━━━━━━━━━━
// 3. 1H S/R ZONES (for direction block)
//━━━━━━━━━━━━━━━━━━━
htOpen = request.security(syminfo.tickerid, htfTF, open)
htHigh = request.security(syminfo.tickerid, htfTF, high)
htLow = request.security(syminfo.tickerid, htfTF, low)
htClose = request.security(syminfo.tickerid, htfTF, close)
// Engulf logic on HTF
htBullPrev = htClose > htOpen
htBearPrev = htClose < htOpen
htBearEngulf = htClose < htOpen and htBullPrev and htOpen >= htClose and htClose <= htOpen
htBullEngulf = htClose > htOpen and htBearPrev and htOpen <= htClose and htClose >= htOpen
// Liquidity sweep on HTF previous candle
htSweepHigh = htHigh > ta.highest(htHigh, 5)
htSweepLow = htLow < ta.lowest(htLow, 5)
// Store last HTF zones
var float htResHigh = na
var float htResLow = na
var float htSupHigh = na
var float htSupLow = na
if htBearEngulf and htSweepHigh
htResHigh := htHigh
htResLow := htLow
if htBullEngulf and htSweepLow
htSupHigh := htHigh
htSupLow := htLow
// Are we inside HTF zones?
inHtfRes = not na(htResHigh) and close <= htResHigh and close >= htResLow
inHtfSup = not na(htSupLow) and close >= htSupLow and close <= htSupHigh
// Block direction against HTF zones
longBlockedByZone = inHtfRes // no buys in HTF resistance
shortBlockedByZone = inHtfSup // no sells in HTF support
//━━━━━━━━━━━━━━━━━━━
// 4. 1m LOCAL ZONES (LIQUIDITY SWEEP + ENGULF + QUALITY SCORE)
//━━━━━━━━━━━━━━━━━━━
// 1m engulf patterns
bullPrev1 = close > open
bearPrev1 = close < open
bearEngulfNow = close < open and bullPrev1 and open >= close and close <= open
bullEngulfNow = close > open and bearPrev1 and open <= close and close >= open
// Liquidity sweep by previous candle on 1m
sweepHighPrev = high > ta.highest(high, 5)
sweepLowPrev = low < ta.lowest(low, 5)
// Local zone storage (one active support + one active resistance)
// Quality score: 1 = engulf only, 2 = engulf + sweep (we only trade ≥2)
var float supLow = na
var float supHigh = na
var int supQ = 0
var bool supUsed = false
var float resLow = na
var float resHigh = na
var int resQ = 0
var bool resUsed = false
// New resistance zone: previous bullish candle -> bear engulf
if bearEngulfNow
resLow := low
resHigh := high
resQ := sweepHighPrev ? 2 : 1
resUsed := false
// New support zone: previous bearish candle -> bull engulf
if bullEngulfNow
supLow := low
supHigh := high
supQ := sweepLowPrev ? 2 : 1
supUsed := false
// Raw "inside zone" detection
inSupRaw = not na(supLow) and close >= supLow and close <= supHigh
inResRaw = not na(resHigh) and close <= resHigh and close >= resLow
// QUALITY FILTER: only trade zones with quality ≥ 2 (engulf + sweep)
highQualitySup = supQ >= 2
highQualityRes = resQ >= 2
inSupZone = inSupRaw and highQualitySup and not supUsed
inResZone = inResRaw and highQualityRes and not resUsed
// Plot zones
plot(supLow, "Sup Low", color = color.new(color.lime, 60), style = plot.style_linebr)
plot(supHigh, "Sup High", color = color.new(color.lime, 60), style = plot.style_linebr)
plot(resLow, "Res Low", color = color.new(color.red, 60), style = plot.style_linebr)
plot(resHigh, "Res High", color = color.new(color.red, 60), style = plot.style_linebr)
//━━━━━━━━━━━━━━━━━━━
// 5. MODERATE BOS (3-BAR FRACTAL STRUCTURE)
//━━━━━━━━━━━━━━━━━━━
// 3-bar swing highs/lows
swHigh = high > high and high > high
swLow = low < low and low < low
var float lastSwingHigh = na
var float lastSwingLow = na
if swHigh
lastSwingHigh := high
if swLow
lastSwingLow := low
// BOS conditions
bosUp = not na(lastSwingHigh) and close > lastSwingHigh
bosDown = not na(lastSwingLow) and close < lastSwingLow
// Zone “arming” and BOS validation
var bool supArmed = false
var bool resArmed = false
var bool supBosOK = false
var bool resBosOK = false
// Arm zones when first touched
if inSupZone
supArmed := true
if inResZone
resArmed := true
// BOS after arming → zone becomes valid for entries
if supArmed and bosUp
supBosOK := true
if resArmed and bosDown
resBosOK := true
// Reset BOS flags when new zones are created
if bullEngulfNow
supArmed := false
supBosOK := false
if bearEngulfNow
resArmed := false
resBosOK := false
//━━━━━━━━━━━━━━━━━━━
// 6. ENTRY CONDITIONS (ZONE + BOS + RISK STATE)
//━━━━━━━━━━━━━━━━━━━
flatOrShort = strategy.position_size <= 0
flatOrLong = strategy.position_size >= 0
longSignal = canTradeToday and not longBlockedByZone and inSupZone and supBosOK and flatOrShort
shortSignal = canTradeToday and not shortBlockedByZone and inResZone and resBosOK and flatOrLong
//━━━━━━━━━━━━━━━━━━━
// 7. ORDER LOGIC – TWO PROFIT STRATEGIES
//━━━━━━━━━━━━━━━━━━━
// Common metrics
atrTrail = ta.atr(atrTrailLen)
// MINIMAL MODE: single trade, BE after TP1, optional trailing
// HYBRID MODE: two trades (Scalp @ TP1, Runner @ TP2)
// Persistent tracking
var float longEntry = na
var float longTP1 = na
var float longTP2 = na
var float longSL = na
var bool longBE = false
var float longRunEntry = na
var float longRunTP1 = na
var float longRunTP2 = na
var float longRunSL = na
var bool longRunBE = false
var float shortEntry = na
var float shortTP1 = na
var float shortTP2 = na
var float shortSL = na
var bool shortBE = false
var float shortRunEntry = na
var float shortRunTP1 = na
var float shortRunTP2 = na
var float shortRunSL = na
var bool shortRunBE = false
isMinimal = profitStrategy == "Minimal Risk | Full BE after TP1"
isHybrid = profitStrategy == "Hybrid | Scalp TP + Runner TP"
//━━━━━━━━━━ LONG ENTRIES ━━━━━━━━━━
if longSignal
if isMinimal
longEntry := close
longSL := longEntry - slPoints
longTP1 := longEntry + tp1Points
longTP2 := longEntry + slPoints * runnerRR
longBE := false
strategy.entry("Long", strategy.long)
supUsed := true
supArmed := false
supBosOK := false
else if isHybrid
longRunEntry := close
longRunSL := longRunEntry - slPoints
longRunTP1 := longRunEntry + tp1Points
longRunTP2 := longRunEntry + slPoints * runnerRR
longRunBE := false
// Two separate entries, each 50% of baseQty (for backtest)
strategy.entry("LongScalp", strategy.long, qty = baseQty * 0.5)
strategy.entry("LongRun", strategy.long, qty = baseQty * 0.5)
supUsed := true
supArmed := false
supBosOK := false
//━━━━━━━━━━ SHORT ENTRIES ━━━━━━━━━━
if shortSignal
if isMinimal
shortEntry := close
shortSL := shortEntry + slPoints
shortTP1 := shortEntry - tp1Points
shortTP2 := shortEntry - slPoints * runnerRR
shortBE := false
strategy.entry("Short", strategy.short)
resUsed := true
resArmed := false
resBosOK := false
else if isHybrid
shortRunEntry := close
shortRunSL := shortRunEntry + slPoints
shortRunTP1 := shortRunEntry - tp1Points
shortRunTP2 := shortRunEntry - slPoints * runnerRR
shortRunBE := false
strategy.entry("ShortScalp", strategy.short, qty = baseQty * 50)
strategy.entry("ShortRun", strategy.short, qty = baseQty * 50)
resUsed := true
resArmed := false
resBosOK := false
//━━━━━━━━━━━━━━━━━━━
// 8. EXIT LOGIC – MINIMAL MODE
//━━━━━━━━━━━━━━━━━━━
// LONG – Minimal Risk: 1 trade, BE after TP1, runner to TP2
if isMinimal and strategy.position_size > 0 and not na(longEntry)
// Move to BE once TP1 is touched
if not longBE and high >= longTP1
longBE := true
// Base SL: BE or initial SL
float dynLongSL = longBE ? longEntry : longSL
// Optional trailing after BE
if longBE
if runnerStopMode == "Structure trail" and not na(lastSwingLow) and lastSwingLow > longEntry
dynLongSL := math.max(dynLongSL, lastSwingLow)
if runnerStopMode == "ATR trail"
trailSL = close - atrTrailMult * atrTrail
dynLongSL := math.max(dynLongSL, trailSL)
strategy.exit("Long Exit", "Long", stop = dynLongSL, limit = longTP2)
// SHORT – Minimal Risk: 1 trade, BE after TP1, runner to TP2
if isMinimal and strategy.position_size < 0 and not na(shortEntry)
if not shortBE and low <= shortTP1
shortBE := true
float dynShortSL = shortBE ? shortEntry : shortSL
if shortBE
if runnerStopMode == "Structure trail" and not na(lastSwingHigh) and lastSwingHigh < shortEntry
dynShortSL := math.min(dynShortSL, lastSwingHigh)
if runnerStopMode == "ATR trail"
trailSLs = close + atrTrailMult * atrTrail
dynShortSL := math.min(dynShortSL, trailSLs)
strategy.exit("Short Exit", "Short", stop = dynShortSL, limit = shortTP2)
//━━━━━━━━━━━━━━━━━━━
// 9. EXIT LOGIC – HYBRID MODE
//━━━━━━━━━━━━━━━━━━━
// LONG – Hybrid: Scalp + Runner
if isHybrid
// Scalp leg: full TP at TP1
if strategy.opentrades > 0
strategy.exit("LScalp TP", "LongScalp", stop = longRunSL, limit = longRunTP1)
// Runner leg
if strategy.position_size > 0 and not na(longRunEntry)
if not longRunBE and high >= longRunTP1
longRunBE := true
float dynLongRunSL = longRunBE ? longRunEntry : longRunSL
if longRunBE
if runnerStopMode == "Structure trail" and not na(lastSwingLow) and lastSwingLow > longRunEntry
dynLongRunSL := math.max(dynLongRunSL, lastSwingLow)
if runnerStopMode == "ATR trail"
trailRunSL = close - atrTrailMult * atrTrail
dynLongRunSL := math.max(dynLongRunSL, trailRunSL)
strategy.exit("LRun TP", "LongRun", stop = dynLongRunSL, limit = longRunTP2)
// SHORT – Hybrid: Scalp + Runner
if isHybrid
if strategy.opentrades > 0
strategy.exit("SScalp TP", "ShortScalp", stop = shortRunSL, limit = shortRunTP1)
if strategy.position_size < 0 and not na(shortRunEntry)
if not shortRunBE and low <= shortRunTP1
shortRunBE := true
float dynShortRunSL = shortRunBE ? shortRunEntry : shortRunSL
if shortRunBE
if runnerStopMode == "Structure trail" and not na(lastSwingHigh) and lastSwingHigh < shortRunEntry
dynShortRunSL := math.min(dynShortRunSL, lastSwingHigh)
if runnerStopMode == "ATR trail"
trailRunSLs = close + atrTrailMult * atrTrail
dynShortRunSL := math.min(dynShortRunSL, trailRunSLs)
strategy.exit("SRun TP", "ShortRun", stop = dynShortRunSL, limit = shortRunTP2)
//━━━━━━━━━━━━━━━━━━━
// 10. RESET STATE WHEN FLAT
//━━━━━━━━━━━━━━━━━━━
if strategy.position_size == 0
longEntry := na
shortEntry := na
longBE := false
shortBE := false
longRunEntry := na
shortRunEntry := na
longRunBE := false
shortRunBE := false
//━━━━━━━━━━━━━━━━━━━
// 11. VISUAL ENTRY MARKERS
//━━━━━━━━━━━━━━━━━━━
plotshape(longSignal, title = "Long Signal", style = shape.triangleup,
location = location.belowbar, color = color.lime, size = size.tiny, text = "L")
plotshape(shortSignal, title = "Short Signal", style = shape.triangledown,
location = location.abovebar, color = color.red, size = size.tiny, text = "S")

Demand Supply Zones with MTFDemand Supply Zones with Multi-Timeframe Analysis
Overview:
Advanced institutional demand/supply zone detector with multi-timeframe analysis, proximity alerts, and trend dashboards. Identifies high-probability reversal areas using intelligent base detection and breakout validation across 4 simultaneous timeframes.
Core Unique Features:
• 💎 Elite Base Factor: Auto-detects institutional base patterns using pre-breakout candle body ratio analysis (adjustable 0.1-2.0).
• 🌐 4-Timeframe Zone Detection: Simultaneous MTF zones with individual "👁️ Tested" toggles for granular control - unprecedented in demand/supply indicators.
• 🚨 Proximity Dashboard: Real-time distance tracking to nearest zones (current + all MTF). Visual "APPROACHING!" alerts when price within threshold %.
• 📊 Zone Analytics Dashboard: Live counters for active/tested zones per timeframe with date range display and MTF status tracking.
• 📈 Multi-Timeframe Trend Analysis: 4-TF trend direction
• 🎯 Advanced EMA System: 10 multi-timeframe EMA-20 lines + Golden/Death Cross alerts with customizable styling.
• 📅 Date Range Filter: Performance optimization with calendar-based zone limits (10-500 zones).
• 🧩 Gap Filling: Optional gap bridging between base and leg-out candles for continuous zones.
• 🔐 No Repainting: MTF zones created only on confirmed bars with lookahead bias disabled.
How It Works:
1. Base Detection: Identifies consolidation candles (1-4 consecutive) with customizable body % threshold. Elite mode auto-detects when pre-breakout candle is significantly smaller.
2. Leg-Out Validation: Confirms breakout strength of legout
3. Zone Extension: Projects zones forward (10-500 bars).Fresh zones (green/red) turn gray when tested.
4. MTF Integration: Detects zones from 4 higher timeframes with independent parameters. Each MTF has individual tested zone toggle.
5. Analytics: Proximity dashboard calculates real-time distance to nearest zones. Trend dashboard shows direction across 4 TFs.
Important Notes:
• Educational Purpose: This indicator is for analysis and learning only. Does not guarantee future results.
• Risk Management Required: Always use stop losses and proper position sizing.
• Chart Type: Use standard Candlestick charts. Non-standard charts (Heikin Ashi/Renko) not recommended for accurate zone detection.
• Timeframe Requirements: MTF zones appear only when viewing lower timeframe than selected MTF (e.g., view 1H chart to see Daily MTF zones).
• Performance: Enable Date Range Filter when using multiple MTF timeframes to reduce computational load.
• Past Performance Disclaimer: Historical accuracy does not guarantee future trading results.
⭐ If you find this indicator valuable, please like and share!

Simple Pivot Zones (Error-free) — v11. Core Idea
The indicator we built is a “pivot-based zone detector with breakout signals.”
It does three things:
1. Finds important swing highs and swing lows in price (pivots).
2. Creates support and resistance zones around those pivots using volatility (ATR).
3. Watches price action to see if those zones get broken, then gives signals.
________________________________________
2. What is a Pivot?
A pivot high happens when the price makes a local peak — a bar is higher than the bars around it.
A pivot low happens when the price makes a local dip — a bar is lower than the bars around it.
These are natural turning points in the market, showing where buyers or sellers had strong control temporarily. Traders often use them to draw support (pivot lows) and resistance (pivot highs).
________________________________________
3. Why Use ATR for Zones?
ATR (Average True Range) measures the average volatility of a market. Instead of drawing just a flat line at the pivot, we create a zone above and below it, sized according to ATR.
Example:
• If ATR is 20 points and zone size is 0.5, then the zone extends 10 points above and below the pivot level.
This turns thin “lines” into thicker areas of interest. Real markets don’t respect razor-thin levels, but zones are more realistic.
________________________________________
4. How Support & Resistance Zones Work
• Resistance zones are created at pivot highs. They mark where sellers were strong before.
• Support zones are created at pivot lows. They mark where buyers were strong before.
Over time, these zones extend forward until the price interacts with them.
________________________________________
5. Breakout Detection
The indicator checks whether the price closes beyond the last pivot high or low:
• If price closes above the last pivot high, it means buyers have broken resistance.
• If price closes below the last pivot low, it means sellers have broken support.
These moments are significant because they often trigger trend continuation.
________________________________________
6. Parameters It Uses
1. Pivot Length – how many bars to look back and forward to confirm a pivot. A higher length makes pivots less frequent but stronger.
2. ATR Length and Multiplier – defines the size of the zones (wider zones in more volatile markets).
3. Max Zones to Keep – avoids clutter by keeping only the most recent zones.
4. Colors & Styling – helps traders visually separate bullish and bearish zones.
________________________________________
7. How It Helps Traders
• Visual clarity: Instead of guessing support and resistance, the chart automatically highlights them.
• Dynamic adjustment: Zones adapt to volatility using ATR, making them useful in both calm and volatile markets.
• Breakout signals: Traders get notified when price actually breaks key levels, instead of reacting late.
• Cleaner charts: Instead of dozens of hand-drawn lines, the tool manages zones for you, deleting old ones.
________________________________________
8. The Logic in One Sentence
It finds important swing highs and lows, turns them into support/resistance zones scaled by volatility, and alerts you when the market breaks through them.
________________________________________
👉 In practice, this helps traders spot where the market is likely to bounce or break, and gives a framework to plan trades — for example, buying on bullish breakouts or selling on bearish breakouts.
________________________________________