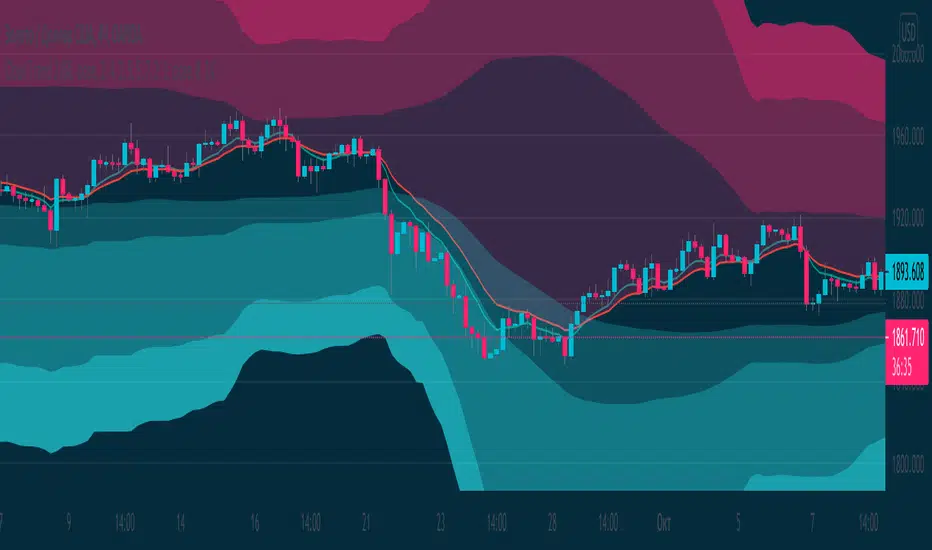
[AlbaTherium] MTF Volatility Edge Zones Premium for Price Action Volatility Edge Zones Premium for Price Action (HTF)
The MTF Volatility Edge Zones Premium for Price Action is an advanced Multiple Timeframes (MTF) trading indicator that combines the power of volume analysis with price action, designed to reveal key volatility zones and assess market participants’ engagement levels . This tool offers unique insights into the dynamics of higher timeframes (HTF), helping traders identify critical zones of decision-making, such as potential reversals, continuations, or breakout areas.
Introduction to the MTF Volatility Edge Zones Premium
This indicator is built upon a deep understanding of the interaction between price action and volume. By mapping volume data onto price action, Volatility Edge Zones Premium (HTF) pinpoints areas of heightened market engagement. These zones represent where buyers and sellers have shown significant activity, allowing traders to identify market intent and anticipate key movements.
Key Features:
Higher Timeframe Analysis: Focuses on significant price and volume interactions over HTFs (e.g., 4H, Daily, Weekly) for a broader perspective on market trends.
Volatility Zones : Highlights areas where market participants show increased activity, signaling potential market turning points or strong continuations.
Volume-Driven Insights: Tracks the behavior of aggressive buyers and sellers, showing their engagement levels relative to price changes.
Overlayon Price Action: Provides a clear and actionable visual representation of volatility and engagement zones directly on price charts.
Chapter 1: Understanding Volatility and Engagement
1.1 Volatility Edge Zones
Volatility Edge Zones are areas where price and volume interact to signal potential changes in market direction or momentum. These zones are derived from high-volume clusters where significant market activity occurs.
1.2 Participant Engagement
Market participants can be categorized based on their level of engagement in these zones:
Aggressive Buyers: Represented by sharp spikes in volume and upward price action.
Aggressive Sellers: Represented by high volume during downward price movement.
Passive Participants: Identified in zones of consolidation or low volatility.
By isolating these behaviors, traders can gain a clearer picture of market sentiment and the relative strength of buyers versus sellers.
Chapter 2: The Principle of Volume and Price Interplay
2.1 Volume as a Leading Indicator
Volume often precedes price movements, and the Volatility Edge Zones Premium captures this relationship by overlaying volume activity onto price charts. This allows traders to:
Identify where volume supports price movement (trend confirmation).
Spot divergences where price moves without volume support (potential reversals).
2.2 The Role of Higher Timeframes
HTFs filter out market noise, revealing macro trends and key levels of engagement. The indicator uses this perspective to highlight long-term volatility zones, helping traders align their strategies with the broader market context.
Chapter 3: Visualizing Volatility Edge Zones
3.1 Color-Coded Zones for Engagement
The indicator uses a color-coded system to represent volatility zones and market engagement levels. These colors correspond to different market conditions:
Red Zones: High selling pressure and aggressive bearish activity.
Blue Zones: High buying pressure and aggressive bullish activity.
Yellow Zones: Transitional zones, representing indecision or balance between buyers and sellers.
White Zones: Neutral areas, where low engagement is observed but could serve as potential breakout points.
3.2 Key Metrics Tracked
Volume Clusters: Areas of concentrated buying or selling activity.
Directional Bias: Net buying or selling dominance.
Momentum Shifts: Sudden changes in volume relative to price action.
These metrics provide actionable insights into market dynamics, making it easier to predict key movements.
Chapter 4: Practical Applications in Trading
4.1 Identifying High-Impact Zones
By focusing on HTFs, traders can use the Volatility Edge Zones Premium to identify high-impact areas where market participants are most engaged. These zones often align with:
Support and Resistance Levels: High-volume areas that act as barriers or catalysts for price movement.
Breakout Points: Zones of heightened volatility where price is likely to escape consolidation.
4.2 Detecting Bull and Bear Campaigns
The indicator highlights early signs of bullish or bearish campaigns by analyzing volume surges in critical volatility zones. These campaigns often signal the beginning of significant trends.
Chapter 5: Real-World Examples and Strategies
5.1 Spotting Market Reversals
Real-world examples demonstrate how the indicator can identify volatility zones signaling potential reversals, allowing traders to enter positions early.
5.2 Riding the Trend
By tracking volatility zones in alignment with HTF trends, traders can maximize profit potential by entering during periods of high engagement and riding the trend until it weakens.
Conclusion
The MTF Volatility Edge Zones Premium for Price Action is an essential tool for traders looking to master market dynamics through a combination of volume and price action analysis. By focusing on higher timeframes and overlaying volatility zones onto price charts, this indicator provides unparalleled insights into market participant engagement.
Whether you’re trading intraday, swing, or long-term strategies, the MTF Volatility Edge Zones Premium equips you with the information needed to make confident and precise trading decisions. Stay tuned as we continue to enhance this tool for even greater accuracy and usability.
"zone" için komut dosyalarını ara

Supply and Demand Zones
Script Introduction:
I have spent a long time searching for the perfect supply and demand zone indicator, but most of the ones I found were based on lines instead of proper zones, which didn’t quite meet my needs. After much trial and error, I decided to build my own indicator that generates clear and reliable supply and demand zones based on price swings and volatility. This indicator dynamically adjusts to market conditions, creating zones that are more responsive to price movements. Whether you're day trading or swing trading, this indicator will help you identify key price levels where buying and selling pressures exist.
Overview:
This indicator identifies supply and demand zones based on swing highs and lows, combined with market volatility. These zones represent areas where price is likely to experience reversals due to buying or selling pressures. The zones are displayed as rectangles (boxes) rather than lines, making it easier to visualize the areas of interest on the chart.
How the Indicator Works:
1. Supply Zones (Red Box):
- A supply zone is identified when the price forms a swing high (a local high point) and there is sufficient volatility (using ATR). The zone represents an area where sellers are likely to step in and push the price down.
2. Demand Zones (Green Box):
- A demand zone is identified when the price forms a swing low (a local low point) and volatility is sufficient. The zone represents an area where buyers are likely to step in and push the price up.
3. Extension Direction:
- You can control whether the zones extend to the left, to the right, or both directions. This lets you choose how far back or forward you want the zones to appear on the chart.
4. Volatility Filter (ATR Multiplier):
- The indicator uses the Average True Range (ATR) to filter out minor price movements. The ATR multiplier is hardcoded to 0.25, meaning that the indicator is more responsive to smaller price swings. This setting helps the zones adjust dynamically to changing market conditions.
How to Use the Indicator:
1. Adding to Chart:
- After publishing, you or invited users can apply the script to any chart. The indicator will automatically generate supply (red) and demand (green) zones.
2. Settings:
- Swing Length (Look-back Period): This controls how many bars back the script looks for significant swing highs and lows. Increasing this value will create zones based on larger swings.
- Extend Zone Horizontally (Bars): This controls how far the zones extend horizontally (left or right). You can adjust this to make the zones extend more or less on the chart.
- Extension Direction: Choose whether the zones extend to the left, right, or both directions. This gives flexibility on how you want the zones to display on the chart.
- Supply Zone Color: You can customize the color and opacity of the supply zone (default is red).
- Demand Zone Color: You can customize the color and opacity of the demand zone (default is green).
Best Practices for Trading:
- Combine with Other Indicators: While supply and demand zones are powerful on their own, combining this indicator with other tools like moving averages, volume analysis, or momentum indicators can provide further confirmation of potential price reversals.
- Watch for Price Action in Zones: When price approaches a supply or demand zone, watch for price action signals such as candlestick patterns (e.g., pin bars, engulfing candles) that can give you an idea of whether the zone will hold or break.
- Adjust for Different Timeframes: The indicator works well across different timeframes. Use a higher look-back period for larger timeframes (e.g., 4-hour, daily) and a lower look-back period for shorter timeframes (e.g., 5-minute, 15-minute charts).
Final Notes:
This script is intended to help traders identify key supply and demand zones and make better trading decisions. Since it dynamically adjusts to market volatility, it is well-suited for both day traders and swing traders who want to capture price reversals at significant levels.

Hidden Zone Detector AI - Crypto/Forex/StockHidden Zone Detector AI - Crypto Forex Stock
Hidden Zone Detector AI is a professional TradingView indicator designed to find hidden supply and demand zones across markets — crypto, forex and stocks — and surface high-probability areas earlier than classical pivot-only methods. It combines price structure analysis, volatility/ATR sizing, volume profiling and multi-mode AI heuristics (Fast / Balanced / Accurate) to generate prediction zones, highlight tested areas, and visually mark zone breakouts. Built with practical trader workflow in mind: configurable anti-repaint options, adaptable Light/Dark UI, clear labels, and candle-coloring for immediate visual context.
How it works
• Detects hidden zones by scanning pivot formations and finding internal “hidden” bars that represent real institutional activity (not just visible swing points).
• Scores zones by size (ATR-relative), volume, and touch characteristics to produce a strength percentage (Weak/Medium/Strong).
• AI heuristics aggregate price, momentum, moving averages, RSI/MACD signals and volume patterns to propose prediction zones — adjustable for speed vs. accuracy.
• Zones are drawn as persistent boxes with optional midlines, labels, and tailored styling when broken or tested.
Main advantages
• Early edge: finds hidden zones that often act before obvious pivots.
• Actionable visuals: labeled zones, color-coded candles, and breakout styling speed decision-making.
• Flexible AI modes: choose Fast for responsiveness, Balanced for day-to-day use, or Accurate for stricter signals.
• Anti-repaint controls: require confirmed bars for predictions to improve signal reliability.
• Multi-market ready: tuned for crypto, forex and stock chart behavior.
• Light/Dark friendly: UI color handling ensures labels remain readable on any chart background.
• Open & reusable: released under Mozilla Public License 2.0 (MPL-2.0) — use and adapt freely with attribution.
Best practices & tips
• Start with Balanced mode and sensitivity ~5; increase sensitivity for earlier but noisier predictions.
• Use prediction confirmation (Require AI Prediction Confirmation) for lower repaint risk.
• Combine zone reads with higher-timeframe context and orderflow/volume tools for stronger entries.
• Adjust max active zones and opacity to keep charts clean on lower timeframes.
License & author
Mozilla Public License 2.0 (MPL-2.0).
Author: a_jabbaroff — created with care for the TradingView community and fellow traders.

[RickAtw] ZONE Trend 3█ OVERVIEW
This indicator tracks current trends. Trends are determined by the zones created for them, the brighter the zone, the higher the probability of a market reversal.
█ FEATURES
The indicator adapts to any market.
You can set your own values for your system
Any timeframe can be used
You can increase the number of zones
█ HOW TO USE
If the market starts to enter the red zone, open buy and hold until the second or third zone.
If the market moves towards the blue zone, we sells and hold until the next zone.
█ The author of the work
Rick Atwood
Volume Reinforced Supply/Demand Zoneswhen trading supply and demand i found a way to see which zones are high quality zones. this indicator tries to do that for you. its not nearly as good as doing it manually, but its pretty decent. feel free to fine tune the settings and see which works best for you.
the indicator uses volume and price movement to draw supply and demand zones. if the zone is tested, it will change color to let you know, so you can decide whether or not to use the zone.
if a zone is broken, it will display a signal which tells you which candle broke through the zone.
you can change in the settings the requirements for an area to be considered a zone.

able zone# able zone
## 📋 Overview
**able zone** is an advanced Support & Resistance zone detection indicator optimized for **15-minute timeframe trading**. It combines Price Action, Volume Profile, and intelligent zone analysis to identify high-probability trading areas with precise entry and exit points.
## 🎯 Core Features
### 1. **Zone Detection Methods**
- **Auto Detect**: Automatically finds the best zones using combined analysis
- **Price Action**: Based on pivot points and price structure
- **Volume Profile**: Identifies High Volume Nodes (HVN) where most trading occurred
- **Combined**: Uses all methods together for comprehensive analysis
### 2. **Zone Types & Colors**
- 🟢 **Support Zones** (Green): Price tends to bounce up from these areas
- 🔴 **Resistance Zones** (Red): Price tends to reverse down from these areas
- 🟣 **HVN Zones** (Purple): High volume areas from Volume Profile
- **Strong Zones**: Darker colors indicate zones with more touches (higher reliability)
### 3. **Zone Strength Indicators**
- **Labels**: "S3" = Support with 3 touches, "R5" = Resistance with 5 touches
- **Touch Count**: More touches = stronger zone
- **Min Touch Count Setting**: Adjust to filter weak zones (default: 3)
## ⚙️ Settings Guide
### **Zone Detection Settings**
- **Detection Method**: Choose your preferred analysis method
- **Lookback Period** (50-500): How many bars to analyze (default: 200)
- For 15min: 200 bars = ~50 hours of data
- Shorter = Recent zones only
- Longer = Historical zones included
- **Min Touch Count** (2-10): Minimum touches to qualify as a zone (default: 3)
- **Zone Thickness %** (0.1-2.0): How thick the zones appear (default: 0.5)
- Based on ATR for dynamic sizing on 15min chart
### **Zone Colors**
Fully customizable colors for:
- Support Zone (default: Green)
- Resistance Zone (default: Red)
- Strong Support/Resistance (darker shades)
- Volume Profile Zone (default: Purple)
### **Zone Touch Detection**
- **Enable Touch Alerts**: Get notifications when price enters zones
- **Touch Distance %** (0.1-1.0): How close to zone counts as "touch" (default: 0.3%)
- On 15min chart, this gives early warning signals
- **Show Touch Markers**: Visual indicators when price touches zones
- 🔺 = Support touch (potential buy)
- 🔻 = Resistance touch (potential sell)
- 💎 = HVN touch (watch for breakout/rejection)
### **Volume Profile Integration**
- **Show VP Zones**: Display high volume node zones
- **VP Resolution** (20-50): Number of price levels analyzed (default: 30)
- **POC Line** (orange): Point of Control - highest volume price level
- **POC Width**: Line thickness (1-3)
- **Show HVN**: Display High Volume Node zones
- **HVN Threshold** (0.5-0.9): Volume % to qualify as HVN (default: 0.7)
### **Display Options**
- **Zone Labels**: Show S/R labels with touch count
- **Zone Border Lines**: Dotted lines at zone boundaries
- **Extend Zones Right**: Project zones into future
- **Max Visible Zones** (5-50): Maximum number of zones displayed (default: 20)
- Adjust based on chart clarity needs
- **Info Table**: Real-time information dashboard
## 📊 Info Table Explained
The info table (top-right corner) provides real-time zone analysis:
### **Row 1: ZONE Header**
- Shows current timeframe (15m)
- Total active zones
- "able" branding
### **Row 2: 🎯 TOUCH Status**
- **RES**: Currently touching resistance (⚠️ potential reversal down)
- **SUP**: Currently touching support (🚀 potential bounce up)
- **HVN**: Currently in high volume area (⚡ watch for direction)
- **FREE**: Not near any zone (⏳ wait for setup)
- Progress bar shows proximity strength
- Arrows indicate zone type
### **Row 3: 🟢 SUP - Support Zones**
- Number of active support zones below current price
- Progress bar shows relative quantity
- More support = stronger floor
### **Row 4: 🔴 RES - Resistance Zones**
- Number of active resistance zones above current price
- Progress bar shows relative quantity
- More resistance = stronger ceiling
### **Row 5: 🟣 HVN - High Volume Nodes**
- Number of HVN zones (from Volume Profile)
- These are areas where most trading activity occurred
- Often act as magnets for price
### **Row 6: 📍 NEAR - Nearest Zone**
- Shows closest zone type (SUP/RES/HVN)
- Distance in % to nearest zone
- Arrow shows if zone is above or below
### **Row 7: POSITION - Price Position**
- **HIGH**: Price near range top (70%+) - watch for resistance
- **MID**: Price in middle range (30-70%) - neutral zone
- **LOW**: Price near range bottom (<30%) - watch for support
- Shows exact position % in lookback range
### **Row 8: ═ SIGNAL ═**
- **🚀 BUY**: Touching support zone (entry opportunity)
- **⚠️ SELL**: Touching resistance zone (exit/short opportunity)
- **⚡ WATCH**: At HVN (prepare for breakout or rejection)
- **⏳ WAIT**: No clear setup (be patient)
## 🎓 Trading Strategy for 15-Minute Timeframe
### **Basic Setup**
1. Set timeframe to **15 minutes**
2. Use **Auto Detect** or **Combined** method
3. Set **Lookback Period**: 200 bars (~50 hours)
4. Set **Min Touch Count**: 3 (proven zones)
### **Entry Signals**
#### **Long Entry (Buy)**
- Price touches green support zone
- Table shows "🚀 BUY" signal
- Look for bullish candle pattern (hammer, engulfing)
- Volume increases on bounce
- **Best Entry**: Bottom of support zone
- **Stop Loss**: Below support zone (1-2 ATR)
- **Target**: Next resistance zone or 2:1 RR
#### **Short Entry (Sell)**
- Price touches red resistance zone
- Table shows "⚠️ SELL" signal
- Look for bearish candle pattern (shooting star, engulfing)
- Volume increases on rejection
- **Best Entry**: Top of resistance zone
- **Stop Loss**: Above resistance zone (1-2 ATR)
- **Target**: Next support zone or 2:1 RR
#### **HVN Breakout Strategy**
- Price approaches purple HVN zone
- Table shows "⚡ WATCH"
- Wait for breakout with strong volume
- **If breaks up**: Go long, target next resistance
- **If breaks down**: Go short, target next support
### **Zone Strength Rules**
- **S5+ or R5+**: Very strong zones (high probability)
- **S3-S4 or R3-R4**: Reliable zones (good setups)
- **S2 or R2**: Weak zones (use caution)
### **Best Trading Times (15min)**
- **London Open**: 08:00-12:00 GMT (high volume)
- **NY Open**: 13:00-17:00 GMT (high volatility)
- **Overlap**: 13:00-16:00 GMT (best setups)
- **Avoid**: Asian session low volatility periods
### **Risk Management**
- Never risk more than 1-2% per trade
- Use stop loss ALWAYS (place outside zones)
- Take partial profits at 1:1, let rest run to 2:1 or 3:1
- If price consolidates in zone > 3 candles, exit
## ⚠️ Important Notes
### **When Zones Work Best**
✅ Clear trending markets
✅ After significant price movements
✅ At session opens (London/NY)
✅ When multiple zones align
✅ Strong zone with 5+ touches
### **When to Be Cautious**
❌ During major news releases (use economic calendar)
❌ Very low volume periods
❌ Price consolidating inside zone
❌ Weak zones with only 2 touches
❌ Conflicting signals from multiple indicators
### **15-Minute Specific Tips**
- **Lookback 200**: Captures 2-3 trading days of zones
- **Touch Distance 0.3%**: Early signals on 15min moves
- **Max Zones 20**: Keeps chart clean but comprehensive
- **Watch POC**: Often acts as pivot on 15min
- **Volume spike + zone touch** = high probability setup
## 🔧 Recommended Settings for 15min
### **Conservative Trader**
- Detection Method: Combined
- Min Touch Count: 4
- Max Zones: 15
- Touch Distance: 0.2%
### **Aggressive Trader**
- Detection Method: Auto Detect
- Min Touch Count: 2
- Max Zones: 25
- Touch Distance: 0.5%
### **Volume Profile Focused**
- Detection Method: Volume Profile
- Show HVN: Yes
- HVN Threshold: 0.6
- Show POC: Yes
## 📈 Example Trade Scenario (15min)
**Setup**: BTC/USD on 15-minute chart
1. Price approaching green support zone at $42,000
2. Zone label shows "S4" (touched 4 times)
3. Table shows "🚀 BUY" signal
4. Volume increasing on approach
5. Bullish hammer candle forms
**Entry**: $42,050 (bottom of zone)
**Stop Loss**: $41,900 (below zone)
**Target 1**: $42,350 (2:1 RR)
**Target 2**: Next resistance at $42,650
**Result**: Price bounces, hits Target 1 in 3 candles (~45min)
## 💡 Pro Tips
1. **Combine with trend**: Trade in direction of higher timeframe trend
2. **Multiple touches**: Zones with 5+ touches are highest probability
3. **Volume confirmation**: Always check volume on zone touch
4. **POC magnet**: Price often returns to POC line
5. **False breakouts**: If price barely breaks zone and returns = strong signal
6. **Zone-to-zone**: Trade from support to resistance, resistance to support
7. **Time of day**: Best setups occur during peak volume hours
8. **Chart timeframe**: Use 1H to confirm trend, 15min for entry
9. **News avoidance**: Close trades before high-impact news
10. **Zone clusters**: Multiple zones together = strong area
---
**Created by able** | Optimized for 15-minute trading
**Version**: 1.0 | Compatible with TradingView Pine Script v5
For support and updates, enable alerts and monitor the info table in real-time!

3CRGANG - SUPPLY/DEMAND ZONESOverview
The "3CRGANG - SUPPLY/DEMAND ZONES" indicator is a sophisticated tool designed to identify, classify, and visualize dynamic supply (resistance) and demand (support) zones on your TradingView charts. It goes beyond basic level plotting by incorporating a state-based system that tracks how zones evolve based on price interactions, helping traders anticipate potential reversals, continuations, or breakdowns at key levels. Zones are categorized into states like Untested, Verified, Weak, Flipped, and Broken, providing contextual insights into their strength and reliability. This indicator is particularly useful for swing traders, scalpers, and position traders who rely on price action around institutional levels, as it filters noise and highlights actionable zones with customizable alerts and visual aids.
Built on Pine Script v6, it overlays directly on your chart with semi-transparent boxes for zones, optional labels for quick reference, and alert triggers for zone tests. The invite-only access ensures users benefit from its proprietary enhancements, making it a premium alternative to generic zone indicators.
How It's Built: Core Concepts and Calculations
At its foundation, the indicator detects potential supply and demand zones using a fractal-based pivot detection method, which identifies local highs and lows by comparing a central bar's price to surrounding bars within a validation window. This window is dynamically adjusted via a "Fractal Sensitivity Factor" (default 6.0), which scales the lookback period relative to your chart's timeframe—ensuring zones adapt to market volatility without over- or under-fitting. For example, on a 15-minute chart, this might equate to checking 18-24 bars around a candidate pivot for confirmation.
Once a fractal pivot is confirmed:
Zone Boundaries: The zone is constructed around the pivot high/low, extended by a fraction of the Average True Range (ATR, period 7) using the "Zone Boundary ATR Multiplier" (default 0.3). This creates a band that accounts for typical price fluctuations, preventing overly tight or loose zones. A subtle "Zone Fuzz Factor" (default 0.15) adds a minor buffer to the ATR-derived extension, allowing for fine-tuning in choppy markets without altering the core range.
Merging Overlaps: To avoid clutter, overlapping zones of the same type (or flipped counterparts) are intelligently merged through up to 2-3 passes (configurable via "Max Merge Passes"). This consolidation increases the "test count" for the resulting zone, reflecting cumulative price rejections and enhancing its perceived strength.
Zone Testing and Classification: Price interactions with zones are evaluated using one of two methods:
Dynamic - Bars: Counts tests when price wicks into the zone from outside or closes out after entering, with a minimum gap (0-2 bars) to prevent rapid-fire counts in ranging markets.
Mechanical - Pivots: Enhances the dynamic method by requiring a mechanical pivot (e.g., via TradingView's built-in pivothigh/pivotlow) within the zone during the test, adding a layer of confirmation for more conservative signals. Tests are tallied with a "Weak Zone Test Threshold" (default 1), classifying zones as:
Untested: No interactions yet—fresh levels with high potential.
Weak: 1 or fewer meaningful tests—early signals that may fade.
Verified: Multiple tests (above threshold)—strong, repeatedly respected levels.
Flipped: A broken zone that reverses role (e.g., resistance becomes support), based on a decisive close beyond the boundary.
Broken: Permanently invalidated by a strong breakout, optionally displayed for historical context.
Time and Session Integration: Zones are timestamped and limited to a "Back Limit" (default 500 bars) for performance. It incorporates a custom holiday library (importing from RotemB's LIBRARY_3CRGANG_Holidays_Library) to detect closures across major exchanges (NYSE, LSE, FSE, SSX, TSE, HKSE), adjusting session times for half-days and full holidays. Alerts are filtered by user-selected sessions, weekends, and a "Do Not Disturb" (DND) mode with timezone-aware scheduling (e.g., UTC+3 Jerusalem default, selectable from 90+ global options).
This combination of fractal detection, ATR-based sizing, multi-pass merging, and test-driven state evolution draws from classic supply/demand principles but refines them with proprietary logic to handle real-world market dynamics, such as volatility clustering and institutional session biases.
Why It’s Useful
Supply and demand zones are foundational to price action trading, representing areas where large orders accumulate and cause reversals or pauses. This indicator streamlines the process by automating zone discovery and maintenance, saving time compared to manual drawing. Its state system adds predictive value: Verified zones often signal high-probability bounces, while Flipped ones highlight role reversals for trend continuation trades. Alerts notify you of tests in real-time, ideal for multi-chart monitoring, and session/holiday filters reduce false signals during low-liquidity periods (e.g., no alerts on Christmas for NYSE-linked assets).
Traders benefit from reduced emotional bias—zones "age out" beyond the back limit, focusing on recent action—and customizable visuals prevent chart overload. In volatile markets like forex or crypto, the ATR-adjusted boundaries adapt better than fixed-percentage methods, while the test count helps gauge exhaustion (e.g., over-tested Weak zones may signal impending breaks). Overall, it enhances decision-making by providing not just levels, but their evolving context.
How to Use It
Add to Chart:
Search for "3CRGANG - SUPPLY/DEMAND ZONES" in TradingView's invite-only scripts (access required). Apply to any timeframe from 1-minute to yearly, though it shines on intraday (15M-4H) for active trading.
Configure Inputs:
Test Mode: Choose "Dynamic - Bars" for sensitive, wick-focused testing or "Mechanical - Pivots" for stricter, pivot-confirmed interactions. Adjust "Minimum Test Gap" (0-2) to filter rapid tests and "Weak Zone Test Threshold" (1-3) to define strength tiers.
Pivot Filters: Tune "Fractal Sensitivity Factor" (5-14) for fewer/more zones—higher values for smoother trends, lower for chop.
Zone Width: Set "Zone Boundary ATR Multiplier" (0-1) for tighter/wider bands; use "Zone Fuzz Factor" (0-1) sparingly for boundary tweaks.
Visual: Select zone style (Solid/Dashed/Dotted), linewidth (1-3), and horizontal extension (None/Right/Both). Toggle visibility per state (e.g., hide Broken for cleaner charts).
Labels: Enable "Show Labels" for state/type info; add "Show Zone Size" (in pips/$) and "Show Test Count" for details. Adjust shift for positioning.
Alerts: Enable per state (Untested/Weak/Verified/Flipped). Filter by sessions (e.g., enable NYSE for US equities), holidays, weekends, and DND (set time ranges in your timezone to mute notifications).
Colors: Customize per state/type for intuitive visuals (e.g., red shades for resistance).
Trading Application:
Entries: Buy at Verified Demand (green) tests, sell at Verified Supply (red). Use Flipped zones for breakout confirmation.
Exits/Risk: Place stops beyond zone boundaries; trail profits on Weak/Flipped signals indicating fading strength.
Alerts Setup: In TradingView's alert dialog, select this indicator and configure for "alert() function calls only" to receive zone-test notifications.
Multi-Timeframe: View higher-TF zones on lower charts for confluence (e.g., daily zones on 1H).
Best Practices: Combine with volume or oscillators; backtest on your asset to optimize sensitivity.
Chart Example: XAG/USD (m5 timeframe)
Chart Notes
The chart displays zones on XAGUSD (M5 timeframe), presenting a clear price action structure with three distinct zones. A green Verified Support zone, marked with a translucent green box, indicates a robust demand level that has been tested multiple times and held firm. A blue Weak Support zone, outlined with a lighter blue box, reflects a less-tested support level with fewer rejections, suggesting lower reliability. A gold Flipped Resistance zone, highlighted with a golden box, initially acted as a resistance with rejections before breaking through and retesting as a support zone, showcasing its transition. Labels appear to the right of each zone, displaying details such as "VERIFIED SUPPORT (6.72 points, T=3)" for the Verified zone, "WEAK SUPPORT (6.9 points, T=1)" for the Weak zone, and "FLIPPED SUPPORT (3.85 points, T=10)" for the Flipped zone, with sizes in dollars (or pips if under $1) and test counts included. Zones extend horizontally to the right based on the user-defined shift setting, with customizable dashed or dotted borders for enhanced visual clarity.
Requires 500 bars of history for optimal performance. Alerts are muted during holidays (e.g., Lunar New Year) or Do Not Disturb periods.
Settings
Test Mode: Choose method (Dynamic - Bars or Mechanical - Pivots), set minimum test gap (0-2 bars), and weak zone threshold (1-3 tests).
General: Adjust back limit (250-1000 bars).
Pivot Filters: Set fractal sensitivity factor (5-14) and max merge passes (1-3).
Zone Width: Define ATR multiplier (0-1) and fuzz factor (0-1).
Visual: Select zone style (Solid, Dashed, Dotted), line width (1-3), shift end right (1-50 bars), and extension (None, Right, Both).
Visibility: Toggle display for each state (Untested, Verified, Weak, Flipped, Broken).
Labels: Enable labels, set shift (1-50 bars), size, and show size/test counts.
Alerts: Enable alerts by state (Untested, Weak, Verified, Flipped).
DND Settings: Set timezone, Do Not Disturb hours, and weekend alerts.
Sessions Alerts: Filter alerts by exchange (NYSE, LSE, etc.) and holiday settings.
Colors: Assign colors to each zone state and type.
Why It's Unique and Worth Invite-Only Access
While supply/demand indicators exist, this one stands out through its integrated ecosystem: adaptive fractal pivots with sensitivity scaling, multi-pass overlap merging that preserves test history, and a nuanced state machine that evolves zones based on configurable test mechanics—far beyond simple high/low plotting or basic breakouts. The proprietary blending of ATR fuzzing, retroactive test validation during zone creation, and global exchange holiday/session filtering (with half-day adjustments) minimizes irrelevant alerts, a common pain point in public scripts. It doesn't rely solely on built-ins or educational code; instead, it enhances them with custom logic for zone lifecycle management, making it resilient across assets and timeframes.
This originality justifies its closed-source nature—revealing the full interplay of fractal windowing, merge algorithms, and alert conditioning could dilute its edge. As an invite-only script, it provides clear value through premium features like timezone-aware DND, comprehensive holiday integration (e.g., Lunar New Year for HKSE), and state-aware alerts, which aren't replicated in free alternatives. Traders seeking an efficient, low-noise tool for institutional-level analysis will find it worth the access, as it delivers actionable insights that generic indicators overlook.
Disclaimer
This indicator assists in zone identification but does not guarantee success. Trading involves risk, and past performance is not indicative of future results. Always use proper risk management.

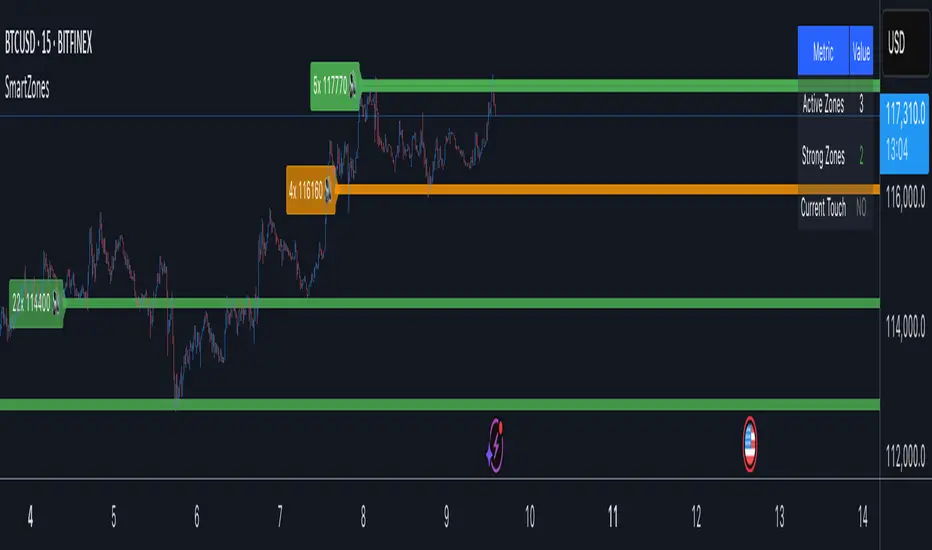
Smart Zone Detector by Mihkel00Advanced support/resistance indicator with dynamic zones and volume confirmation.
Smart Zone Detector automatically identifies key support and resistance zones using pivot points with following features:
Dynamic ATR-based zones that adapt to market volatility
Volume confirmation to filter out weak levels
Touch counting with strength classification (3x, 8x, 13x+ touches)
What You Get
Active Zones: Current qualified S/R levels (3+ touches)
Strong Zones: High-confidence areas with multiple confirmations
Color-coded zone strength (Green=Strong, Orange=Medium, Red=Weak)
Touch count labels showing zone significance
How to Use
Zone Identification: Look for zones with 3+ touches - these are qualified levels
Strength Assessment: Higher touch counts (8x, 13x+) = stronger zones
Volume Confirmation: volume-backed zones (more reliable)
Zone Interactions: Green/red X-crosses show real-time support/resistance tests
Dynamic Sizing: Zones automatically adjust width based on ATR
Settings
Lookback: How far back to scan for pivots (default: 100 bars)
Min Touches: Qualification threshold (default: 3 touches)
Volume Confirmation: Enable for higher-quality zones
Zone Tolerance: Sensitivity for merging nearby levels
Reversal Probability Zone & Levels [LuxAlgo]The Reversal Probability Zone & Levels tool allows traders to identify a zone starting from the last detected reversal to highlight the probability of where the next reversal would be from a price and time perspective.
Price and time levels within the zone are displayed for up to 4 percentiles defined by the user.
🔶 USAGE
By default, the tool displays a zone with the 25th, 50th, 75th and 90th percentiles on both the price and time axis, indicating where, when and how many of the past reversals have occurred.
Traders can select the length for swing detection and the maximum number of reversals for probability calculations. The tool considers both bullish and bearish reversals separately, which means that if the last reversal was a swing high, the zone would show the probabilities for the last defined Maximum reversals
The Maximum reversals value has a direct impact on the probabilities, the more data traders use the more significant the result, probabilities over 10 occurrences are far weak compared to probabilities over 1000 occurrences.
🔹 Percentiles
Traders can fine-tune the percentile parameters in the settings panel.
A given percentile means that the number of occurrences in the data set is less than or equal to the percentile.
In English, this means
Percentile 20th: 20% of the occurrences are less than or equal to this value, so 80% of the occurrences are greater than this value.
Percentile 50th: 50% of the occurrences are below and 50% are above this value.
Percentile 80th: 80% of occurrences are lower than or equal to this value, so 20% of occurrences are greater than this value.
🔹 Normalize data
The Normalize Data feature allows traders to make an apples to apples comparison when we have a lot of historical data on high timeframe charts, using returns between swings instead of raw price.
🔹 Display Style
By default, the tool has the No overlapping feature enabled to display a clean chart, traders can turn it off, but this can fill the chart with too much information and barely see the price.
Traders can enable/disable settings to show only the last zone and the swing markers on the chart.
🔶 SETTINGS
Swing Length: The maximum length in bars used to identify a swing
Maximum Reversals: Maximum number of reversals included in calculations
Normalize Data: Use returns between swings instead of raw price
Percentiles: Enable/disable each of the four percentiles and select the percentile number, line style, colors, and size
🔹 Style
No Overlapping Zones: Enable or disable the No overlap between zones feature
Show Only Last Zone: Enable/disable display of last zone only
Show Marks: Enable/disable reversal markers

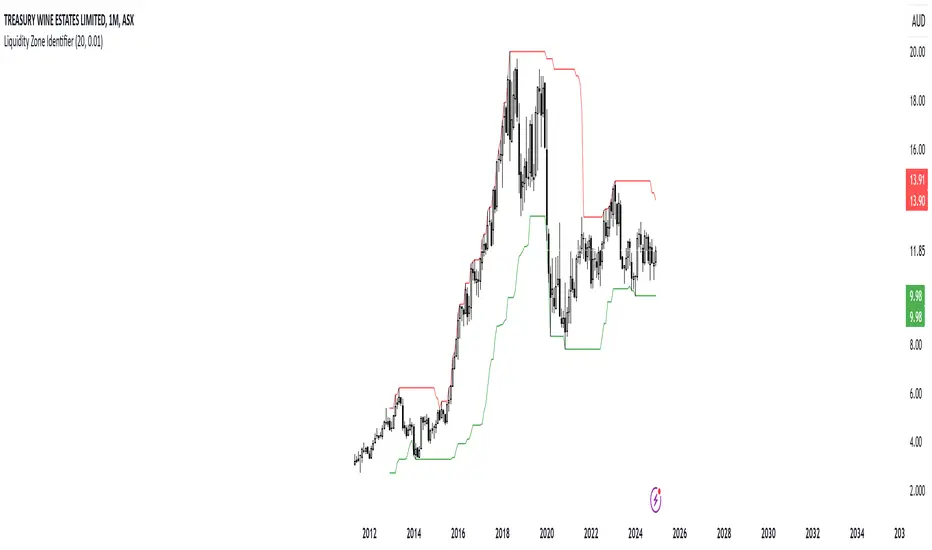
RShar Liquidity Zone Identifier Description of the Liquidity Zone Identifier Indicator
The **Liquidity Zone Identifier** is a TradingView indicator designed to highlight key liquidity zones on a price chart. Liquidity zones represent areas where the price is likely to encounter significant resistance or support, making them critical for technical analysis and trading decisions.
Key Features:
1. **Dynamic Resistance and Support Levels**:
- The indicator calculates the highest high and lowest low over a user-defined period (`length`) to identify potential resistance and support levels.
- Sensitivity can be adjusted using the `zoneSensitivity` parameter, which defines a percentage buffer around these levels to expand the zones.
2. **Visual Representation**:
- Resistance zones are highlighted in **red**, indicating areas where the price may face selling pressure.
- Support zones are highlighted in **green**, representing areas where the price may find buying interest.
- The zones are displayed as shaded regions using the `fill` function, making them visually distinct and easy to interpret.
3. **Customizable Inputs**:
- **Zone Length** (`length`): Determines the number of candles considered for calculating highs and lows.
- **Zone Sensitivity** (`zoneSensitivity`): Sets the percentage margin around the calculated levels to define the liquidity zones.
- **Zone Colors**: Users can customize the colors for resistance and support zones to suit their preferences.
- **Toggle Fill**: The `showFill` option allows users to enable or disable shaded zone visualization.
4. **Alerts for Trading Opportunities**:
- Alerts are triggered when:
- The price enters the **resistance zone** (current high is greater than or equal to the resistance zone).
- The price enters the **support zone** (current low is less than or equal to the support zone).
- These alerts help traders stay informed of critical market movements without constantly monitoring the chart.
#### How It Works:
1. **Calculation of Zones**:
- The highest high and lowest low over the specified `length` are calculated to define the primary levels.
- A buffer zone is added around these levels based on the `zoneSensitivity` percentage, creating a margin of interaction for price movements.
2. **Plotting the Zones**:
- The top and bottom boundaries of the resistance and support zones are plotted as lines.
- The area between these boundaries is shaded using the `fill` function to enhance visualization.
3. **Alerts for Key Events**:
- Traders are notified when price action interacts with the zones, enabling quick decision-making.
#### Use Case:
The Liquidity Zone Identifier is ideal for:
- Identifying areas of potential price reversal or consolidation.
- Spotting high-probability trading setups near resistance and support zones.
- Complementing other technical indicators in a trading strategy.
By effectively highlighting critical price levels, this indicator provides traders with a powerful tool to navigate the markets with greater precision.
Perfect zonesAs the name says this script will be perfect.
There are 2 types of indicators in the market. Leading and Lagging.
I always prefer to choose a leading which can help me determine my trades future hand.
This script provides few levels which are not just leading but also perfect. This script can be used only on the current day/week/month and can't be used to predict the next sessions movement as this script uses current open price.
Open line - Line drawn based on the open of the candle. I feel this is one of the underrated line. This is a very powerful resistance and support line.
Average 10 days levels - These are just calculated based on average 10 previous days.
Logic is - since the script has stayed within the range for past 10 days it remains to stay in the same levels even today.
So on average this levels works 8/10 times which is very bigger in stock market.
Fibonnaci levels zones - This zone is derived from Thomas de-mark book. This is also a simple level where fibonnaci ratio is used to determine the levels from today's open.
Outer levels - They are also same fibonacci levels which are very much respected by all the stocks and indices.
Provided adjustment levels to determine the range for Day/Week/Month.
Added some code from one of my favorite indicator variable moving average. Thanks to the author of the script.
How to trade using this script.
Apply 10 days average and Fibonacci level zones in the chart
Range bound movement
When the stock open. Try to predict from price action whether the stock is going to be in a small range. Then do a strangle of the strikes just outside the zone.
Trending movement
When the stock seems to be little volatile both the levels applied act a good resistance. Take positions once the range in broken or reversal is happening from the level.
This script is unique because these are not drawn levels based on previous day unlike pivot or Fibonacci, current day open is important in this script.
tip - Use it in banknifty and Nifty with Range bound strategy I have mentioned above.
Happy trading.

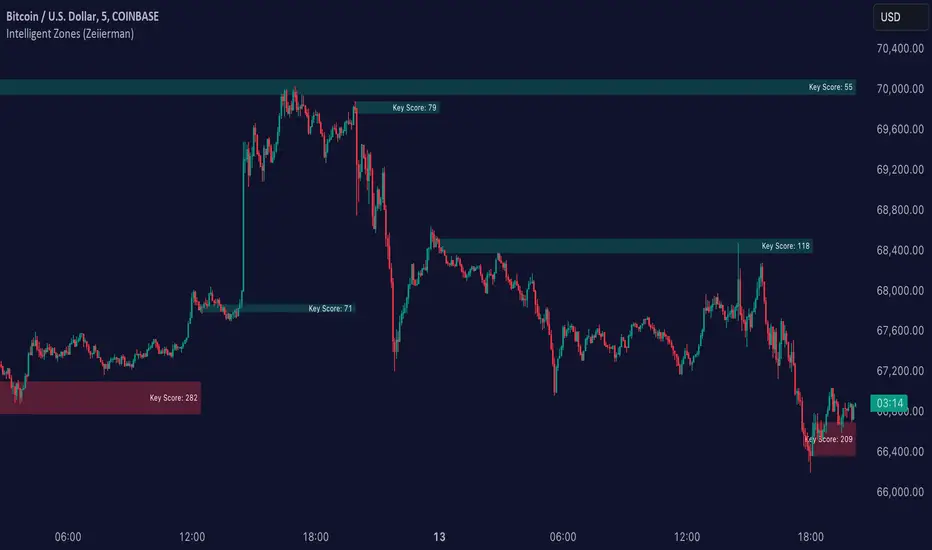
Intelligent Zones (Expo)Intelligent Zones - (Expo)
DESCRIPTION
Intelligent zones is a real-time based indicator that creates colored zones that can act as support or resistance levels. These zones that are painted on the graph are important levels that the future price will react too.
Generally, strategy:
--> If the price crosses up from the cloud it can be considered as a positive “breakout” and the price will most probably continue in that direction.
--> If the price crosses down from the cloud it can be considered as negative “breakout” and the price will most probably continue in that direction.
--> If the price is above the black line it can be considered as positive sentiment, and if the price is below the black line it can be considered as a negative sentiment.
--> The indicator comes in 2 versions. The main difference is how the intelligent cloud is calculated. Sensitive or not.
HOW TO USE
1. Use the indicator to identify real-time market zones.
2. Use the indicator to visualize breakouts.
INDICATOR IN ACTION
The indicator is best presented live, the graphs below are a good guide.
EURUSD
BTCUSD
BRENT
I hope you find this indicator useful , and please comment or contact me if you like the script or have any questions/suggestions for future improvements. Thanks!
I will continue to work on this indicator, so please share your experience and feedback with me so that I can continuously improve it. Thanks to everyone that have contacted me regarding my scripts. Your feedback is valuable for future developments!
ACCESS THE INDICATOR
• Contact me on TradingView or use the links below
-----------------
Disclaimer
Copyright by Zeiierman.
The information contained in my scripts/indicators/ideas does not constitute financial advice or a solicitation to buy or sell any securities of any type. I will not accept liability for any loss or damage, including without limitation any loss of profit, which may arise directly or indirectly from use of or reliance on such information.
All investments involve risk, and the past performance of a security, industry, sector, market, financial product, trading strategy, or individual’s trading does not guarantee future results or returns. Investors are fully responsible for any investment decisions they make. Such decisions should be based solely on an evaluation of their financial circumstances, investment objectives, risk tolerance, and liquidity needs.
My scripts/indicators/ideas are only for educational purposes!
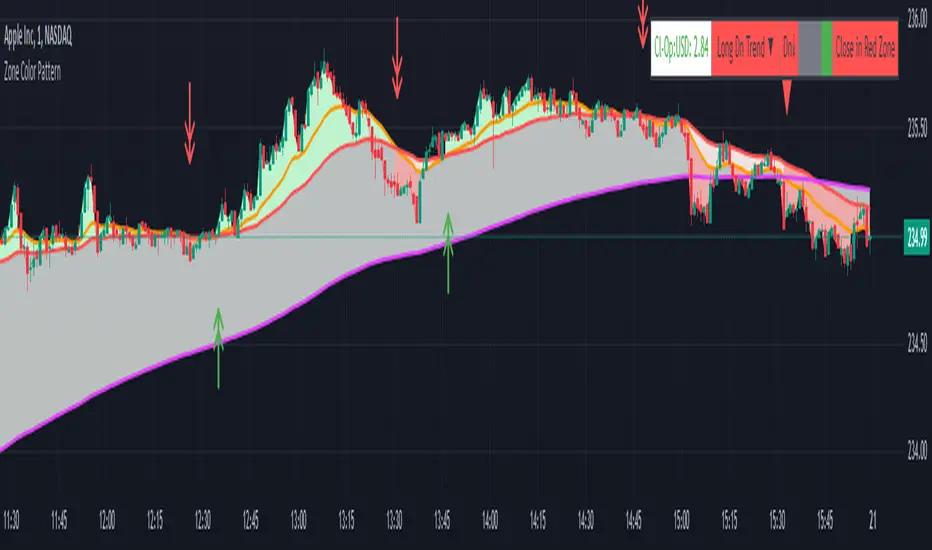
Zone Color PatternZone Color Pattern indicator depicts the color pattern of zones on chart. This will help the user to identify the zones on Chart.
Green Zone is indicated by Green color.
Red Zone is indicated by Red Color.
Gray Zone is indicated by Gray Zone.
Zone Color Pattern indicator is based on 3 moving averages. Long term, Medium term and Short Term.By default they are 200, 50 and 20.
When you are on long term trend the position of MAs is 20 MA is on top,then comes 50 MA and 200 MA is positioned below 50 MA.The position of respective MAs change during down trend.
The color patterns display the distance between different MAs .The widening and contraction of space between different Moving Averages indicate the movement and direction of price.
Basically price tend to move in and move away from Average. This action tend to create a space between price and MAs.Color patterns between price and MAs reflect the gap between the price and M|As .All these effects can be visualized on chart in relevant colors to infer the status of price, movement, cross over by the User.
Buy trades are preferred when close is in Green Zone and price is above MA20.
Sell trades are preferred when close is in Red Zone and price is below MA20
Trades may be avoided when close is in Gray Zone.
Long Up Trend and Down Trend respective color triangle shapes and arrows on chart indicate the trends and direction.
The chart understanding has to be supplemented with other regular indicators along with appropriate risk reward techniques by user.
Table indicate difference between Last Price traded and Day open price.
Other columns in table display the position of close in different Zones.
DISCLAIMER: For educational and entertainment purpose only .Nothing in this content should be interpreted as financial advice or a recommendation to buy or sell any sort of security/ies or investment/s.
Zone Marker ProZone Marker Pro – Advanced Market Zone Identification Tool
This indicator applies a dynamic price zone detection model built on custom logic, inspired by trend-following methodologies. It helps traders visualize market structure through zone detection and price retest markers.
🔹 Key Features:
✅ Identifies key price zones – Automatically detects significant areas where price reactions may occur.
✅ Dynamic Zone Adaptation – Adjusts to price changes, improving visibility of market conditions.
✅ Clear visualization of market zones – Highlights price areas for enhanced analysis.
✅ Custom alerts for market zone tracking – Set notifications when price reaches relevant levels.
✅ Supports market zone analysis across different timeframes.
📌 How to Use Zone Marker Pro?
1️⃣ Add the indicator to your chart – It will automatically highlight important price zones.
2️⃣ Observe visual markers – Blue and purple labels indicate key market reaction areas.
3️⃣ Utilize built-in alerts – Receive updates when price enters important zones.
4️⃣ Monitor multi-timeframe data – The table in the top right provides an overview of detected market zones.
🚀 Why Use Zone Marker Pro?
🔹 Helps identify important price levels without manual zone drawing.
🔹 Adjusts dynamically to price structure and volatility.
🔹 Useful for traders who want to track market zone formations.
🔹 Designed to enhance market zone identification and should be used alongside other analysis methods.
💡 This indicator does not generate trading signals but serves as a market analysis tool for identifying dynamic price zones.
✅ Additional Notes:
This indicator uses a custom methodology to identify key price zones.
Designed for traders who seek a clearer market overview and faster reaction to price movements.
🛠 Recommended for: Forex, cryptocurrencies, stocks, indices.
📢 Enable alerts and optimize your market analysis with Zone Marker Pro! 🚀

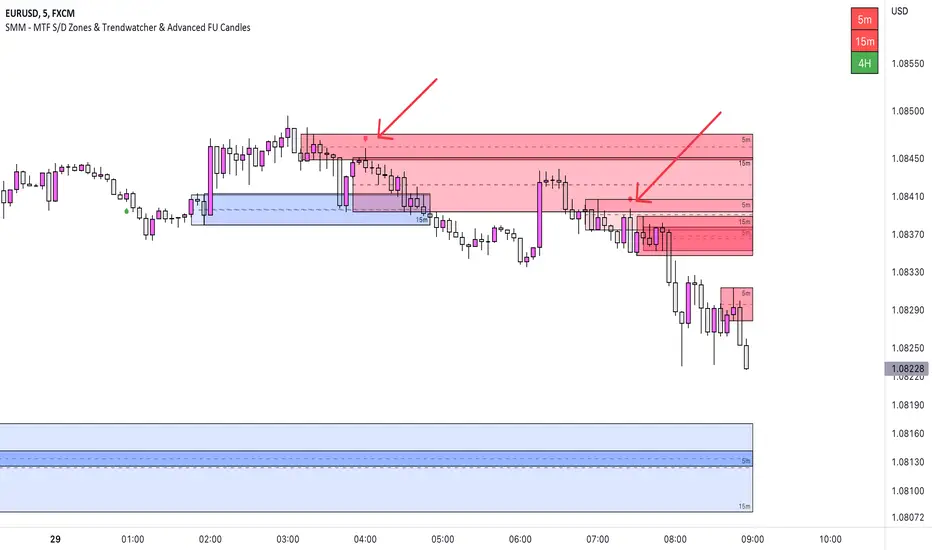
SMM - MTF S/D Zones & TrendwatcherHello Traders,
Introducing the SMM - MTF S/D Zones & Trendwatcher, a powerful tool designed to make your trading easier and eliminate guesswork. Our goal is to save you time by automatically marking up the chart with key points of interest.
Our newest tool combines multiple time frames (MTF) to provide a comprehensive view of supply and demand zones, and includes a trendwatcher that tracks the trend of the input timeframes.
The indicator is based on calculations of supply and demand zones, providing valuable insights for traders looking to make informed decisions about buying and selling. With its MTF functionality, the SMM - MTF S/D Zones & Trendwatcher is a valuable tool for any trader looking to stay on top of the market.
Features Version 1.1
-----------
-- MTF S/D Zones
Our indicator includes three adjustable supply and demand zones, which can be set to a desired higher timeframe.
Each zone includes options for:
- Extending the boxes.
- Show the 50% mitigation line.
- Let a zone disappear, change color, or do nothing.
- Option to plot/show the zones on the chart.
-- Trendwatcher
A convenient table that provides a quick overview of the trends of the set supply and demand.
You can configure the Trendwatcher the following ways:
- Option enable/disable the S/D trends to show in the table.
- Trendwatcher location on the chart.
- Trendwatcher size.
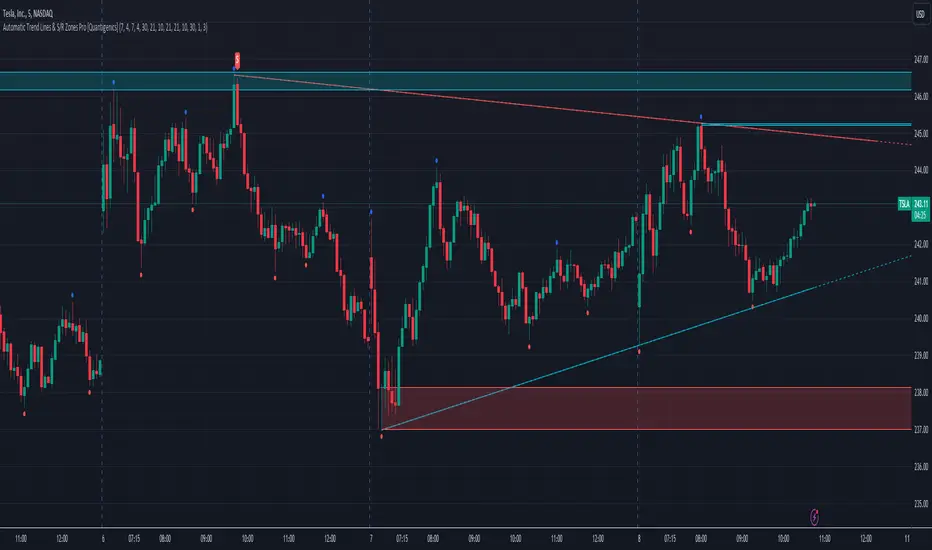
Automatic Trend Lines & S/R Zones Pro [Quantigenics]The “Automatic Trend Lines & S/R Zones Pro ” script is an innovative tool that integrates automated support and resistance zone identification with trend line generation. This script is an invaluable asset in technical analysis, adeptly identifying critical price reversal or breakout areas and drawing trend lines to gauge market direction and momentum. It generates trading signals based on support/resistance and trend line dynamics, making it a versatile standalone or complementary tool suitable for any market or time frame.
The "Automatic Trend Lines & S/R Zones Pro " script performs advanced financial chart analysis by algorithmically identifying support/resistance zones and generating trend lines It analyzes historical data, applying calculations like the highest and lowest price points over specified periods (defined by 'PeakOverBar' and 'LowOverBar' settings) to determine potential support and resistance zones. Trend lines are drawn by connecting significant price peaks and troughs, calculated based on user-defined strength parameters. The script also produces trading signals by analyzing price interactions with these zones and trend lines, using algorithms to detect breakouts or rejections, thus aiding traders in informed decision-making.
Technical Composition: a
Support and Resistance Zone Detection : Mechanism: Utilizes historical price data to identify key levels indicative of intense trading activity, revealing potential price stalling or reversals. These levels are marked based on past market actions and supply-demand dynamics.
Visualization: Zones are highlighted with colored boxes, enabling traders to easily spot shifts in market sentiment.
Automatic Trend Line Generation : Methodology: Connects significant price highs and lows over a designated period, customizable through inputs like PeakOverBar and LowOverBar.
Utility : These trend lines act as crucial indicators of uptrend support and downtrend resistance, aiding in the recognition of potential breakout or reversal zones and trend directions.
Customization and Flexibility : Adjustable Parameters: Includes customization options for peak/trough identification periods, trend line visibility, and extent of support/resistance zones.
Enhanced User Experience : Designed to be intuitive and adaptable, catering to diverse trading styles and strategies.
Usage in Trading :
Entry and Exit Points: The trade signals plotted at the support/resistance zones can be used for identifying both entry and exit points, in anticipation of price stalling and potentially reversing, and breakout signals plotted as price breaks trendlines can be used for breakout trading strategies, as well as stop loss areas.
Signal Alerts: Real-time alerts for significant interactions with trend lines or S/R zones, vital for both entry and exit strategies.
Integration with Other Systems: While effective as a standalone tool, it can also be used alongside other indicators for a more robust trading method.
Input Parameter Settings :
Intra-Bar Signal Generation (IntraBar) : Allows toggling between immediate signal generation within the current bar or after bar closure.
Peak and Low Over Bar (PeakOverBar, LowOverBar) : Sets the bar count for identifying market peaks and lows, adjustable for analyzing different market trends.
Strongest Peaks and Lows Period (StrongestFromPeaks, StrongestFromLows) : Determines the period for identifying significant market peaks and lows.
Show S/R Zones (ShowSRZones) : Enables the display of Support/Resistance zones for better market insight.
Trend Line Type (TrendLineType) : Offers options for trend line styles, like "One Line" or "Triple Lines."
Extend Trend Lines (ExtendTrendLines) : Configures the extension length of trend lines, useful for predicting future trends.
Peak and Low Trend Line Settings (ShowPeakTrendLine, ShowLowTrendLine, etc.) : Manage the display and characteristics of specific trend lines.
Signal Settings (ShowLabels, ShowBreakSignals, ShowPopUPSignals, etc.) : Customizes the appearance and frequency of signals and alerts.
Alert Settings (ShowTrendBreakSignals, ShowTrendPopSignals, etc.) : Configures alerts for significant market events like trend line breaks or rejections.
The "Automatic Trend Lines & S/R Zones Pro" script stands out as an essential tool for traders, offering comprehensive support/resistance and trend line analysis in a single package. Its automatic features, combined with customizable options, make it a key element in elevating market analysis and informed trading decision-making.
As always, remember that trading involves risks and past performance is not indicative of future results.
You can see the “Author’s instructions below to get immediate access to Automatic Trend Lines & S/R Zones Pro & the rest of the “Quantigenics Premium Indicator Suite”.
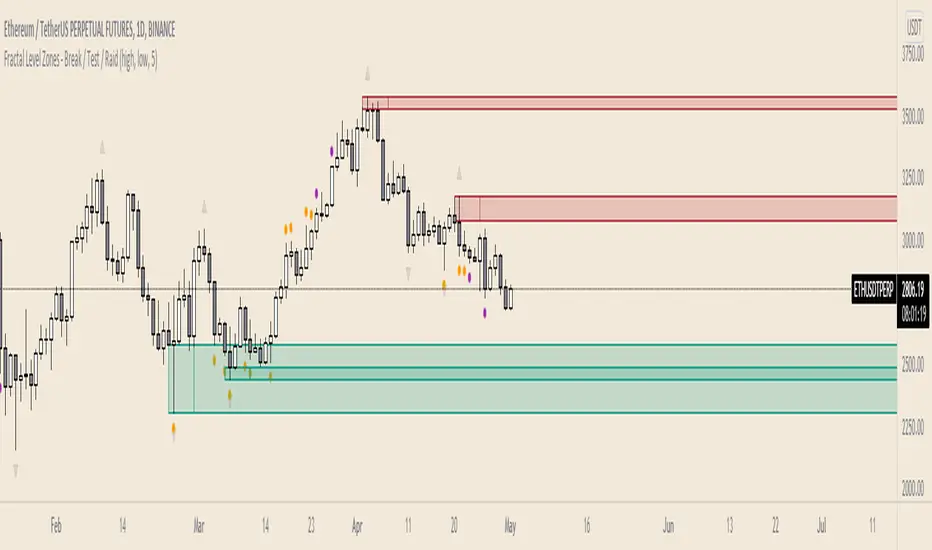
Fractal Level Zones - Break / Test / RaidFractal Level Zones - Break / Test / Raid
An experimental script that marks out the last two unbroken fractal high and low zones. The aim of the script is to focus on the type of candles that form and close in a zone. They can either tap into the zone or break them.
There are a number of outcomes:
- Break
- Break and retest
- Reversal
- Raid
When a zone is broken, the next untested fractal zone is printed.
How to use:
The indicator is to be used on higher time frames (M,W,D/4H). Monitor the type of candles that in form a zone (Daily TF recommended)
Default icon colours
Orange - Test of Zone
Purple - Break of fractal (can also be a raid)
Alert function included
Indicator in Use
Trap Zone — Shinobi LabPurpose
Trap Zone draws a clean intraday “no-man’s-land” and its surrounding + / – zones so you can quickly see where momentum trades are favored — and where to avoid fighting the tape. It also overlays ADR bands to frame extreme extensions.
How it works
Trap Zone core: Built from recent high/low lookbacks and key MAs. You can include MA200 in the box bounds (on by default) for stronger regime context.
+1 / –1 zones: Dynamic bands just outside the Trap Zone, sized by an adaptive EB minimum (bar-size floor based on instrument price) or average body size.
ADR bands (+/–): Daily range estimate using the last 20 sessions with outlier filtering (keeps the 5 most representative ranges under a safe cap).
Anchoring & visuals: New zones/ADR levels are projected from the prior session close with configurable left/right extension, labels (“++”, “––”, “+++”, “–––”), and a skull label inside the box.
Why it’s useful
Clarity at a glance: Above the box → long context; below the box → short context. Inside the box = trap area where signals are lower-quality.
Avoid the worst spots: The shaded center helps you skip chop and wait for clean breaks.
Frame extensions: ADR lines highlight when price is getting stretched beyond a typical session move.
Main features
MAs: 8 / 20 / 200 / 500 (200 is optional in the box logic).
Lookbacks: independent highs/lows for precise box edges.
Adaptive EB sizing drives +1 / –1 placement.
Outlier-robust ADR calculation.
Customizable colors, labels, and projection length.
Best practices
Treat the Trap Zone as a filter, not an entry signal.
Favor longs for signals above the box and shorts for signals below it.
Use with your signal tool (e.g., EB/TB V11.4) to time entries while the Trap Zone provides bias and location.
Inputs (highlights)
Include MA200 in Trap Zone (on/off)
Bars for High / Low (lookback)
Visual Extension Zones & Left Visual Extension
Show Zones / Show ADR Labels
MA lengths (8/20/200/500)
Notes
Designed for equities; ADR is computed at the end of the regular session and projected forward.
Works on intraday charts; precision set to 2 by default.

Engulfing Failed Zone Detector by RWBTradeLabEngulfing Failed Zone Detector by RWBTradeLab
A clean, non-repainting tool that focuses on one thing only: showing where strong engulfing patterns failed and the market broke through their base.
What this indicator does
This script automatically scans for confirmed engulfing patterns (Regular & E-Regular) and then tracks where those structures are invalidated.
It highlights two types of failure zones:
1. Buy Engulfing Failed
* A bullish engulfing pattern forms (Regular or E-Regular).
* Later, a bearish candle closes below the base low of that engulfing.
* The zone from the base candle to the failure candle is marked as Buy EG Failed .
2. Sell Engulfing Failed
* A bearish engulfing pattern forms (Regular or E-Regular).
* Later, a bullish candle closes above the base high of that engulfing.
* The zone from the base candle to the failure candle is marked as Sell EG Failed .
Only the first clear failure after each engulfing is drawn, keeping the chart clean and readable.
Visuals on chart
1. A rectangle (box) is drawn from the engulfing base candle to the failure candle.
2. Labels are placed automatically:
* Buy EG Failed (below the zone)
* Sell EG Failed (above the zone)
3. Label distance from the zone is controlled by Text Offset from Box (%).
4. Separate color controls for:
* Buy Engulfing Failed Box Color
* Sell Engulfing Failed Box Color
The label style matches Engulfing Detector by RWBTradeLab for a consistent visual experience.
Alerts
Built-in alerts trigger only on confirmed bar close when a new failure completes:
* Buy EG Failed
* Sell EG Failed
Each alert message includes:
* Brand prefix: RWBTradeLab
* Price
* Time
* Ticker
Perfect for linking with bots, webhooks or alert-based trade management.
Key settings
Candle Length (closed candles)
* Defines how many recent confirmed candles are scanned (the live bar is excluded).
Display toggles
* Buy Engulfing Failed
* Sell Engulfing Failed
* Text
Turn each element ON/OFF to control how much information you want on the chart.
Text Offset from Box (%)
* Controls how far the label is placed from the failed zone, with a safe minimum to keep labels clear and readable.
Non-repainting confirmation
* All detection and alerts are based on closed candles only.
* No signals from the running candle, no repaint tricks.
* Once a failure zone appears, it stays fixed.
Best use
Failed engulfing zones can reveal:
* Broken demand/supply zones
* Liquidity grabs where “smart money” flushed traders out
* Strong momentum shifts after a failed reversal attempt
* Levels where continuation or clean retests often occur
Works on any symbol and timeframe. For best results, combine with:
* Higher timeframe structure
* Key support/resistance or supply/demand mapping
* Your own confirmation tools and risk management
Disclaimer
This indicator is a technical pattern-detection tool, not financial advice. Trading involves risk. Always confirm signals with your own analysis and use proper risk management.
Creator: RWBTradeLab
If this script adds value to your trading, please leave a ⭐ and share your feedback.

MILLION MEN - Zone Scanner ProWhat it is
MILLION MEN - Zone Scanner is a context-driven momentum tool that visualizes trend regimes (bullish / bearish) and highlights the first-touch opportunity within each regime’s reactive zones. It’s designed to help traders identify pullbacks inside an existing bias rather than chasing breakouts.
How it works
Uses a custom RSI-style momentum meter calculated from RMA of up/down moves.
When the meter > upper threshold → Green Regime.
When the meter < lower threshold → Red Regime.
Defines LONG Zone (34 – 40) and SHORT Zone (60 – 70) for mean-reversion touches.
Prints L FT or S FT on the first confirmed touch after a regime turns on.
Optional candle-color filter (green bar for LONG / red bar for SHORT).
Exit signals trigger once the meter revisits the regime boundary.
Optional Neon Glow styling improves visual clarity without clutter.
How to use
Identify regime direction (green = bullish bias, red = bearish bias).
Wait for the first touch into the relevant zone.
Confirm with higher-time-frame structure or volume context.
Manage position or exit once the meter retests its regime limit.
Use it as a context tool, not an auto-entry system.
Originality & Value
This script enforces discipline by allowing only one signal per regime, reducing over-trading and noise. The zone visualization and glow layers offer a clean, cinematic UI consistent with the MILLION MEN visual standard.
Limitations & Transparency
Works best on standard candlesticks and normal-time frames (tested on BTC, ETH, XRP, BNB, XAUUSD).
No look-ahead or future data.
Signals are bar-close confirmed (barstate.isconfirmed).
Educational tool — not financial advice.
for educational use under the MILLION MEN framework. Core logic is protected to maintain script integrity.
MILLION MEN - Zone ScannerWhat it is
MILLION MEN - Zone Scanner is a context-driven momentum tool that visualizes trend regimes (bullish / bearish) and highlights the first-touch opportunity within each regime’s reactive zones. It’s designed to help traders identify pullbacks inside an existing bias rather than chasing breakouts.
How it works
Uses a custom RSI-style momentum meter calculated from RMA of up/down moves.
When the meter > upper threshold → Green Regime.
When the meter < lower threshold → Red Regime.
Defines LONG Zone (34 – 40) and SHORT Zone (60 – 70) for mean-reversion touches.
Prints L FT or S FT on the first confirmed touch after a regime turns on.
Optional candle-color filter (green bar for LONG / red bar for SHORT).
Exit signals trigger once the meter revisits the regime boundary.
Optional Neon Glow styling improves visual clarity without clutter.
How to use
Identify regime direction (green = bullish bias, red = bearish bias).
Wait for the first touch into the relevant zone.
Confirm with higher-time-frame structure or volume context.
Manage position or exit once the meter retests its regime limit.
Use it as a context tool, not an auto-entry system.
Originality & Value
This script enforces discipline by allowing only one signal per regime, reducing over-trading and noise. The zone visualization and glow layers offer a clean, cinematic UI consistent with the MILLION MEN visual standard.
Limitations & Transparency
Works best on standard candlesticks and normal-time frames (tested on BTC, ETH, XRP, BNB, XAUUSD).
No look-ahead or future data.
Signals are bar-close confirmed (barstate.isconfirmed).
Educational tool — not financial advice.
Free Protected Version
Published for public educational use under the MILLION MEN framework. Core logic is protected to maintain script integrity.

Liquidity ZonesWhat It Does:
Liquidity Zones identifies key areas where institutional traders target stop orders. The indicator automatically detects significant price swings and maps the upper and lower wick zones where liquidity pools form. These zones represent high-probability areas where price is likely to return to collect stop orders before continuing its next move.
How To Use:
Identify Key Zones:
-Red zones highlight Buy Side Liquidity (resistance areas)
-Green zones highlight Sell Side Liquidity (support areas)
Trading Opportunities:
-Enter trades when price respects these zones
-Watch for zone breaks and re-tests for continuation signals
-Use alerts to notify you when price enters a zone or when new zones form
Optimization Tips:
-Adjust lookback periods based on volatility (higher for calmer markets)
-Enable auto-threshold for adaptive sensitivity to market conditions (default setting)
-Most effective on timeframes 4H and above
The indicator tracks when zones are broken and automatically removes them when price returns, providing a clean, uncluttered view of the most relevant liquidity areas on your chart.

Phase Cross Strategy with Zone### Introduction to the Strategy
Welcome to the **Phase Cross Strategy with Zone and EMA Analysis**. This strategy is designed to help traders identify potential buy and sell opportunities based on the crossover of smoothed oscillators (referred to as "phases") and exponential moving averages (EMAs). By combining these two methods, the strategy offers a versatile tool for both trend-following and short-term trading setups.
### Key Features
1. **Phase Cross Signals**:
- The strategy uses two smoothed oscillators:
- **Leading Phase**: A simple moving average (SMA) with an upward offset.
- **Lagging Phase**: An exponential moving average (EMA) with a downward offset.
- Buy and sell signals are generated when these phases cross over or under each other, visually represented on the chart with green (buy) and red (sell) labels.
2. **Phase Zone Visualization**:
- The area between the two phases is filled with a green or red zone, indicating bullish or bearish conditions:
- Green zone: Leading phase is above the lagging phase (potential uptrend).
- Red zone: Leading phase is below the lagging phase (potential downtrend).
3. **EMA Analysis**:
- Includes five commonly used EMAs (13, 26, 50, 100, and 200) for additional trend analysis.
- Crossovers of the EMA 13 and EMA 26 act as secondary buy/sell signals to confirm or enhance the phase-based signals.
4. **Customizable Parameters**:
- You can adjust the smoothing length, source (price data), and offset to fine-tune the strategy for your preferred trading style.
### What to Pay Attention To
1. **Phases and Zones**:
- Use the green/red phase zone as an overall trend guide.
- Avoid taking trades when the phases are too close or choppy, as it may indicate a ranging market.
2. **EMA Trends**:
- Align your trades with the longer-term trend shown by the EMAs. For example:
- In an uptrend (price above EMA 50 or EMA 200), prioritize buy signals.
- In a downtrend (price below EMA 50 or EMA 200), prioritize sell signals.
3. **Signal Confirmation**:
- Consider combining phase cross signals with EMA crossovers for higher-confidence trades.
- Look for confluence between the phase signals and EMA trends.
4. **Risk Management**:
- Always set stop-loss and take-profit levels to manage risk.
- Use the phase and EMA zones to estimate potential support/resistance areas for exits.
5. **Whipsaws and False Signals**:
- Be cautious in low-volatility or sideways markets, as the strategy may generate false signals.
- Use additional indicators or filters to avoid entering trades during unclear market conditions.
### How to Use
1. Add the strategy to your chart in TradingView.
2. Adjust the input settings (e.g., smoothing length, offsets) to suit your trading preferences.
3. Enable the strategy tester to evaluate its performance on historical data.
4. Combine the signals with your own analysis and risk management plan for best results.
This strategy is a versatile tool, but like any trading method, it requires proper understanding and discretion. Always backtest thoroughly and trade with discipline. Let me know if you need further assistance or adjustments to the strategy!
