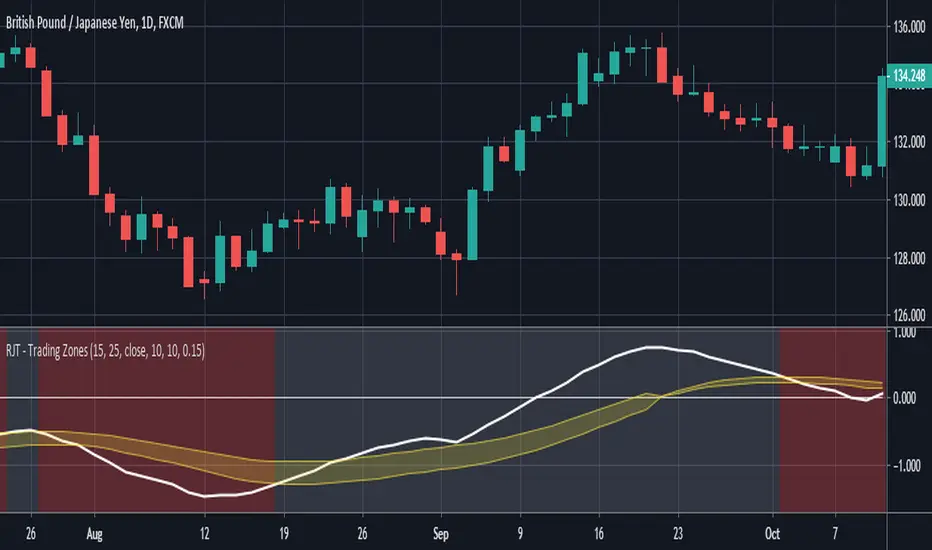
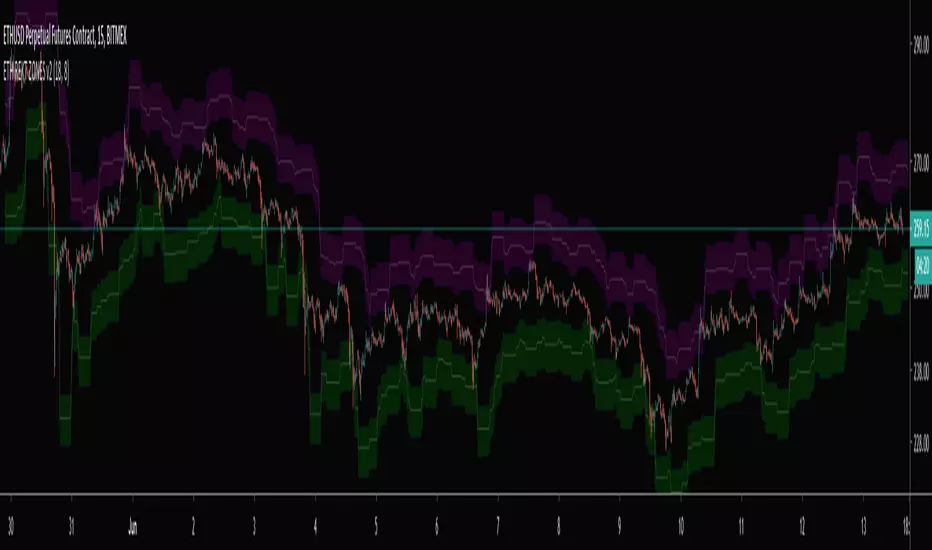
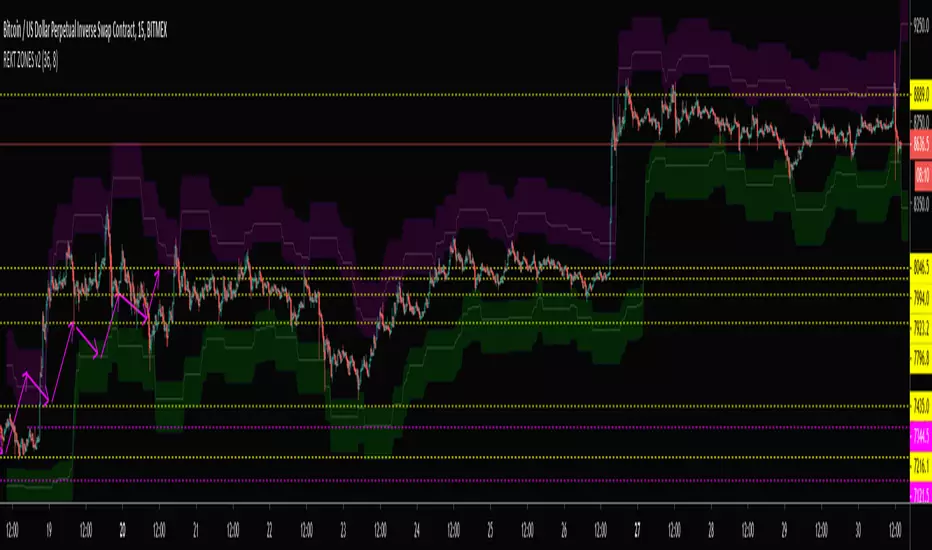
RJT - Trading ZonesThis is the Visual Indicator component of my Trading Zones System; other indicators are the Trade Visualiser and Trader Placer.
This indicator is based around a convergence and divergence of moving averages. As the signal line moves into the yellow "zone" from below a long position is opened. This position is closed and reversed when either the upper or lower boundary is crossed downwards by the signal line. This is all reversed for short trades.
The channel is created by adding a factor of previous values, from a configurable period, to an exponential moving average of the signal line.
Best used on the Daily timeframe of any Forex or Commodity market, but is successful on all timeframes.
Go Long when background turns from Red to Green.
Go Short when background changes from Green to Red.
Signal Smoothing = Length of signal period
Signal Look back period = Period of look back for highest value (when long, lowest value when short) to create channel width
Channel multiple= Multiple of highest value to be added to EMA of Signal to create zone (larger number = wider zone)
"zone" için komut dosyalarını ara
Relative Strength Index With EMA and Control ZonesThought this could be helpful since I couldnt find an RSI with an ema and Browns theory using control zones. Hope you all enjoy!
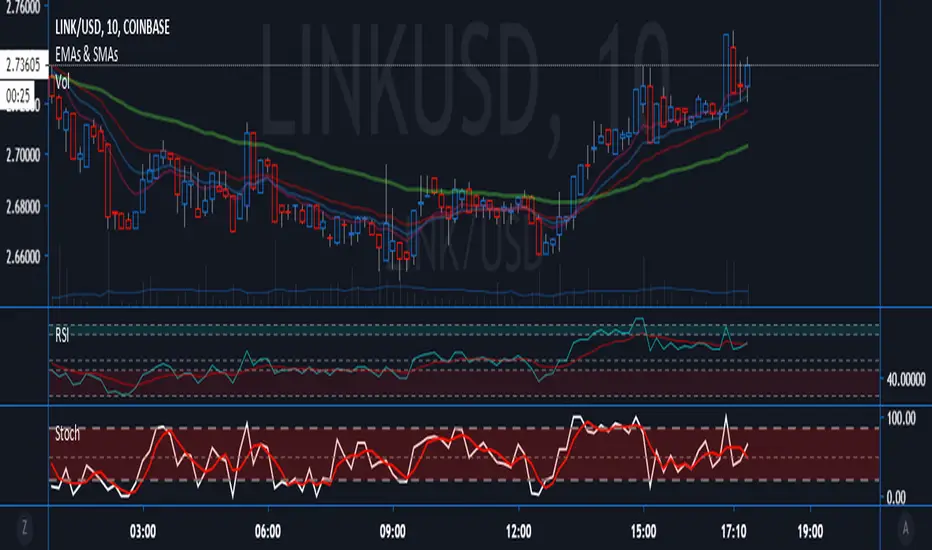
Hashem Extended Stochastic (V2)Extended Stochastic with All Zones. From Neutral to Danger Zones.
The Most Complete and Extended Stochastic Indicator.

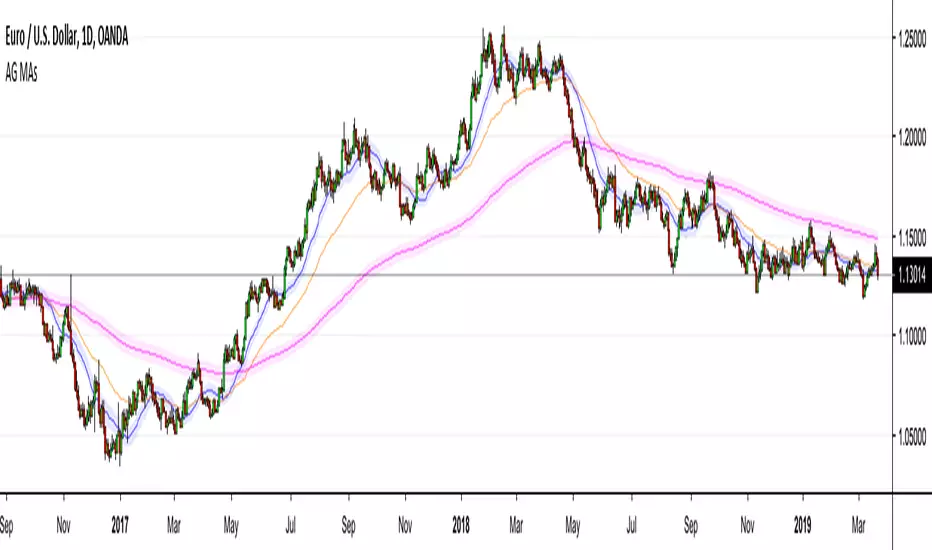
AG Moving Averages w/ BandsThis is an indicator that we built from a few simple ideas: display more than one Moving Average, display the Moving Average "Band" (more below) for each Moving Average, and allowing toggle between SMA/EMA - all in the one indicator.
The Moving Average "Band" is creating using Moving Averages (SMA/EMA) with High and Low as sources. The combination of the MA(Close), MA(High), MA(Low), creates a "Band" for each MA length - which we have found to be very helpful in our Moving Average studies.
The example in the chart above is EURUSD with 20SMA (with Bands), 55EMA (without Bands), 200EMA (with Bands). As you can see, the Bands do a better job than MAs alone for capturing price movement and acting as larger dynamic Support/Resistance zones.
Everything in this indicator is fully customizable, from which MAs to show, to those MA lengths, whether to use SMA/EMA for each individual MA, and whether to display the MA "Band" for each individual MA.
We hope you find it as useful as we have!
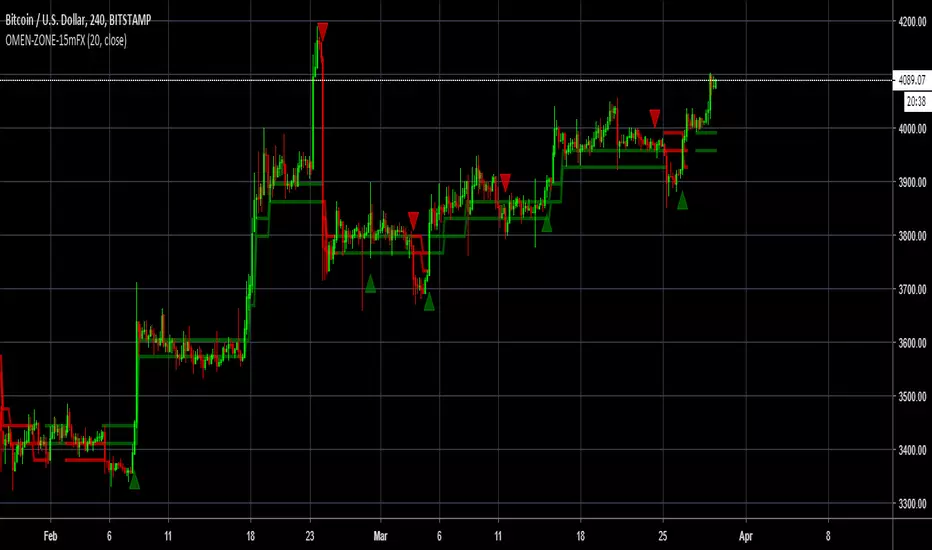
OMEN-ZONE-15mFXOMEN-ZONE created for 15m Charts FOREX. Omen-zone allows users to have a zone of entry for shorting and Longing.
3 Candle Wait will give users larger Zones for catching longer moves and to find great entries
20 Candle Wait will give users smaller Zones for catching Shorter moves for Scalping.

RSI with ZonesAdds colors to buy and sell zones. Default settings will paint area between 50 and 70 green and area between 30 and 50 red.

Universe Structure & Trend Zone [All-in-One]**Overview**
The "Universe Structure & Trend Zone" is a comprehensive all-in-one trading toolkit designed to combine Institutional Trend Following with Smart Money Concepts (SMC/ICT). It helps traders identify the dominant trend direction while providing precise entry points based on Market Structure Breaks (MSB) and Order Blocks.
This script aims to filter out market noise by allowing trades only when Price Action aligns with the long-term trend (SMA Zone).
**Key Features**
1. **Market Structure Breaks (MSB) & ZigZag:**
- Detects structural shifts in price (Bullish/Bearish MSB).
- Uses a default Signal Length of 10 to filter out minor swings and focus on significant structural changes.
- Visualizes high and low pivot points.
2. **Smart Trend Zone (SMA 200 Filter):**
- Incorporates a 200-period SMA Zone (Institutional Level) to determine the macro trend.
- **Trend Filter Logic:** The indicator intelligently filters signals. It displays Bullish Order Blocks only when the price is trending *above* the SMA Zone, and Bearish Order Blocks only *below* it. This drastically reduces false signals in choppy markets.
3. **Order Blocks (OB) & Breaker Blocks (BB):**
- Automatically identifies high-probability Order Blocks and Breaker Blocks.
- Includes optional filters for Volume and Premium/Discount zones to validate the blocks.
- Features an auto-cleanup mechanism to remove invalid or broken boxes, keeping the chart clean.
4. **Hull Moving Average (HMA):**
- A fast-reacting 55-period HMA is included to visualize short-term momentum shifts (Green for Bullish, Red for Bearish).
5. **Smart Range (Support/Resistance):**
- Plots the dynamic Highest High and Lowest Low of the selected timeframe (default 4H) to show the current trading range and Equilibrium (EQ) level.
**How to Use**
* **Step 1:** Check the **SMA Zone** (Gray/Green/Red Band). If Price > Zone, look for Longs. If Price < Zone, look for Shorts.
* **Step 2:** Wait for a **Market Structure Break (MSB)** label in the direction of the trend.
* **Step 3:** Look for an entry at the retest of an **Order Block (OB)** or **Breaker Block (BB)**.
* **Step 4:** Use the HMA color change as a confirmation trigger or trailing stop guide.
**Settings**
* **Signal Length:** Default is 10 (Optimized for standard swings).
* **Trend Filter:** Enabled by default (Recommended to stay with the trend).
* **Display:** You can toggle MSB lines, Boxes, and Labels on/off to suit your visual preference.
**Disclaimer**
This indicator is for educational purposes only and does not constitute financial advice. Always use proper risk management.

Daily Auto-Fib Zones (Custom Colors)This indicator automatically draws daily Fibonacci-based zones using the current session’s high and low. The levels update dynamically as new price action forms and include optional visual regions for several commonly referenced retracement percentages.
Features include:
• Automatic detection of the daily high and low
• Real-time updates throughout the session
• Optional zones for 0.11–0.17, 0.5, and 0.618–0.786 levels
• Custom color inputs for every line and zone
• Dynamic boxes that expand with the day’s range
• Lightweight visual layout with toggleable components
The tool is intended purely for chart visualization. It does not provide signals or trade recommendations.

BTC Swing Plan – Levels & ZonesThis indicator draws a structured breakout model for BTCUSD with clearly defined entry levels, stop zones, and four realistic upside targets.
It automatically plots:
Breakout zone
Stop-loss zone
Target 1
Target 2
Target 3
Target 4 (stretch target)
Midlines & color-coded structure boxes
This tool is designed for traders who prefer clean execution levels, disciplined risk management, and realistic price expansion steps—not overly aggressive moon projections.
All levels are fully adjustable from the settings menu.

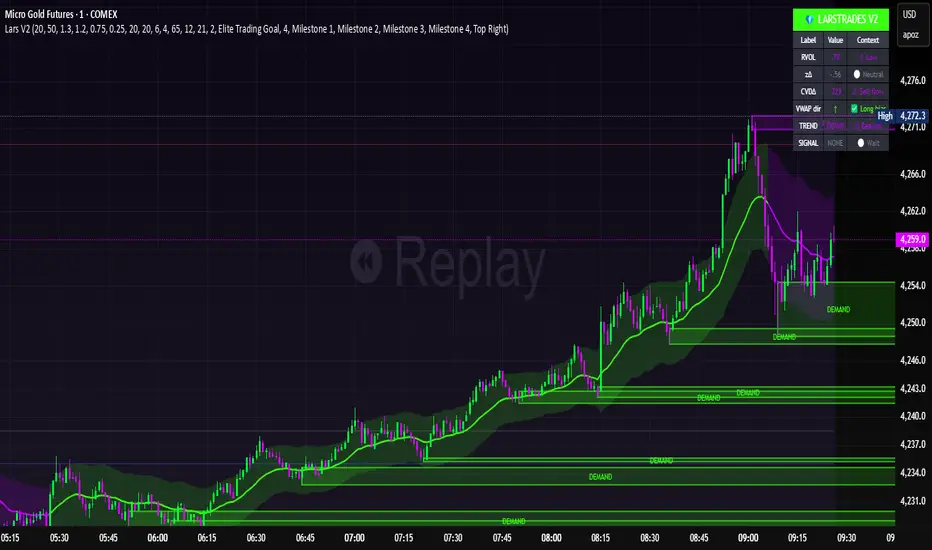
LarsTrades Order Flow ZonesLarsTrades Order Flow Zones
**Important:
-Futures charts only!
-Trust the default settings
-best on 2min or lower timeframe.
-if indicator error in replay mode: exit, ctrl+r - it will reset.
This indicator builds a full trade workflow from raw order flow imbalances. It finds aggressive buy and sell imbalances, promotes the strongest ones into key levels, and manages each level through its entire life cycle. Every level becomes a visual zone on the chart that updates in real time as the market moves.
It is built for short-term traders who want clarity, speed, and a structured decision process based on imbalances instead of guesswork.
If you rely on order flow, imbalance zones, or systematic retest setups, this tool helps you stay consistent and understand the story behind each move.
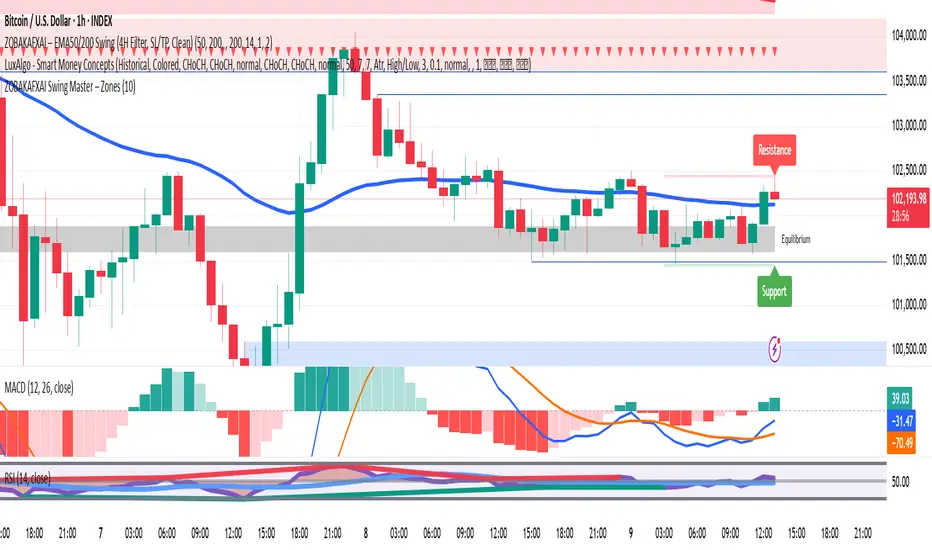
ZOBAKAFXAI Swing Master – ZonesZOBAKAFXAI Swing Master – Zones automatically identifies key support and resistance zones based on swing highs and lows. It highlights market structure areas where price is likely to react, making it perfect for price action traders.
Features:
• Auto swing high/low zone detection
• Dynamic support & resistance blocks
• Clean chart layout for all timeframes
• Best for swing trading and smart money concepts
• Works on Forex, Gold, Crypto, Indices
This tool is for educational use only – not financial advice.
Created by ZOBAKAFXAI.
ATR SL/TP Precision Zones (Dots)ATR SL/TP Precision Zones (Dots) is a volatility-based tool designed to help traders set accurate Stop Loss and Take Profit levels based on real market volatility — not fixed pips or emotion.
This indicator uses ATR (Average True Range) multiplied by 1.2 to calculate dynamic distance bands.
Instead of drawing a ribbon or channel, it places simple dots above and below each candle:
Upper Dot (Green) → Suggested Take Profit / Price Stretch Zone
Lower Dot (Red) → Suggested Stop Loss Cushion / Support Expansion Zone
Because ATR measures market volatility, these dots expand during high volatility and tighten during slow markets, helping traders avoid stop-loss hunts and premature exits.
Why This Works
Most traders lose because:
They set SL too close → stopped out by noise
They set TP too far → price never reaches it
This tool calibrates those distances automatically based on real price movement behavior.
ATR = volatility
Volatility = market breathing room
This indicator ensures your trade has room to breathe, increasing win consistency.
Best Use Cases
Scalping
Swing trading
Trend continuation entries
Reversal confirmations with support/resistance
Works on Crypto / Forex / Stocks / Futures

RAFEN-G - Kill Zones & Institutional Gaps🔍 What It Does
Kill Zones (KZ1, KZ2, KZ3)
Automatically highlights the main intraday liquidity windows such as the London open, NY AM, and NY PM sessions — customizable by time, color, and transparency.
Perfect for timing setups, identifying liquidity sweeps, or backtesting session behavior.
Institutional GAP Detection (NY 11:00 → 03:00)
Anchored on the New York H1 clock, the script automatically draws the “institutional gap” between the 11:00 close and the 03:00 open of the next trading day.
Each gap is drawn as a transparent box with a label showing its size in price units.
Dynamic Cleanup & Color Updates
Automatically removes old boxes beyond your chosen history limit and keeps all visuals perfectly synchronized in real-time.
⚙️ Key Features
3 fully independent and editable Kill Zones
Adjustable timezone (default: America/New_York)
Works on all intraday timeframes
Auto-management of historical data
Clean and lightweight visuals (up to 2000 boxes)
Real-time color and transparency updates
Alerts when each Kill Zone starts
🧠 Ideal For
Traders using ICT, SMC, or institutional frameworks who want clear visual separation of market sessions and automatic tracking of session-to-session gaps for confluence or imbalance analysis.
🕐 Recommended Use
Apply on 5 min / 15 min / 1 h charts, align timezone to NYC, and combine with liquidity or FVG tools for maximum insight.

MACD ZoneThe MACD Zone Indicator is a custom technical analysis tool built to visualize market momentum by combining the MACD (Moving Average Convergence Divergence) with dynamic zone levels for enhanced trend interpretation.
🔧 Key Features
1. MACD Histogram & Signal Lines:
Displays a color-coded MACD histogram that highlights bullish and bearish momentum shifts for quick visual analysis.
2. Neutral Zone Logic:
For Nifty and its option charts, the default neutral zone threshold (h2) is set to 5, which can be customized by the user through settings.
For other symbols, h2 is dynamically calculated as price / 2000, adapting automatically to varying price levels.
3. Zone Visualization:
Four horizontal levels (h1, h2, h3, h4) define the bullish, neutral, and bearish zones, helping traders quickly gauge trend strength, potential reversals, and momentum transitions.

Illuminati Zone🟣 Illuminati Zone — Hidden Power of the 11 PM NZ Candle
The Illuminati Zone reveals the hidden footprints of liquidity and market imbalance formed by the 11 PM New Zealand 15-minute candle — a time when global liquidity transitions between major sessions.
This candle often defines key intraday supply and demand boundaries, serving as a magnet for price and a pivot point for high-probability reversals or breakouts.
🧠 How it works
Automatically detects and marks the 11 PM NZ 15-minute candle each day.
Draws a translucent zone box between its high and low.
Extends two reference lines at +1 × range and –1 × range above and below the zone — ideal for spotting overextensions or liquidity sweeps.
Supports custom lookback, colors, and visual options.
💡 How to use it
Watch how price interacts with the zone — rejection often signals smart-money activity.
Use +1 and –1 levels as overextended zones for potential reversals or breakout retests.
Combine with your own confluence tools or volume analysis for precision entries.
⚙️ Customization Options
Target hour (NZ time)
Days back to display
Zone and line colors
Transparency and visual preferences
🔮 Pro Tip: Pair it with a volume or imbalance indicator for surgical-level precision in identifying where smart money positions are built or released.

Smart Directional Fib Zone (Selectable Session)🎯 Overview
This indicator plots a dynamic Fibonacci zone between the 0.5 and 0.618 levels , calculated from the previous day’s price action , and is designed specifically for intraday traders.
It visually highlights key retracement or reaction areas where the market often pauses or reverses.
🔍 How it works
At the start of each day, the script automatically captures:
the previous day’s open (pdo),
high (pdh),
low (pdl),
and close (pdc).
It then determines if the previous day was bullish (Close > Open) or bearish (Close < Open).
Based on that:
If the previous day was bullish, it projects the Fibonacci levels down from the high (typical for expecting retracements).
If bearish, it projects them up from the low.
The two key levels are:
0.5 (50%) retracement / projection
0.618 (61.8%) retracement / projection
A colored zone is plotted between these levels to act as a leading guide for intraday setups.
⏰ Time filtering & session customization
A unique feature is the dynamic session filtering:
By default, the zone is only plotted during active market hours, keeping your chart clean outside trading hours.
The script provides a dropdown selector so you can quickly switch between:
India session (9:15 to 15:30)
Europe session (9:00 to 17:30)
US session (9:30 to 16:00)
Or even define your own custom session times.
This makes it ideal for intraday traders in any region.
🎨 Visual features
The fill zone changes color based on the previous day’s sentiment:
Green zone if the previous day was bullish
Red zone if the previous day was bearish
🚨 Alerts
The script includes an alert condition, so you can easily set up TradingView alerts to notify you when:
Price enters the Fibonacci zone.
This is extremely helpful for catching retracements or reversals without staring at the screen all day.
⚙️ How to use
✅ Works on any intraday timeframe (1 min, 5 min, 15 min, etc.).
✅ Simply add it to your chart, pick your session in the dropdown, and watch the Fibonacci zone automatically adjust to your selected market hours.
Use it as a confluence tool alongside other indicators like VWAP, EMAs, Bollinger Bands, or price action patterns to time entries and exits.
💪 Why this is powerful
This is more than a simple Fib retracement tool:
It dynamically adapts to the previous day’s sentiment, helping you trade in alignment with recent market psychology.
The session filtering ensures your charts are focused only on the periods

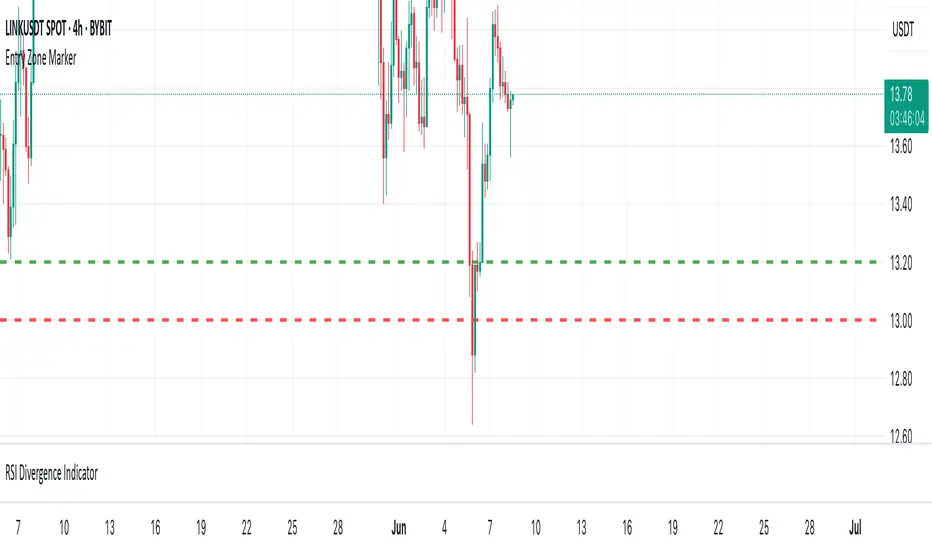
P&L Entry Zone Marker (clean)This indicator is a simple visual calculator for futures traders.
It helps you track your long and short entry zones based on position size and average price.
🔹 Green line – recalculated long entry after averaging down.
🔹 Red line – short entry point.
You can manually input your initial entry, volume, averaging volume, and averaging price.
The script calculates your new average entry for long positions and plots both lines as full horizontal levels across the chart.
✳️ Useful for:
Visualizing break-even zones
Planning P&L zones for hedged positions
Quickly aligning your trades with market structure
✅ Clean version — no labels, just lines.
📉 Works on all symbols and timeframes.
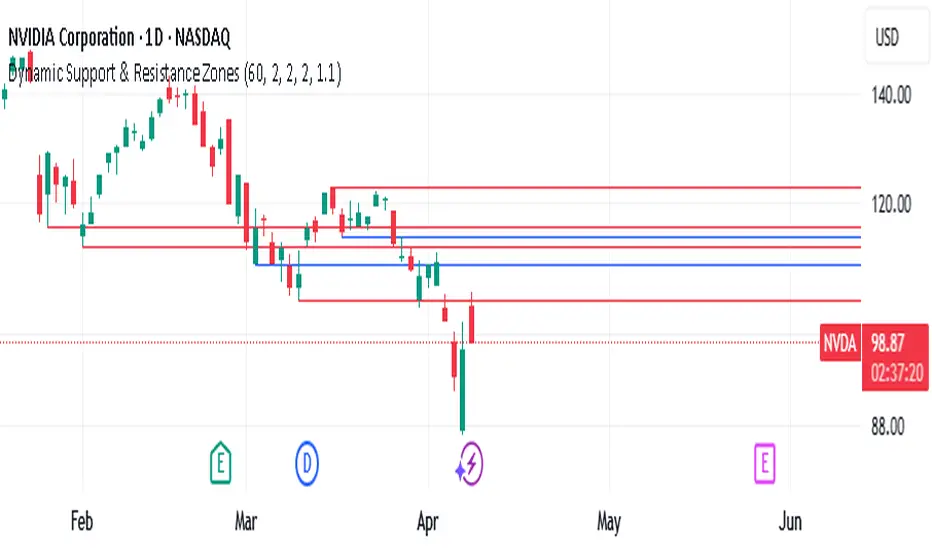
Dynamic Support & Resistance ZonesThis indicator dynamically detects and plots support and resistance levels by analyzing recent price pivots. It works as follows:
Inputs:
Set the number of bars to look back, pivot strength (left/right), minimum touches for a major level, and a tolerance percentage that is converted to decimal.
Note:
• Pivot Left is the number of bars before the candidate bar that must be lower (for a swing high) or higher (for a swing low) than the candidate. It ensures the candidate is higher (or lower) than recent previous bars.
• Pivot Right is the number of bars after the candidate bar that are also required to be lower (for a swing high) or higher (for a swing low) than the candidate. This parameter is crucial because it verifies that the candidate bar wasn’t just a temporary spike—price needs to remain below (or above) the candidate for a number of subsequent bars.
Suggested default settings for a daily chart: Bars to Look Back: 60; Pivot Left: 2; Pivot Right: 2; Min Touches for Major Level: 2; Tolerance (%): 1
Pivot Detection:
It uses built-in pivot functions to identify swing highs (potential resistance) and swing lows (potential support) based on a user-defined lookback window and pivot strength.
Clustering:
Detected levels that are close (within a set tolerance) are grouped into clusters. Each cluster averages the levels and counts the number of touches. This helps determine if a zone is repeatedly tested.
Visual Display:
It plots horizontal lines on the chart:
Red lines indicate “major” zones that have been tested a number of times (as defined by the user).
Blue lines represent secondary levels that have been touched less often.
Dynamic Cleanup:
Clusters outside the user-defined lookback period are removed so that only recent, relevant levels remain visible.
In short, the indicator creates a dynamic, visually updated map of key support and resistance zones based on recent price action and pivot behavior.
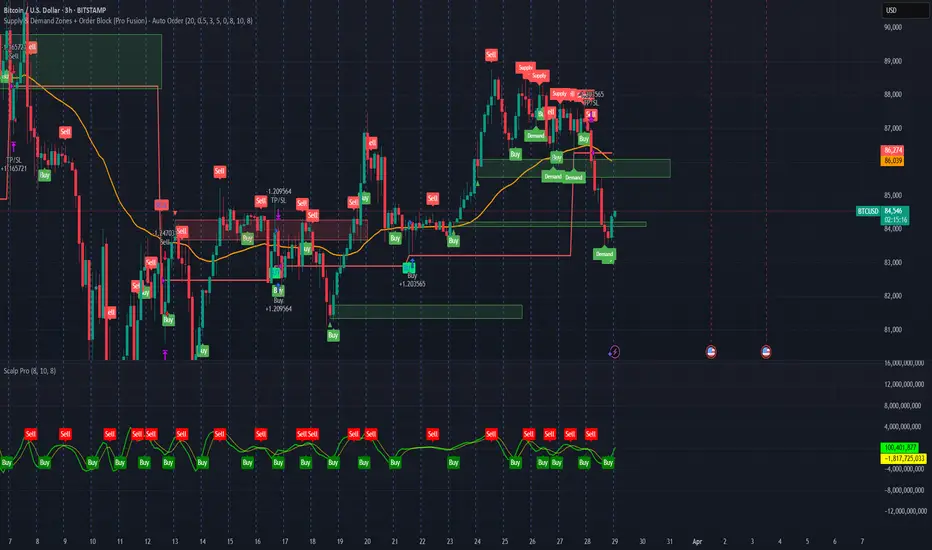
Supply & Demand Zones + Order Block (Pro Fusion) - Auto Order Strategy Title:
Smart Supply & Demand Zones + Order Block Auto Strategy with ScalpPro (Buy-Focused)
📄 Strategy Description:
This strategy combines the power of Supply & Demand Zone analysis, Order Block detection, and an enhanced Scalp Pro momentum filter, specifically designed for automated decision-making based on high-volume breakouts.
✅ Key Features:
Auto Entry (Buy Only) Based on Breakouts
Automatically enters a Buy position when the price breaks out of a valid demand zone, confirmed by EMA 50 trend and volume spike.
Order Block Logic
Identifies bullish and bearish order blocks using consecutive candle structures and significant price movement.
Dynamic Stop Loss & Trailing Stop
Implements a trailing stop once price moves in profit, along with static initial stop loss for risk management.
Clear Visual Labels & Alerts
Displays BUY/SELL, Demand/Supply, and Order Block labels directly on the chart. Alerts trigger on valid breakout signals.
Scalp Pro Momentum Filter (Optimized)
Uses a modified MACD-style momentum indicator to confirm trend strength and filter out weak signals.
Trend Zone Moving Averages📈 Trend Zone Moving Averages
The Trend Zone Moving Averages indicator helps traders quickly identify market trends using the 50SMA, 100SMA, and 200SMA. With dynamic background colors, customizable settings, and real-time alerts, this tool provides a clear view of bullish, bearish, and extreme trend conditions.
🔹 Features:
Trend Zones with Dynamic Background Colors
Green → Bullish Trend (50SMA > 100SMA > 200SMA, price above 50SMA)
Red → Bearish Trend (50SMA < 100SMA < 200SMA, price below 50SMA)
Yellow → Neutral Trend (Mixed signals)
Dark Green → Extreme Bullish (Price above all three SMAs)
Dark Red → Extreme Bearish (Price below all three SMAs)
Customizable Moving Averages
Toggle 50SMA, 100SMA, and 200SMA on/off from the settings.
Perfect for traders who prefer a cleaner chart.
Real-Time Trend Alerts
Get instant notifications when the trend changes:
🟢 Bullish Zone Alert – When price enters a bullish trend.
🔴 Bearish Zone Alert – When price enters a bearish trend.
🟡 Neutral Zone Alert – When trend shifts to neutral.
🌟 Extreme Bullish Alert – When price moves above all SMAs.
⚠️ Extreme Bearish Alert – When price drops below all SMAs.
✅ Perfect for Any Market
Works on stocks, forex, crypto, and commodities.
Adaptable for day traders, swing traders, and investors.
⚙️ How to Use: Trend Zone Moving Averages Strategy
This strategy helps traders identify and trade with the trend using the Trend Zone Moving Averages indicator. It works across stocks, forex, crypto, and commodities.
🟢 Bullish Trend Strategy (Green Background)
Objective: Look for buying opportunities when the market is in an uptrend.
Entry Conditions:
✅ Background is Green (Bullish Zone).
✅ Price is above the 50SMA (confirming strength).
✅ Price pulls back to the 50SMA and bounces OR breaks above a key resistance level.
Stop Loss:
🔹 Place below the most recent swing low or just under the 50SMA.
Take Profit:
🔹 First target at the next resistance level or recent swing high.
🔹 Second target if price continues higher—trail stops to lock in profits.
🔴 Bearish Trend Strategy (Red Background)
Objective: Look for shorting opportunities when the market is in a downtrend.
Entry Conditions:
✅ Background is Red (Bearish Zone).
✅ Price is below the 50SMA (confirming weakness).
✅ Price pulls back to the 50SMA and rejects OR breaks below a key support level.
Stop Loss:
🔹 Place above the most recent swing high or just above the 50SMA.
Take Profit:
🔹 First target at the next support level or recent swing low.
🔹 Second target if price keeps falling—trail stops to secure profits.
🌟 Extreme Trend Strategy (Dark Green / Dark Red Background)
Objective: Trade with momentum when the market is in a strong trend.
Entry Conditions:
✅ Dark Green Background → Extreme Bullish: Price is above all three SMAs (strong uptrend).
✅ Dark Red Background → Extreme Bearish: Price is below all three SMAs (strong downtrend).
Trade Execution:
🔹 For longs (Dark Green): Look for breakout entries above resistance or pullbacks to the 50SMA.
🔹 For shorts (Dark Red): Look for breakdown entries below support or rejections at the 50SMA.
Risk Management:
🔹 Use tighter stop losses and trail profits aggressively to maximize gains.
🟡 Neutral Trend Strategy (Yellow Background)
Objective: Avoid trading or wait for a breakout.
What to Do:
🔹 Avoid trading in this zone—price is indecisive.
🔹 Wait for confirmation (background turns green/red) before taking a trade.
🔹 Use alerts to notify you when the trend resumes.
📌 Final Tips
Use this strategy with price action for extra confirmation.
Combine with support/resistance levels to improve accuracy.
Set alerts for trend changes so you never miss an opportunity.
Enjoy!
