"session" için komut dosyalarını ara


NYSE CME Market Session Clock This indicator can only work on short-term timeframes, since the time before the opening and before the closing of the session is updated only with the appearance of a new candle.

Killzones (ICT) + Session Break + PDH/PDL + Open 06:00 — ParisKillzones (ICT) + Session Break + PDH/PDL + Open 06:00 — Paris

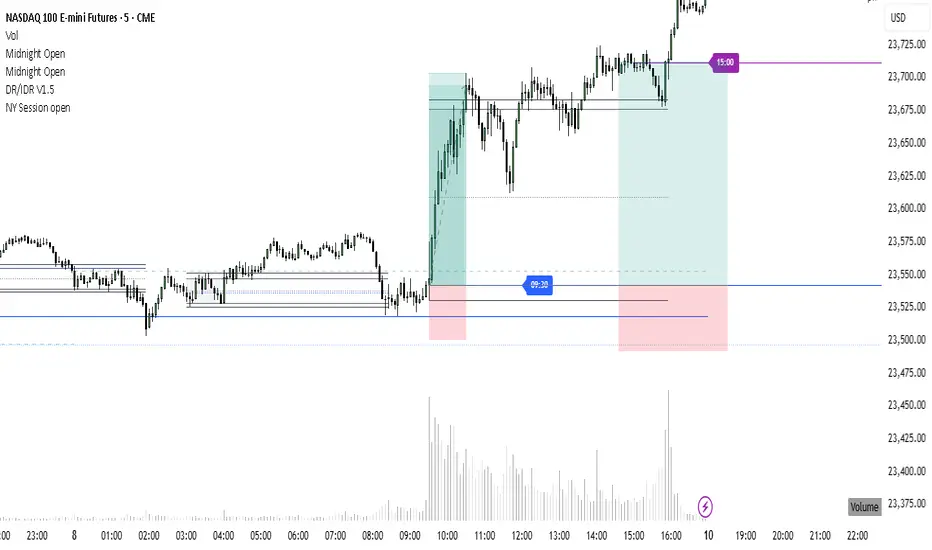
Hourly ORB NY Session (5/15min) - FixedDrawing ORB each hour in NY session
First ORB is 9.30 to 11.00am
then every hour we have a 15 min ORB
11am
12pm
1pm
2pm
3pm
You dont need anything else than this! Simple and powerful

Bangladesh Time Session & Candlestick ConfirmationIt's shows the time when new york and london session colaub with candelstick confarmation.
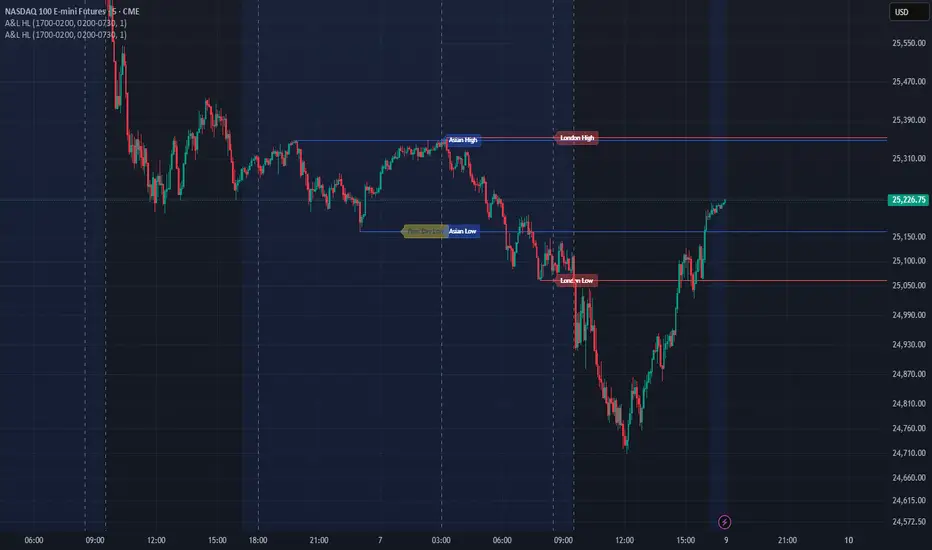
Asian & London Session Highs/LowsThis will help you spot session highs/lows to help you get draws on liq

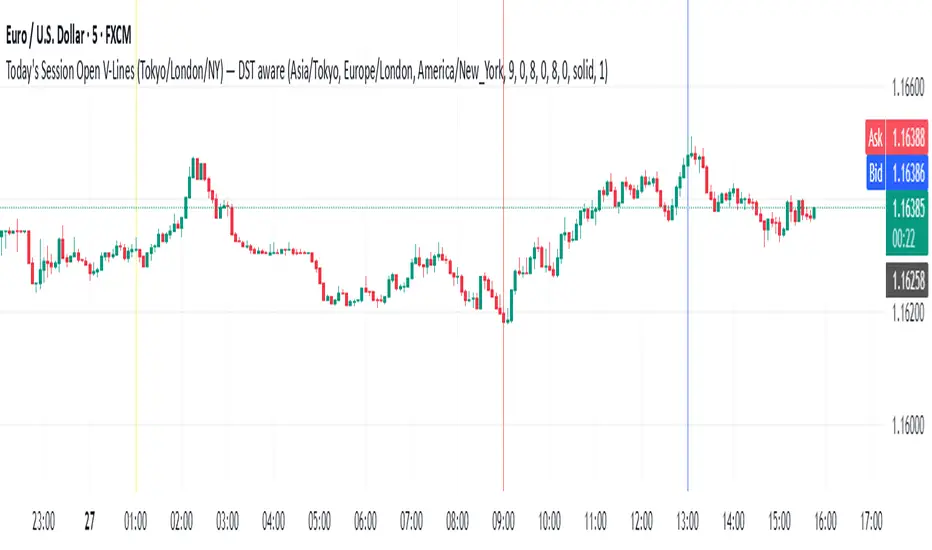
Todays Session Open LN,NYWhen are the Asian, London and New York open for each session simple stuff trading view made me right more stuff so i can publish this what to do c'est la vie
OBR 15min Session Opening Range Breakout + Volume Trend DeltaMLGOBR 15min Session Opening Range Breakout + Volume Trend DeltaMLG

Gold NY Session Key TimesJust showing to us that news come out, open market, close bond for NY Session Time For Indonesia

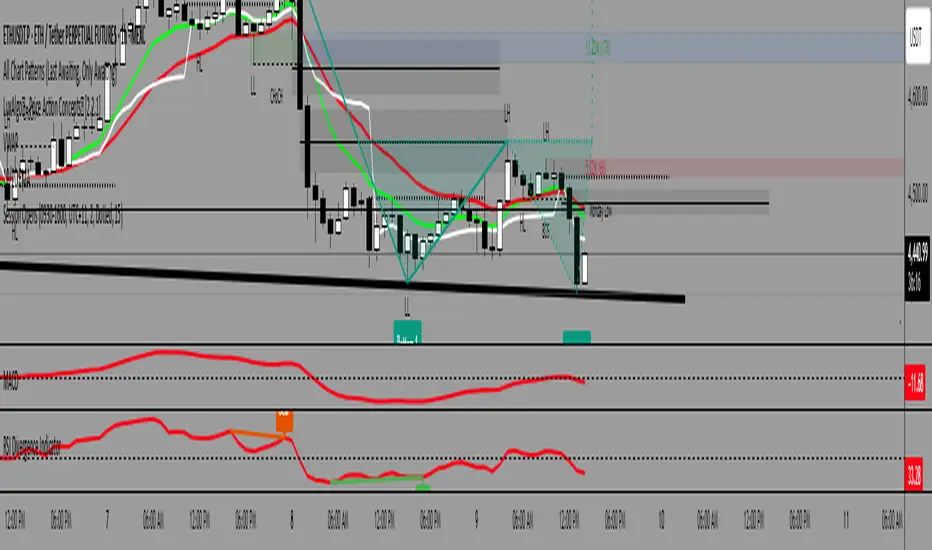
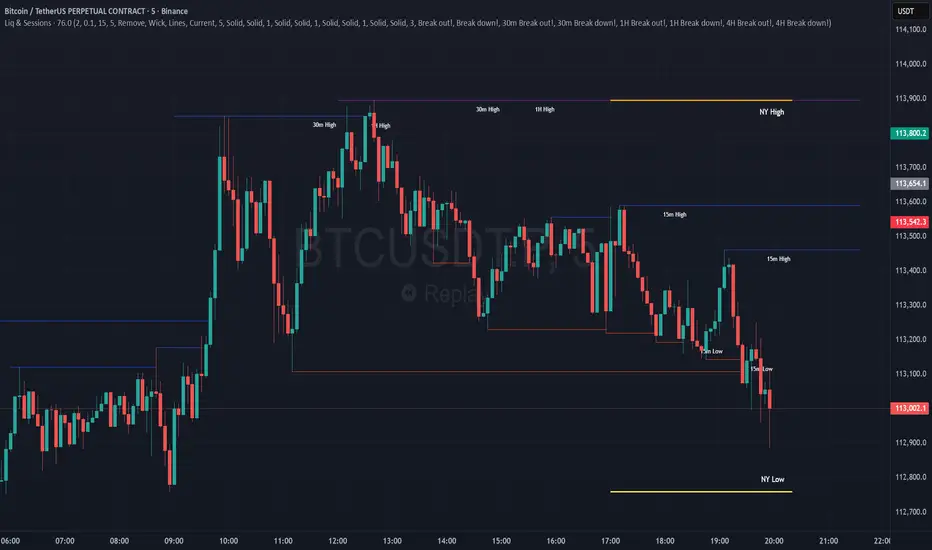
Combined Liquidity & Session LevelsPlots session highs and lows, as well as lower timeframe liquidity levels
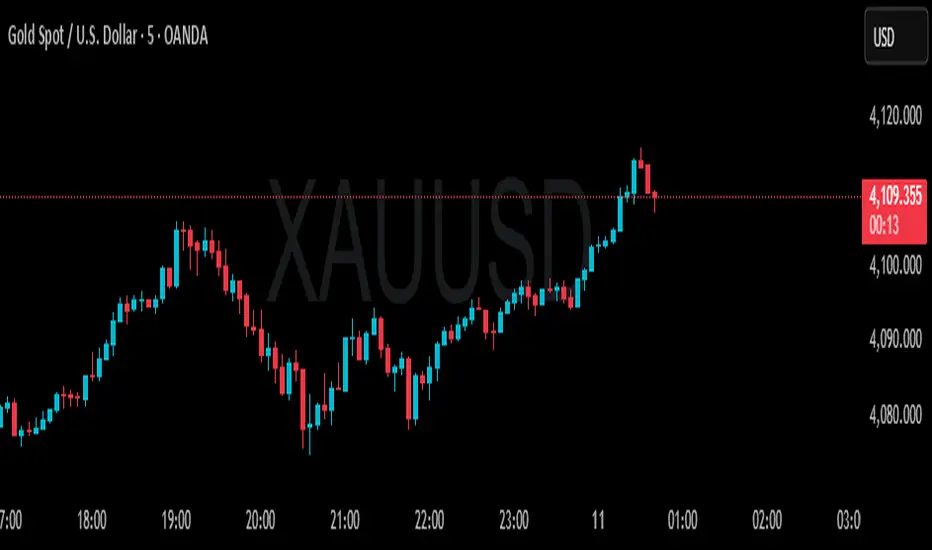
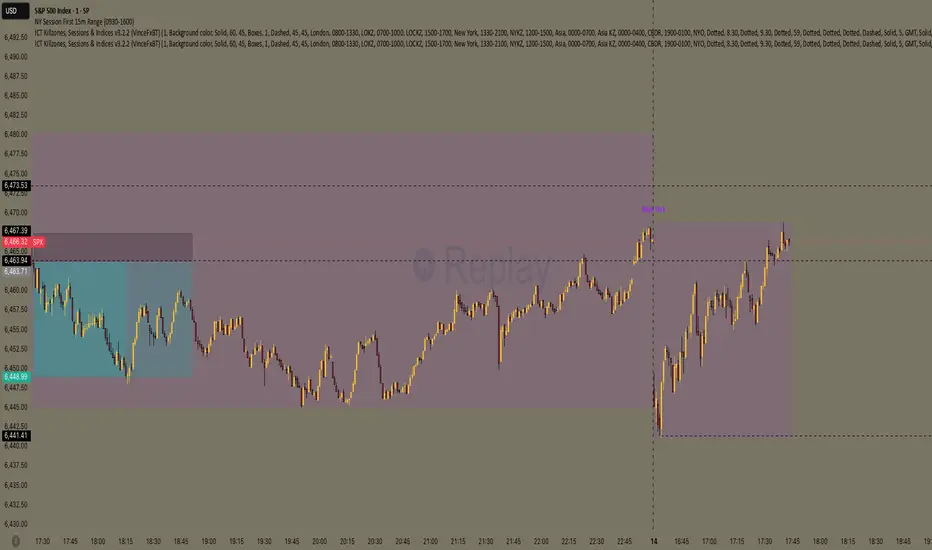
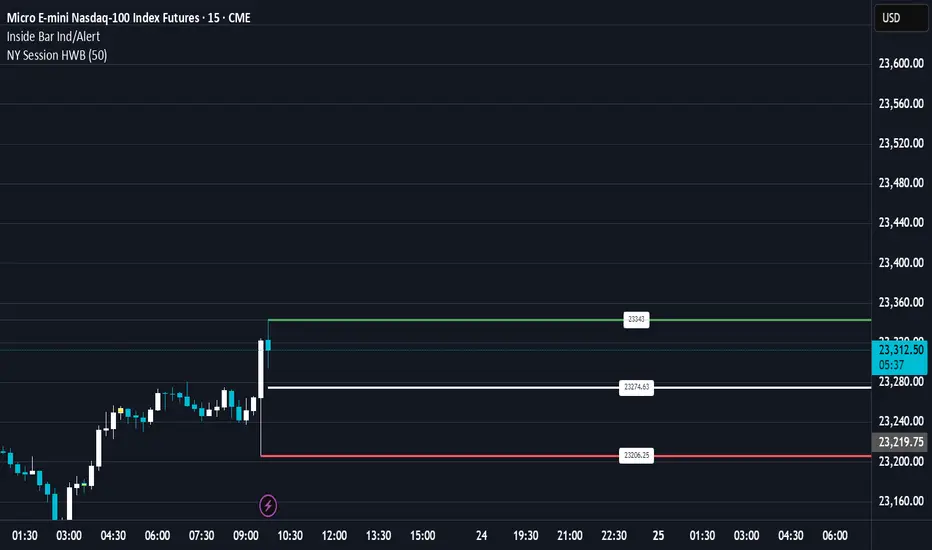
NY Session First 15m Range ORB Strategy first 15m high&low NY session
let you know the high and low of first 15m and the first candle is sitck out of the line you can ride on the wave to make moeny no bul OANDA:XAUUSD SP:SPX

NY Session open 9:30 and bond market close at 15:00NY Session open 9.30 and bond market close at 15:00
xmtr's session highs/lowsMarks Asia & London session highs/lows with precision + PDH/PDL for daily context. Fully customizable & perfect for all traders.

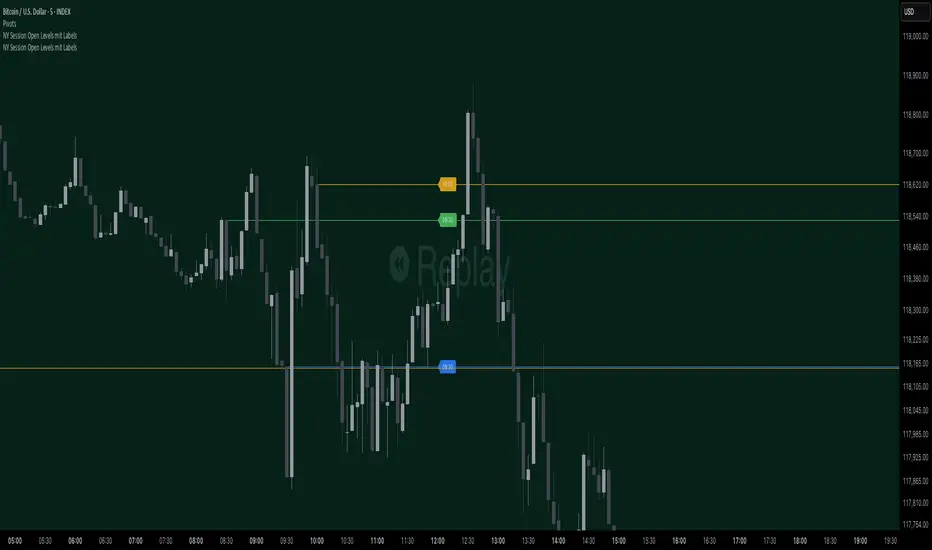
NY Session Open Levels This indicator automatically draws horizontal lines at the opening prices of the New York trading session at 08:30, 09:30, and 10:00 AM NY time. Each line is labeled and extended to the right, providing clear reference points for key intraday levels. The lines and labels reset daily and are ideal for identifying reaction zones during the early U.S. trading hours.

NY Session Open Levels mit LabelsThis indicator automatically draws horizontal lines at the opening prices of the New York trading session at 08:30, 09:30, and 10:00 AM NY time. Each line is labeled and extended to the right, providing clear reference points for key intraday levels. The lines and labels reset daily and are ideal for identifying reaction zones during the early U.S. trading hours.
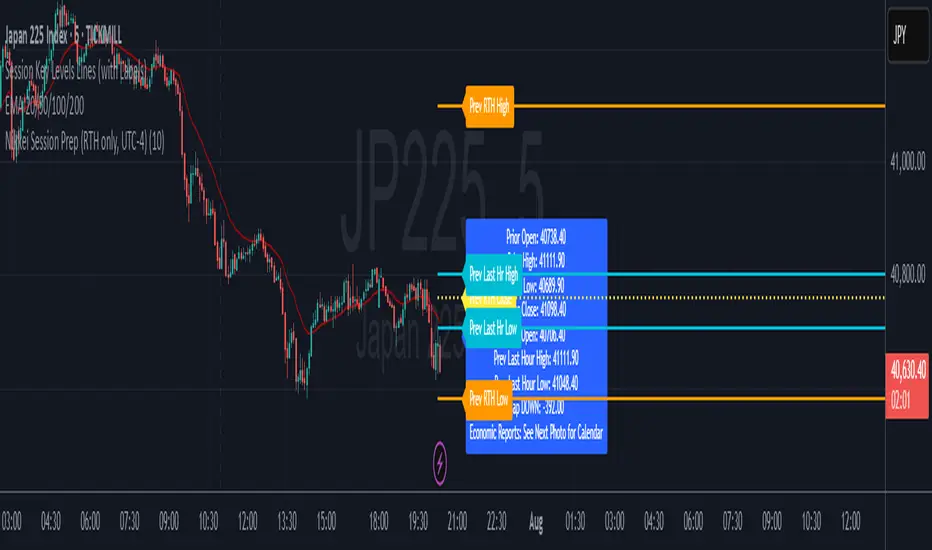
Nikkei Session Key Levels Lines (with Labels) - Nikkei CFDThis is Nikkei Session Key Levels Lines (with Labels) - Nikkei CFD. shows you all the key level lines that you need to be aware. hope it helps :)

Nikkei Session Prep (RTH only, UTC-4)This is Nikkei Session Prep (RTH only, UTC-4). hope it helps :)
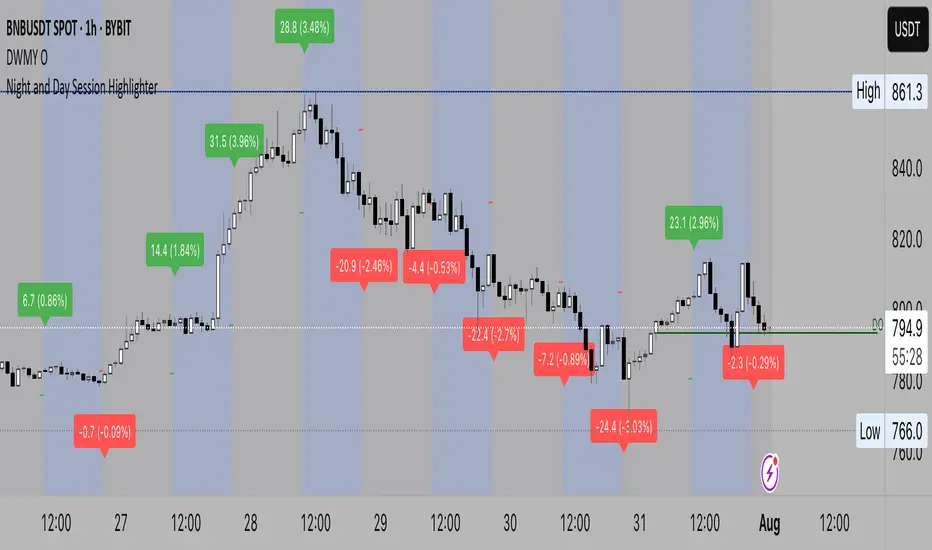
Night Session Highlight (Valehson)Highlights time range from 21:00 to 09:00 with a gray background with 90% transparency.