"session" için komut dosyalarını ara

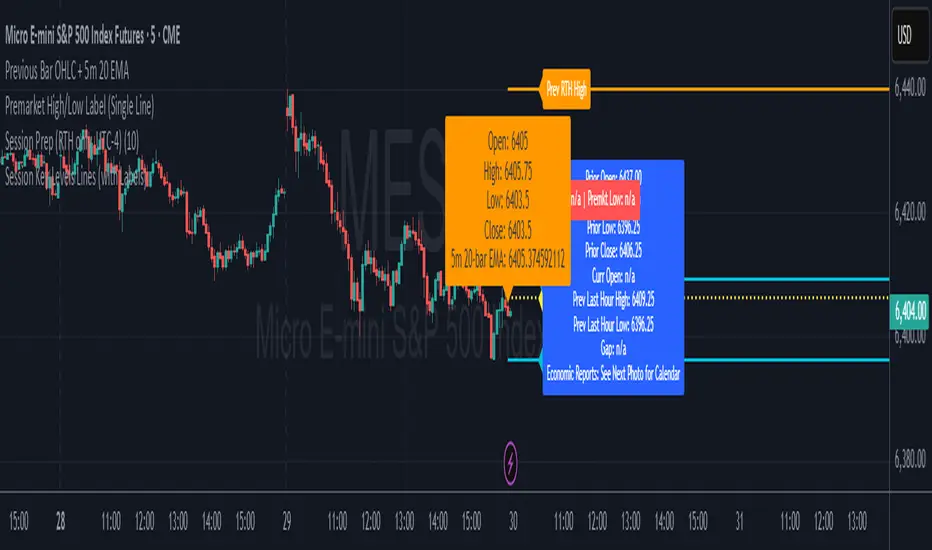
Session Prep (RTH only, UTC-4)This shows what you have to prepare before each session, including Previous session's OHLC, how much is being gapped up...etc. hope it helps :)
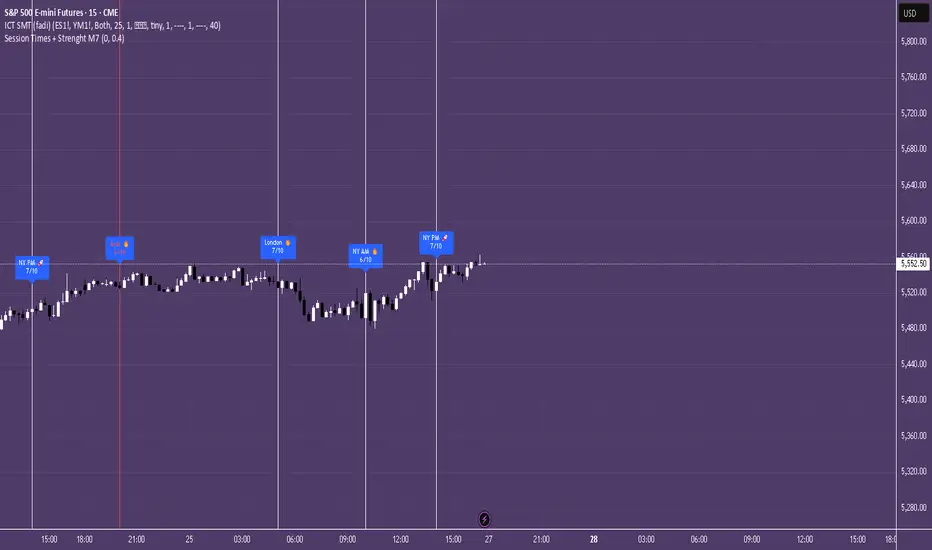
Session Times + Strenght M7This Script Aims to Define Session Times, and Rank those. It can help to adjust your Strategy to Higher Volatility, if you choose to use the Session Volatility and Strenght Index from 1-10. Your timezone on Trading View should be NY. You can customize the Following in Settings: Weight of Volatility & Narrative Regarding the ranking + Transparency of the Lines. SP:SPX FX:EURUSD OANDA:EURUSD CAPITALCOM:USDJPY AMEX:SPY NASDAQ:QQQ TVC:DXY CAPITALCOM:USDJPY CME_MINI:NQ1! OANDA:XAUUSD FX:GBPUSD
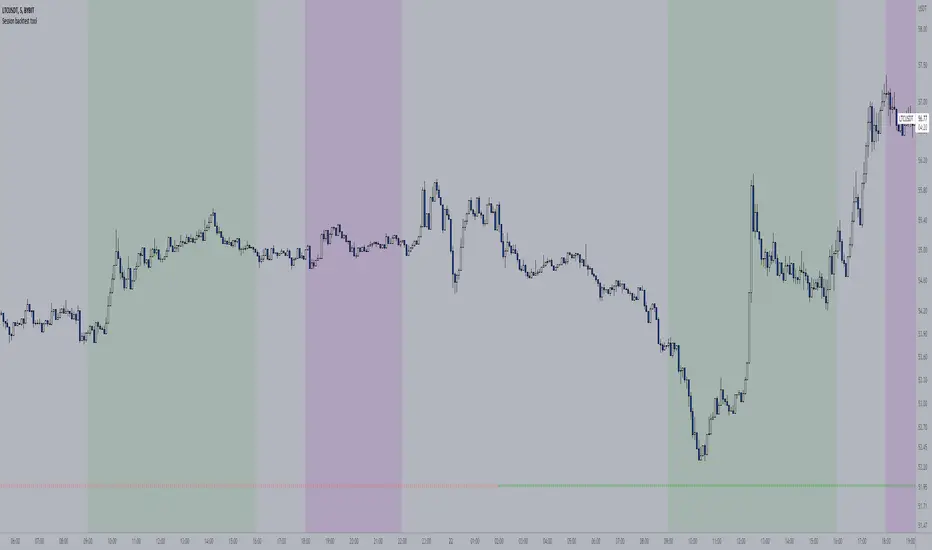
Session backtest toolWith this tool you can easily backtest your trading strategy. You can set the times of a day session and evening session separately. The days of the week were indicated at the bottom of the chart.
For me personally, this saves me a lot of time with back testing. Hopefully I can help you with this too
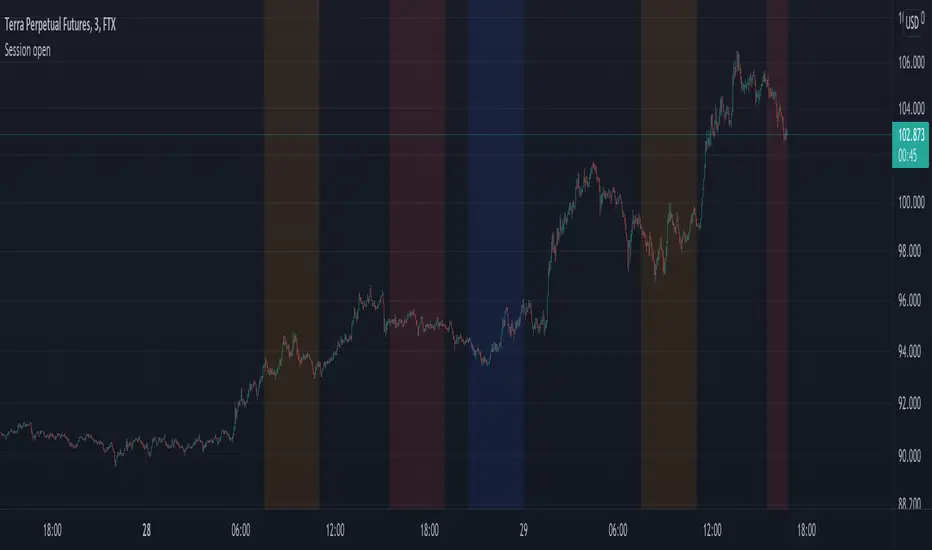
Session openJust a small update to the preset values of the session opening times. Adjusted to 0730-1100 for Tokyo, London and New York respectively.
Note, that if the exchange you view a chart from is not using the UTC time zone, the session open times will differ. Adjust accordingly in the settings.
Session RangesThis is session range indicator with CLEAN code and CLEAR data presentation. There are other range indicators available but when I looked I found them unreliable or making too much screen clutter. WIth mine you can have 3 ranges on screen, measure to bodies or wickes, customise the period, (set your timezone), colours, labels and all that good stuff...
I'm very happy to share it with everyone (and publishing is a great way to archive my code) but ultimately this indicator is by me, for me. Whilst i added a few bells and whistles for everyone this indicator is precisely designed to:
Show me EASILY see what happened in the Asia session and whether we are breaking out with MINIMAL screen clutter. I only use the 3, 15 and 60 - it won't work on the 1, 5, 120 etc because I dont need it to. How I use it is below.
Session Levels (Daily & Weekly Targets)This indicator provides market structure and contextual reference only. It does not generate trade signals, entries, or trading advice.
Plots rolling previous daily and weekly highs/lows as potential target levels. Levels automatically remove once touched (including wicks). Default visibility is NY session with optional toggles for London and Asia. Designed for intraday structure, confluence, and target identification.

Session ATP (Trend Colored)📌 Average Traded Price (ATP) – What It Means
ATP (Average Traded Price) is the weighted average price at which a stock has traded during the session, considering both price and volume.
It tells you where the majority of money has actually traded — not just the candle close.
If price stays above ATP → Buyers are in control
If price stays below ATP → Sellers dominate
ATP is like the intraday fair value of the stock.
📌 How ATP Helps in Trading
ATP gives three major insights:
1️⃣ Strength of Trend (Real Strength)
ATP rises only if strong volume enters at higher prices.
So, a rising ATP confirms genuine bullish strength, not fake moves.
ATP falling confirms real selling pressure, not random dips.
2️⃣ High-Probability Retests
Price often pulls back to ATP before taking the next direction.
Price above ATP → ATP becomes support
Price below ATP → ATP becomes resistance
This makes ATP extremely useful for intraday entries.
3️⃣ Identifying Where Big Players Are Positioned
Since ATP is volume-weighted, it reflects where institutions and big orders traded most.
If price stays above the level where institutions bought → trend is strong
If price stays below their cost → trend is weak
📌 How ATP Indicates Price Direction
In your improved version, ATP is trend-colored:
✔ Green → ATP rising → buyers dominating
✔ Red → ATP falling → sellers dominating
✔ Gray → sideways
Direction rule:
Bullish bias when price > ATP and ATP rising
Bearish bias when price < ATP and ATP falling
No-trade zone when price and ATP are flat / tangled
ATP often acts as:
Magnet in consolidation
Springboard in uptrend
Ceiling in downtrend
This helps you judge whether the move is:
A breakout with strength, or
A fake move without volume support.
🔥 Final Line
ATP is one of the few indicators that shows where the real money is trading, making it an excellent guide for intraday trend confirmation, support/resistance, and entry timing.

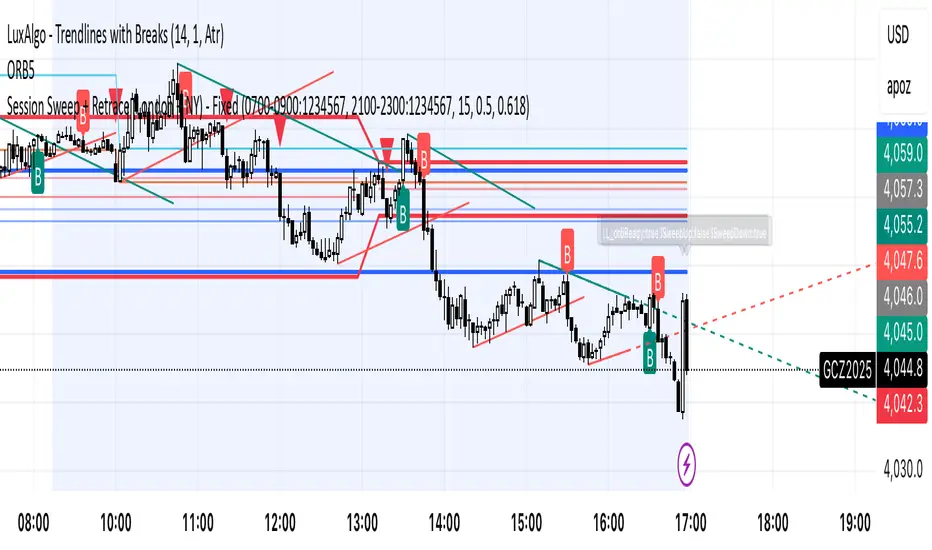
Session Sweep + Retrace (London + NY) - FixedORB Strategy with confluence. This sets out the 5 min session sweep from London and NY, and highlights a test back into the order zone with fib retracement.

Session Anchor Lines (Asia, London, NY)it draws a line at each session open ( in relative to the 4 HR candle )

Session Prep (RTH only, UTC-4)corrected Session Prep (RTH only, UTC-4) now its working properly. hope it helps! :)

Session LiquidityDescribes if markets are liquid enough for institutions to manipulate. Its often difficult to determine if markets will trend or chop, but by looking at how much volume we have at the open, we can determine of the session will be choppy or trendy, and take trades based on that.
Settings predefined for 1m timeframe on SPY. May work with other tickers, but I have not tested it out yet.
Designed for stocks(as of now, may update later)


FxNeel SessionAll types of ICT session you can draw here. Like Asia, London, NY, New Close, CBDR, Asia Kill zone and also Silverbullet Time zone.

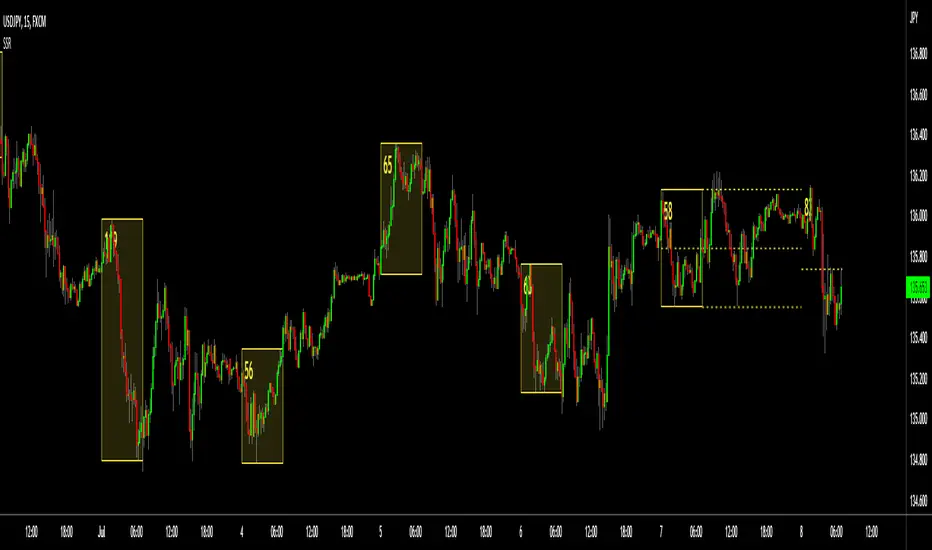
Trading Sessions with Highs and LowsTrading Sessions with Highs and Lows is designed to visually highlight specific trading sessions on the chart, providing traders with key insights into market behavior during these time periods. Here’s a detailed explanation of how the indicator works:
Key Features
1. Session Boxes:
• The indicator plots colored boxes on the chart to represent the price range of defined trading sessions.
• Each box spans the session’s start and end times and encapsulates the high and low prices during that period.
• Two trading sessions are defined by default:
• USA Trading Session: 9:30 AM - 4:00 PM (New York Time).
• UK Trading Session: 8:00 AM - 4:30 PM (London Time).
2. Session Labels:
• The name of the session (e.g., “USA” or “UK”) is displayed above the session box for clear identification.
3. High and Low Markers:
• Markers are added to the chart at the session’s high and low points:
• High Marker: A green label indicating the session high.
• Low Marker: A red label indicating the session low.
4. Dynamic Reset:
• After the session ends, the session high and low values are reset to na to prepare for the next trading day.
5. Customizable Background Colors:
• Each session’s box has a distinct, semi-transparent background color for better visual separation.
How It Works
1. Core Functionality:
• A function, plot_box, takes the session name, start time, end time, and background color as input.
• It calculates whether the current time is within the session.
• During the session:
• It tracks the session’s highest and lowest prices.
• It identifies the bars where the high and low occurred.
• At the session’s end:
• It plots a box on the chart covering the session’s time and price range.
• Labels are created for the session name and its high/low points.
2. Session Timing:
• Timestamps for the USA and UK trading sessions are calculated using the timestamp function with respective time zones.
3. Visual Elements:
• The box.new function draws the session boxes on the chart.
• The label.new function creates session name and high/low labels.
Usage
• Overlay Mode: The indicator is applied directly on the price chart (overlay=true), making it easy to visualize session-specific price behavior.
• Trading Strategy:
• Identify session-specific support and resistance levels.
• Observe price action trends during key trading periods.
• Align trading decisions with session dynamics.
Customization
While the indicator is preset for the USA and UK trading sessions, it can be easily modified:
1. Add/Remove Sessions: Define additional sessions by providing their start and end times.
2. Change Colors: Update the background_color in the plot_box calls to use different colors for sessions.
3. Adjust Time Zones: Replace the current time zones with others relevant to your trading style.
Visualization Example
• USA Session:
• Time: 9:30 AM - 4:00 PM (New York Time).
• Box Color: Semi-transparent orange.
• UK Session:
• Time: 8:00 AM - 4:30 PM (London Time).
• Box Color: Semi-transparent green.
Why Use This Indicator?
1. Market Awareness: Easily spot price behavior during high-liquidity trading periods.
2. Trend Analysis: Analyze how sessions overlap or affect each other.
3. Session Boundaries: Use session high/low levels as dynamic support and resistance zones.
This indicator is an essential tool for intraday and swing traders who want to align their strategies with key market timings.

Market Sessions - by Alexander RottasMarket Sessions - Alexander Rottas
This TradingView indicator displays market sessions for USA, EUROPE, and ASIA on your chart. It provides a clear and intuitive way to identify the active market periods, making it easier to plan your trades.
Features:
Session Display: Optionally show market sessions for USA, EUROPE, and ASIA.
Customizable Timings: Set start and end times in UTC for each market session.
Visual Indicators: Color-coded squares indicate active sessions and their combinations:
USA Session: Blue
EUROPE Session: Purple
ASIA Session: Dull Orange
Combined Sessions: Lighter shades to show overlapping sessions
Session Labels: Dynamic labels at the start of each session to easily identify session beginnings on weekdays.
User-Friendly Design: This indicator is designed to be non-intrusive and easy to use, with a simple setup and clear visual cues. Unlike other complex tools, it integrates seamlessly into your chart without overwhelming your view, making it an ideal choice for traders seeking a straightforward way to track market sessions.
DISCLAIMER: This script is provided for educational purposes only. It cannot be used for commercial purposes or plagiarized. All rights reserved by the author. Unauthorized use or distribution of this script is prohibited. For more details, please contact the author directly.

ICT Session by LasinsName: ICT Session by Lasins
Purpose: To visually identify and differentiate between the Asian, London, and New York trading sessions on the chart.
Features:
Highlights the background of the chart during each session.
Includes a mini dashboard in the top-right corner to show the active session.
Allows customization of time zones (exchange timezone or UTC).
Displays copyright and author information.
Key Components
Inputs:
useExchangeTimezone: A boolean input to toggle between using the exchange timezone or UTC for session times.
showDashboard: A boolean input to toggle the visibility of the mini dashboard.
Session Times:
The script defines three trading sessions:
Asian Session: 2000-0000 UTC (or adjusted for exchange timezone).
London Session: 0200-0500 UTC (or adjusted for exchange timezone).
New York Session: 0700-1000 UTC (or adjusted for exchange timezone).
Session Detection:
The is_session function checks if the current time falls within a specified session using the time function.
Background Coloring:
The bgcolor function is used to highlight the chart background during each session:
Asian Session: Red background.
London Session: Green background.
New York Session: Blue background.
Mini Dashboard:
A table is created in the top-right corner of the chart to display the active session and its corresponding color.
The dashboard includes:
A header row with "Session" and "Color".
Rows for each session (Asian, London, New York) with their respective colors.
Copyright and Author Information:
A label is added to the chart to display the copyright and author information ("© ICT Session by Lasins Raj").
How It Works
The script checks the current time and compares it to the predefined session times.
If the current time falls within a session, the chart background is highlighted with the corresponding color.
The mini dashboard updates to reflect the active session.
The copyright and author information is displayed at the bottom of the chart.
Customization
You can adjust the session times in the script to match your preferred timezone or trading hours.
The useExchangeTimezone input allows you to switch between UTC and the exchange timezone.
The showDashboard input lets you toggle the visibility of the mini dashboard.
Example Use Case
Traders who follow the ICT (Inner Circle Trader) methodology can use this indicator to identify key trading sessions and plan their trades accordingly.
The visual representation of sessions helps traders quickly recognize when major markets are open and active.

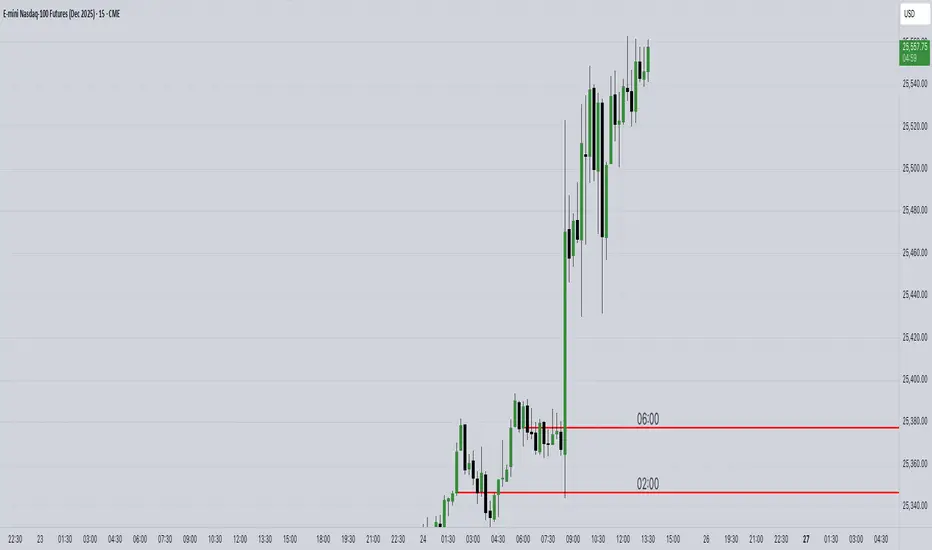
Dual Session ORB S/R Lines Pro by Yendor_BShort description:
Clean opening-range breakout support/resistance lines for London and US sessions with confirmed breakout labels and alert-ready signals. UTC-based, adjustable start point, customizable styling, minimal clutter.
Detailed description:
What it does:
Captures the Opening Range (default first 15 minutes) for London and New York (US) sessions in UTC, plots the high and low as support/resistance lines, and marks confirmed breakouts when price closes beyond those levels. Lines can begin at either the range end or session start and persist for the configured session length.
Key Features:
ORB defined over the first N minutes after session open (configurable, default 15).
Two sessions: London and US (New York) with separate start times.
High/low support & resistance lines per session:
Selectable start point: Range End or Session Start.
Independently customizable color, width, and style (solid/dashed/dotted) for each high and low.
Confirmed breakout labels: only on the first candle that closes beyond the ORB high or low after the range completes (prior close must be inside).
Alerts and alertconditions for breakout long/short per session, usable in TradingView’s alert dialog.
Fully UTC-based. Works on any timeframe; 1-minute or 5-minute recommended for precision.
Minimal visual clutter; no persistent shaded boxes in this version.
Inputs explained:
ORB Duration (minutes): Length of the opening range used to calculate session high and low.
Session Length (hours): How long the S/R lines remain active (typically full session).
London / US Start (UTC): Session open times in UTC.
Line Start Point: Choose whether the lines begin at the range end or at the session start.
High/Low Styling: Independent color, thickness, and style for each session’s high and low.
Breakout Labels: Toggle one-time confirmed breakout annotations.
Alerts: Enable breakout alert messages.
Example workflows:
Monitor the first 15 minutes of the London session.
After the range, wait for a candle to close beyond the high or low for a confirmed breakout.
Use the label or alert to trigger entry logic (retest, continuation, etc.).
Repeat for the US session; compare overlaps for higher conviction.
Alert setup:
Open the Alerts panel. Choose one of the built-in alertconditions: London Breakout Long, London Breakout Short, US Breakout Long, US Breakout Short. Set frequency to Once Per Bar Close. Customize notification/webhook payload if automating.
Preset suggestions:
Standard London ORB: 15 minute range, lines from range end, green high / lime low.
Standard US ORB: 15 minute range, lines from range end, blue high / aqua low.
Overlap Bias: Both sessions active, lines start from session start, differentiated styles.
Tips & best practices:
Combine with external volume or volatility filters to reduce false breakouts. Use on correlated pairs to observe consistent session structure. Treat broken ORB levels as flipped support/resistance on revisit. Prefer confirmed closes beyond lines rather than wick touches.
Limitations / disclaimer:
Provides structural visualization and breakout signaling; does not guarantee profitability. Always apply proper risk management and confirm with additional context. Backtest settings before live use.
Tags:
#ORB #OpeningRangeBreakout #SessionTrading #LondonSession #NewYorkSession #SupportResistance #Breakout #Intraday #Pinev6 #TradingView #Forex #TrendStructure #Alerts #USD #EURUSD #TradingSignals #UTCBased #PriceAction #MarketStructure #IntradayBreakouts

Price Volume Heatmap [MHA Finverse]Price Volume Heatmap - Advanced Volume Profile Analysis
Unlock the power of institutional-level volume analysis with the Price Volume Heatmap indicator. This sophisticated tool visualizes market structure through volume distribution across price levels, helping you identify key support/resistance zones, high-probability reversal areas, and optimal entry/exit points.
🎯 What Makes This Indicator Unique?
Unlike traditional volume indicators that only show volume over time, this heatmap displays volume distribution across price levels , revealing where the most significant trading activity occurred. The gradient coloring system instantly highlights high-volume nodes (areas of strong interest) and low-volume nodes (potential breakout zones).
📊 Core Features
1. Dynamic Volume Heatmap
- Visualizes volume concentration across 250 customizable price levels
- Gradient color scheme from high volume (white) to low volume (teal/green)
- Adjustable brightness multiplier for enhanced contrast and clarity
- Real-time updates as market conditions evolve
2. Point of Control (POC)
- Automatically identifies the price level with the highest traded volume
- Acts as a magnetic price level where markets often return
- Critical for identifying fair value areas and potential reversal zones
- Customizable line style, width, and color
3. Flexible Lookback Settings
- Lookback Bars: Set any value from 1-5000 bars to control analysis depth
- Visible Range Mode: Analyze only what's currently visible on your chart
- Timeframe-Specific Settings: Different lookback periods for 1m, 5m, 15m, 30m, 1h, Daily, and Weekly charts
- Adapts to your trading style - scalping to position trading
4. Session Separation Analysis
- Tokyo Session: 00:00-09:00 UTC
- London Session: 07:00-16:00 UTC
- New York Session: 13:00-22:00 UTC
- Sydney Session: 21:00-06:00 UTC
- Daily Reset: Analyze each trading day independently
Session separation allows you to understand volume distribution specific to each major trading session, revealing institutional order flow patterns and session-specific support/resistance levels.
5. Profile Width Options
- Dynamic: Profile width adjusts based on lookback period
- Fixed Bars: Set a specific bar count for consistent profile width
- Extend Forward: Project the profile into future bars for planning trades
6. Smart Alerts
- POC crossover/crossunder alerts
- New session start notifications
- Never miss critical price action at high-volume nodes
📈 How to Use This Indicator Professionally
Understanding Market Structure:
High Volume Nodes (HVN):
- Appear as bright/white areas in the heatmap
- Represent price levels where significant trading occurred
- Act as strong support/resistance zones
- Markets often consolidate or bounce from these levels
- Trading Strategy: Look for entries when price tests HVN areas with confluence from other indicators
Low Volume Nodes (LVN):
- Appear as darker/teal areas in the heatmap
- Represent price levels with minimal trading activity
- Price tends to move quickly through these areas
- Often form "gaps" in the volume profile
- Trading Strategy: Expect rapid price movement through LVN zones; avoid placing stop losses here
Point of Control (POC):
- The single most important price level in your analysis window
- Represents the fairest price where maximum volume traded
- Price gravitates toward POC like a magnet
- Trading Strategy:
* When price is above POC: bullish bias, POC acts as support
* When price is below POC: bearish bias, POC acts as resistance
* POC breaks often lead to significant trend changes
Session-Based Analysis:
Use session separation to understand how different market participants trade:
Asian Session (Tokyo/Sydney):
- Typically lower volatility and range-bound
- Volume profiles often show tight, balanced distribution
- Use for identifying overnight ranges and gap fill zones
London Session:
- Highest volume session for forex pairs
- Often shows strong directional bias
- Look for breakouts from Asian ranges during London open
New York Session:
- Maximum participation when overlapping with London
- Institutional order flow most visible
- POC during NY session often becomes key level for following sessions
🎯 Practical Trading Applications
1. Identifying Support & Resistance:
High volume nodes from the heatmap are far more reliable than traditional swing highs/lows. When price approaches an HVN, expect reaction - either a bounce or a significant breakout if breached.
2. Trend Confirmation:
- Healthy uptrend: POC rising over time, HVN forming at higher levels
- Healthy downtrend: POC falling over time, HVN forming at lower levels
- Consolidation: POC relatively flat, volume balanced across range
3. Breakout Trading:
When price breaks through a Low Volume Node with momentum, it often continues to the next High Volume Node. Use LVN areas as measured move targets.
4. Reversal Zones:
Multiple HVN stacking on top of each other creates a "volume shelf" - an extremely strong support/resistance zone where reversals are highly probable.
5. Risk Management:
- Place stops beyond HVN areas (not within LVN zones)
- Size positions based on distance to nearest HVN
- Use POC as trailing stop level in trending markets
⚙️ Recommended Settings
For Day Trading (Scalping/Intraday):
- Lookback: 200-500 bars
- Rows: 200-250
- Enable session separation for your primary trading session
- Profile Width: Dynamic or Fixed Bars (30-50)
For Swing Trading:
- Lookback: 500-1000 bars
- Rows: 250
- Session separation: Daily Reset
- Profile Width: Dynamic
For Position Trading:
- Lookback: 1000-3000 bars
- Rows: 250
- Use timeframe-specific settings
- Profile Width: Extend Forward (20-50 bars)
💡 Pro Tips
1. Combine this indicator with price action analysis - volume confirms what price is telling you
2. Watch for POC convergence with other technical levels (fibonacci, pivot points, moving averages)
3. Volume at extremes (tops/bottoms of heatmap) often indicates exhaustion
4. Session POC from previous sessions often acts as magnet for current session
5. Increase brightness multiplier (1.5-2.5) for clearer visualization on busy charts
6. Use "Number of Sessions to Display" to analyze consistency of volume levels across multiple sessions
🎨 Customization
Fully customizable visual appearance:
- Gradient colors for volume visualization
- POC line thickness, color, and style
- Session line colors and visibility
- All settings organized in intuitive groups
⚠️ Disclaimer
This indicator is a technical analysis tool and should not be used as the sole basis for trading decisions. Always combine volume analysis with proper risk management, fundamental analysis, and other technical indicators. Past performance does not guarantee future results.
---
Support & Updates
Regular updates and improvements are made to enhance functionality. For questions, suggestions, or bug reports, please use the comments section below.
Happy Trading! 📊💹

Recent Session High Low Marker - SimpleDescription:
This Pine Script marks the high and low points of the most recent trading sessions: Asian, London, and New York.
Asian Session: From 19:00 to 21:00 New York time (UTC-4).
London Session: From 02:00 to 05:00 New York time (UTC-4).
New York Session: From 07:00 to 10:00 New York time (UTC-4).
For each session, the script draws two lines:
One for the high of the session.
One for the low of the session.
The lines are drawn horizontally across the chart, making them easy to spot. Each session is marked by two lines with specific colors:
Orange for the Asian session.
Blue for the London session.
Purple for the New York session.
The lines are dynamically updated during the active session, and they will reset when the next session begins. The width of the lines is set to 2 to ensure they are visible without being too thick.
Credits:
Script created by Jdv.
