Daily Open [Kintsugi Trading]Daily Open
The "Daily Open" indicator by Kintsugi Trading is designed to give traders clear and immediate access to daily open prices, enhancing their ability to spot key market levels and make informed trading decisions. The indicator dynamically changes the color of the plotted line based on the current price's relationship to the opening price of the regular market session. This visual aid helps traders quickly assess whether the current price is trading above or below the opening price of the session.
Key Features:
Daily Open Visualization: Automatically plots the daily open price on your chart, providing a clear reference point for daily price action.
Configurable Market Open Time: The indicator allows users to input the start time of the regular market session (default is set to 9:30 AM).
Color-Coded: The indicator dynamically adjusts the color of the daily open line and price labels based on whether the price is above or below the open, giving you quick visual cues about market sentiment.
Customization Options: Users can modify the line's appearance, including the color and style, to better fit their chart preferences.
Ideal For:
This indicator is particularly useful for day traders and those looking to closely monitor price action in relation to the market's opening level. It serves as a quick reference point for identifying potential bullish or bearish sentiment throughout the trading day.
Good luck with your trading!
"session" için komut dosyalarını ara

RH_Previous Session CloseRaghee Horner Previous Session Close (PSC)
The RH_PSC is an automated Previous Session Close (PSC) indicator to show, at a glance, general market sentiment -- whether the market is generally bullish, bearish or neutral --for the current trading session.
The PSC plots the previous session close from the Daily candle, with a customizable table of data to show the previous price, whether or not the current price is above or below that previous close and the percentage move above or below.
It includes the ability to enable only the last session or to plot for all previous sessions continuously.
The data table is configurable for bearish, bullish or sideways coloring and can be moved to different locations to suite users preferences and charts. It can also be fully disabled.
Defaults are to show all previous sessions in a continuous plot and the data table is disabled.
What is “sentiment”?
Market sentiment reflects investors’ overall attitude toward a symbol, influenced by news, economic reports, and perceptions. It can be bullish, bearish, or neutral and significantly affects trading behavior and price movements. Bullish sentiment typically drives prices up, while bearish sentiment can cause them to fall. Understanding market sentiment is key for trend follow-through.
Why does it matter?
Effectively using sentiment allows for quicker, smarter trading decisions. As an active trader, understanding market sentiment is vital for follow-through. It shows real-time investor feelings, affecting price movements. Gauging sentiment helps you:
Anticipate Breakouts.
Time Entries and Exits.
Increase Probability of Continuation.

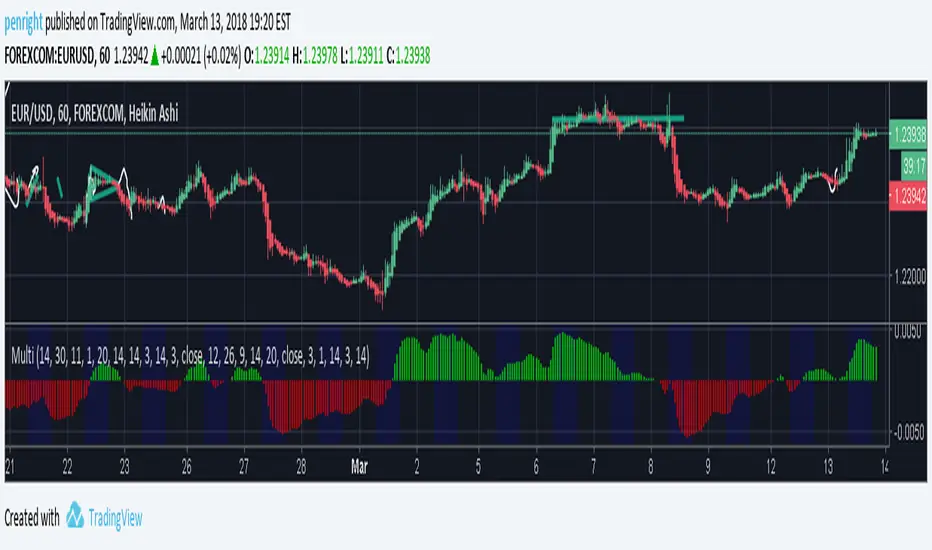
A Multi 10 indicatorREAD NOTE BEFORE APPLYING or you may think indicator doesnt work.
This indicator is a revise of another i made and contains 10 Optional Indicators allowing you to load more then 3 indicators at once if you so choose and dont pay for the platform!
Hopefully someone will find use for this script besides me :) I dont suggest turning all on at once because it
will not look right. Alot will overlap if you wish but i only use the Session and trend bar at once in
conjuction with a Oscillator setting like MacD , RSI , Stoch , Aroon or CCI .
In the chart you see i only have a few indicators active ENJOY!!
---------- NOTE ----------- ( Everything is OFF by default and indicator SHOULD show up BLANK when loaded) ------------ NOTE -------------
(Can turn EVERYTHING on AND change any values in the format tab once indicator loads)
Indicators included are listed below
Sessions, including, NY session, Aussie session, Asian session, and Europe market sessions.
MacD Split Colored , aroon oscillator
CCI Oscillator , classic aroon
RSI Oscillator , Elliot wave
Stoch RSI Oscillator , ATR%
My own Trend bar
---------- NOTE ----------- ( Everything is OFF by default and indicator SHOULD show up BLANK when loaded) ------------ NOTE -------------
(Can turn EVERYTHING on AND change any values in the format tab once indicator loads) CODE probably looks messey but this is something i made for me so i didnt really care lol
RiskCraft - Advanced Risk Management SystemRiskCraft – Risk Intelligence Dashboard
Trade like you actually respect risk
"I know the setup looks good… but how much am I actually risking right now?"
RiskCraft is an open-source Pine Script v6 indicator that keeps risk transparent directly on the chart. It is not a signal generator; it is a risk desk that calculates size, frames volatility, and reminds you when your behaviour drifts away from the plan.
Core utilities
Calculates professional-style position sizing in real time.
Reads volatility and market regime before position size is confirmed.
Adjusts risk based on the trader’s emotional state and confidence inputs.
Maps session risk across Asian, London, and New York hours.
Draws exactly one stop line and one target line in the preferred direction.
Provides rotating education tips plus contextual warnings when risk escalates.
It is intentionally conservative and keeps you in the game long enough for any separate entry logic to matter.
---
Chart layout checklist
Use a clean chart on a liquid symbol (e.g., AMEX:SPY or major FX pairs).
Main RiskCraft dashboard placed on the right edge.
Session Risk box on the left with UTC time visible.
Floating risk badge above price.
Stop/target guide lines enabled.
Education panel visible in the bottom-right corner.
---
1. On-chart components
Right-side dashboard : account risk %, position size/value, stop, target, risk/reward, regime, trend strength, emotional state, behavioural score, correlation, and preferred trade direction.
Session Risk box : highlights active session (Asian, London, NY), current UTC time, and risk label (High/Med/Low) per session.
Floating risk badge : keeps actual account risk percent visible with colour-coded wording from Ultra Cautious to Very Aggressive.
Stop/target lines : exactly one dashed stop and one dashed target aligned with the preferred bias.
Education panel : rotates core principles and AI-style warnings tied to volatility, risk %, and behaviour flags.
---
2. Volatility engine – ATR with context 📈
atr = ta.atr(atrLength)
atrPercent = (atr / close) * 100
atrSMA = ta.sma(atr, atrLength)
volatilityRatio = atr / atrSMA
isHighVol = volatilityRatio > volThreshold
ATR vs ATR SMA shows how wild price is relative to recent history.
Volatility ratio above the threshold flips isHighVol , which immediately trims risk.
An ATR percentile rank over the last 100 bars indicates calm versus chaotic regimes.
Daily ATR sampling via request.security() gives higher time-frame context for intraday sessions.
When volatility spikes the script dials position size down automatically instead of cheering for maximum exposure.
---
3. Market regime radar – Danger or Drift 🌊
ema20 = ta.ema(close, 20)
ema50 = ta.ema(close, 50)
ema200 = ta.ema(close, 200)
trendScore = (close > ema20 ? 1 : -1) +
(ema20 > ema50 ? 1 : -1) +
(ema50 > ema200 ? 1 : -1)
= ta.dmi(14, 14)
Regimes covered:
Danger : high volatility with weak trend.
Volatile : volatility elevated but structure still directional.
Choppy : low ADX and noisy action.
Trending : directional flows without extreme volatility.
Mixed : anything between.
Each regime maps to a 1–10 risk score and a multiplier that feeds the final position size. Danger and Choppy clamp size; Trending restores normal risk.
---
4. Behaviour engine – trader inputs matter 🧠
You provide:
Emotional state : Confident, Neutral, FOMO, Revenge, Fearful.
Confidence : slider from 1 to 10.
Toggle for behavioural adjustment on/off.
Behind the scenes:
Each state triggers an emotional multiplier .
Confidence produces a confidence multiplier .
Combined they form behavioralFactor and a 0–100 Behavioural Score .
High-risk emotions or low conviction clamp the final risk. Calm inputs allow normal size. The dashboard prints both fields to keep accountability on-screen.
---
5. Correlation guardrail – avoid stacking identical risk 📊
Optional correlation mode compares the active symbol to a reference (default AMEX:SPY ):
corrClose = request.security(correlationSymbol, timeframe.period, close)
priceReturn = ta.change(close) / close
corrReturn = ta.change(corrClose) / corrClose
correlation = calcCorrelation()
Absolute correlation above the threshold applies a correlation multiplier (< 1) to reduce size.
Dashboard row shows the live correlation and reference ticker.
When disabled, the row simply echoes the current symbol, keeping the table readable.
---
6. Position sizing engine – heart of the script 💰
baseRiskAmount = accountSize * (baseRiskPercent / 100)
adjustedRisk = baseRiskAmount * behavioralFactor *
regimeAdjustment * volAdjustment *
correlationAdjustment
finalRiskAmount = math.min(adjustedRisk,
accountSize * (maxRiskCap / 100))
stopDistance = atr * atrStopMultiplier
takeProfit = atr * atrTargetMultiplier
positionSize = stopDistance > 0 ? finalRiskAmount / stopDistance : 0
positionValue = positionSize * close
Outputs shown on the dashboard:
Position size in units and value in currency.
Actual risk % back on account after adjustments.
Risk/Reward derived from ATR-based stop and target.
---
7. Intelligent trade direction – bias without signals 🎯
Direction score ingredients:
EMA stack alignment.
Price versus EMA20.
RSI momentum relative to 50.
MACD line vs signal.
Directional Movement (DI+/DI–).
The resulting Trade Direction row prints LONG, SHORT, or NEUTRAL. No orders are generated—this is guidance so you only risk capital when the structure supports it.
---
8. Stop/target guide lines – two lines only ✂️
if showStopLines
if preferLong
// long stop below, target above
else if preferShort
// short stop above, target below
Lines refresh each bar to keep clutter low.
When the direction score is neutral, no lines appear.
Use them as visual anchors, not auto-orders.
---
9. Session Risk map – global volatility clock 🌍
Tracks Asian, London, and New York windows via UTC.
Computes average ATR per session versus global ATR SMA.
Labels each session High/Med/Low and colours the cells accordingly.
Top row shows the active session plus current UTC time so you always know the regime you are trading.
One glance tells you whether you are trading quiet drift or the part of the day that hunts stops.
---
10. Floating risk badge – honesty above price 🪪
Text ranges from Ultra Cautious through Very Aggressive.
Colour matches the risk palette inputs (High/Med/Low).
Updates on the last bar only, keeping historical clutter off the chart.
Account risk becomes impossible to ignore while you stare at price.
---
11. Education engine & warnings 📚
Rotates evergreen principles (risk 1–2%, journal trades, respect plan).
Triggers contextual warnings when volatility and risk % conflict.
Flags when emotional state = FOMO or Revenge.
Highlights sub-standard risk/reward setups.
When multiple danger flags stack, an AI-style warning overrides the tip text so you can course-correct before capital is exposed.
---
12. Alerts – hard guard rails 🚨
Excessive Risk Alert : actual risk % crosses custom threshold.
High Volatility Alert : ATR behaviour signals danger regime.
Emotional State Warning : FOMO or Revenge selected.
Poor Risk/Reward Alert : risk/reward drops below your standard.
All alerts reinforce discipline; none suggest entries or exits.
---
13. Multi-market behaviour 🕒
Intraday (1m–1h): session box and badge react quickly; ideal for scalpers needing constant risk context.
Higher time frames (1D–1W): dashboard shifts slowly, supporting swing planning.
Asset classes confirmed in validation: crypto majors, large-cap equities, indices, major FX pairs, and liquid commodities.
Risk logic is price-based, so it adapts across markets without bespoke tuning.
15. Key inputs & recommended defaults
Account Size : 10,000 (modify to match actual account; min 100).
Base Risk % : 1.0 with a Maximum Risk Cap of 2.5%.
ATR Period : 14, Stop Multiplier 2.0, Target Multiplier 3.0.
High Vol Threshold : 1.5 for ATR ratio.
Behavioural Adjustment : enabled by default; disable for fixed risk.
Correlation Check : optional; default symbol AMEX:SPY , threshold 0.7.
Display toggles : main dashboard, risk badge, session map, education panel, and stop lines can be individually disabled to reduce clutter.
16. Usage notes & limits
Indicator mode only; no automated entries or exits.
Trade history panel intentionally disabled (requires strategy context).
Correlation analysis depends on additional data requests and may lag slightly on illiquid symbols.
Session timing uses UTC; adjust expectations if you trade localized instruments.
HTF ATR sampling uses daily data, so bar replay on lower charts may show brief data gaps while HTF loads.
What does everyone think RISK really means?

Time Range Marker By BCB ElevateThe Time Range Marker is a simple yet powerful visual tool for traders who want to focus on specific time intervals within the trading day. This indicator highlights a custom time range on your chart using a background color, helping you visually isolate key trading sessions or event windows such as:
Market open/close hours
News release periods
High-volatility trading zones
Personal strategy testing windows
⚙️ Key Features:
Customizable start and end time (hour & minute)
Works across all intraday timeframes
Adjustable highlight color to match your chart theme
Built using Pine Script v5 for speed and flexibility
🔧 Settings:
Start Hour / Minute – Set the beginning of the time range (in 24-hour format)
End Hour / Minute – Define when the range ends
Highlight Color – Choose the background color for better visibility
🕒 Timezone Note:
The indicator uses UTC time by default to ensure accuracy across markets. If your broker uses a different timezone (like EST, IST, etc.), the script can be adjusted to reflect your local market hours.
✅ How to Use the Time Range Marker Indicator
This indicator is used to visually highlight a specific time window each trading day, such as:
Market open or close sessions (e.g., NYSE, London, Tokyo)
High-impact news release periods
Custom time slots for strategy testing or scalping
🛠️ Installation Steps
Open TradingView and go to any chart.
Click on Pine Editor at the bottom of the screen.
Copy and paste the full Pine Script (shared above) into the editor.
Click the “Add to Chart” ▶️ button.
The indicator will appear on the chart with a highlighted background during the time range you set.
⚙️ How to Customize the Time Range
After adding the indicator:
Click the gear icon ⚙️ next to the indicator’s name on the chart.
Adjust the following settings:
Start Hour / Start Minute: The beginning of your time range (in 24-hour format).
End Hour / End Minute: When the highlight should stop.
Highlight Color: Pick a color and transparency for visual clarity.
Click OK to apply changes.
🕒 Timezone Consideration
By default, the indicator uses UTC (Coordinated Universal Time).
To match your broker’s timezone (e.g., EST, IST, etc.), you'll need to adjust the script by changing:
sessStart = timestamp("Etc/UTC", ...)
sessEnd = timestamp("Etc/UTC", ...)
to your correct timezone, like "Asia/Kolkata" for IST or "America/New_York" for EST.
Let me know your broker or local timezone, and I’ll update it for you.
📈 Tips for Traders
Combine this with volume, price action, or breakout indicators to focus your strategy on high-probability time windows.
Use multiple versions of this script if you want to highlight more than one time range in a day.

Market Sessions Indicator by NomadTradesCustomisable Market session indicator
This indicator visually marks the high and low price levels for the Asia, London, and New York trading sessions directly on the chart, using distinct horizontal lines and color-coding for each session. Each session’s high and low are labelled for easy identification, allowing traders to quickly assess key support and resistance levels established during major global market hours. The indicator is designed for clear session demarcation, helping users identify price reactions at these significant levels and supporting multi-session analysis for intraday and swing trading strategies
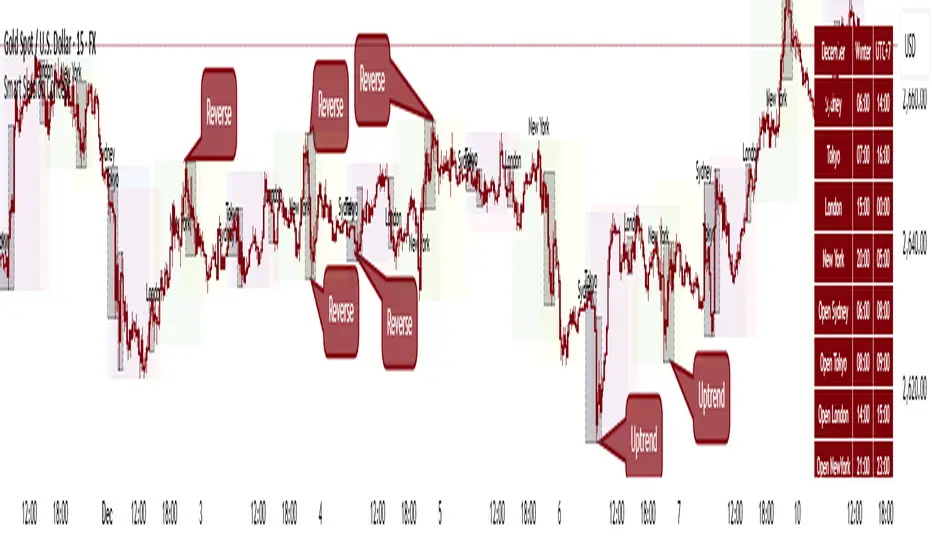
Smart Session ConceptSmart Session Concept — Intelligent Trading Session Overlay
Smart Session Concept is designed to detect major reversal points and key price pivots formed on higher timeframes, particularly during high-volume periods of the day — often marking the footprints of institutional orders and whales.
🔍 Key Features:
Displays standard sessions (Asian, London, New York) and allows adding custom time sessions.
Offers two visualization modes:
Time session table
Visual session boxes plotted on the chart
Auto-sync with seasonal time changes (Summer/Winter), supports Daylight Saving Time (DST)
Full flexibility:
Toggle table, boxes, and labels on/off
Customize colors for all session elements
Choose which months are considered summer/winter
💡 Suggested Use Case:
Use Smart Session Sync to pinpoint critical price structures such as:
Peaks and troughs of trending waves
Highs/lows in Wyckoff trading ranges
Liquidity sweeps or untouched liquidity zones
----------------------
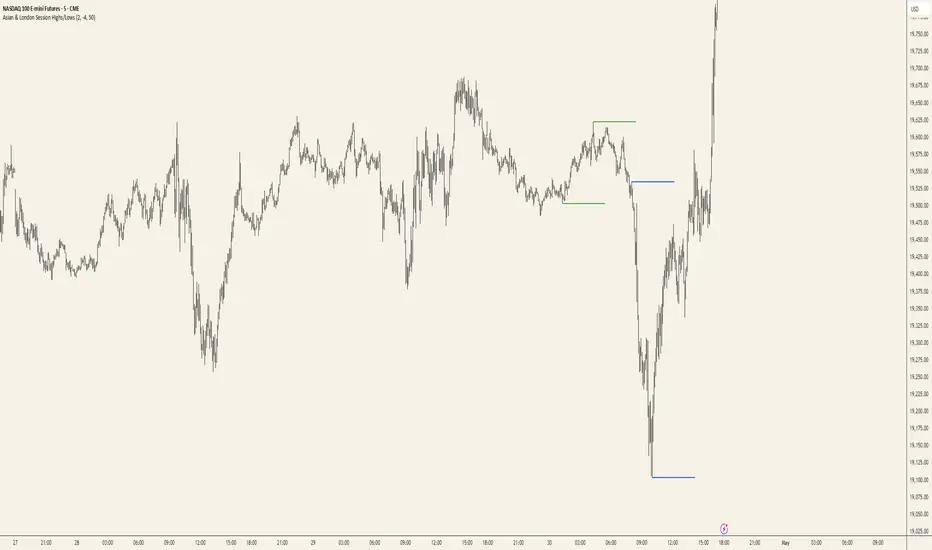
Asian & London Session Highs/LowsAsian & London Session Highs/Lows with Extendable Lines
This TradingView script automatically marks the highs and lows of the Asian and London trading sessions for the most recent day, allowing traders to identify key levels during these active periods. The lines representing the high and low of each session are drawn at the exact price point where the high/low occurred, and they extend to the right for a customizable number of bars, helping to visualize how the price reacts to these key levels after the session ends.
Key Features:
Session High/Low Tracking: Automatically tracks the highest and lowest points for the Asian and London sessions.
Extendable Lines: Lines start at the exact bar where the high/low occurred and can be extended to the right for a specified number of bars.
Timezone Adjustment: Allows you to input a timezone offset to adjust session times based on your local time or desired market time zone.
Customizable Colors & Line Thickness: Adjust the color and thickness of the session high and low lines to suit your visual preferences.
Clear & Precise Levels: Helps identify important support and resistance levels, making it easier to spot market reactions around session highs and lows.
This indicator is perfect for day traders and those looking to trade during specific market hours, offering clear visual markers of session boundaries and critical price levels.
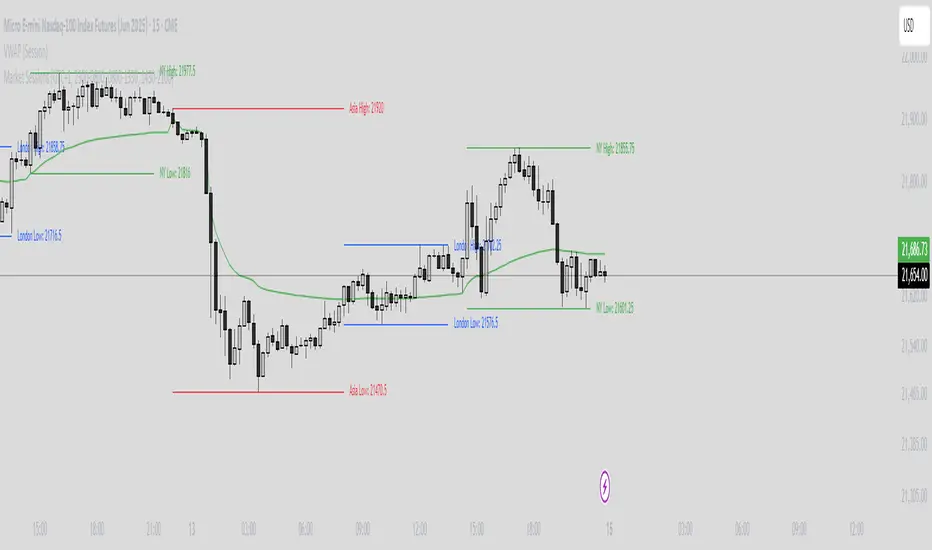
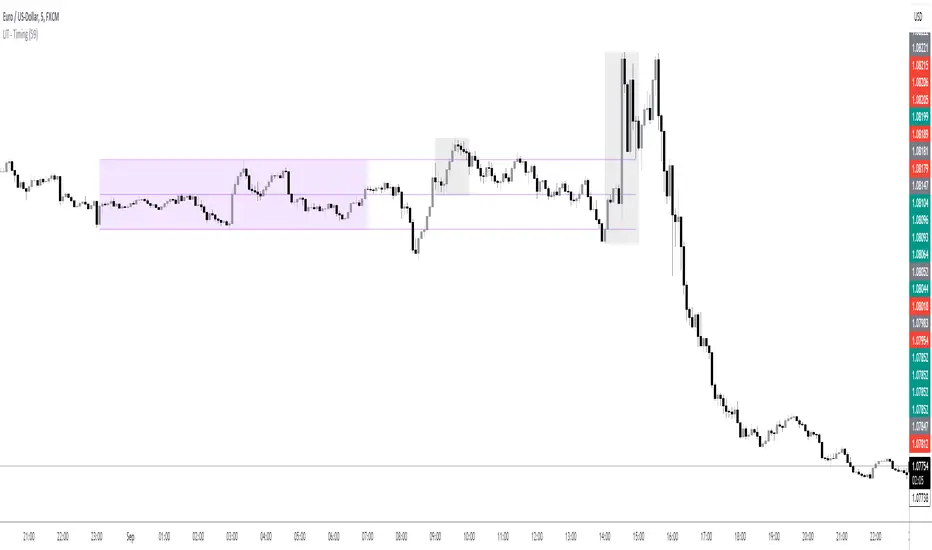
LIT - TimingIntroduction
This Script displays the Asia Session Range, the London Open Inducement Window, the NY Open Inducement Window, the Previous Week's high and low, the Previous Day's highs and lows, and the Day Open price in the cleanest way possible.
Description
The Indicator is based on UTC -7 timing but displays the Session Boxes automatically correct at your chart so you do not have to adjust any timings based on your Time Zone and don't have to do any calculations based on your UTC. It is already perfect.
You will see on default settings the purple Asia Box and 2 grey boxes, the first one is for the London Open Inducement Window (1 hour) and the second grey box is for the NY Open Inducement Window (also 1 hour)
Asia Range comes with default settings with the Asia Range high, low, and midline, you can remove these 3 lines in the settings "style" and untick the "Lines" box, that way you only will have the boxes displayed.
Special Feature
Most Timing-based Indicators have "bugged" boxes or don't show clean boxes at all and don't adjust at daylight savings times, we made sure that everything automatically gets adjusted so you don't have to! So the timings will always display at the correct time regarding the daylight savings times.
Combining Timing with Liquidity Zones the right way and in a clear, clean, and simple format.
Different than others this script also shows the "true" Asia range as it respects the "day open gap" which affects the Asia range in other scripts and it also covers the full 8 hours of Asia Session.
Additions
You can add in the settings menu the last week's high and low, the previous day's high and low, and also the day's open price by ticking the boxes in the settings menu
All colors of the boxes are fully adjustable and customizable for your personal preferences. Same for the previous weeks and day highs and lows. Just go to "Style" and you can adjust the Line types or colors to your preferred choice.
Recommended Use
The most beautiful display is on the M5 Timeframe as you have a clear overview of all sessions without losing the intraday view. You can also use it on the M1 for more details or the M15 for the bigger picture. The Template can hide on higher time frames starting from the H1 to not flood your chart with boxes.
How to use the Asia Session Range Box
Use the Asia Range Box as your intraday Guide, keep in mind that a Breakout of Asia high or low induces Liquidity and a common price behavior is a reversal after the fake breakout of that range.
How to use the London Open and NY Open Inducement Windows
Both grey boxes highlight the Open of either London Open or NY Open and you should keep an eye out for potential Liquditiy Graps or Mitigations during that times as this is when they introduce major Liquidity for the regarding Session.
How to use the Asia high, low and midline and day open price
After Asia Range got taken out in one direction, often price comes back to those levels to mitigate or bounce off, so you can imagine those zones as support and resistance on some occasions, recommended in combination with Imbalances.
How to use the previous day and week's highs and lows
Once added in the settings, you can display those price levels, you can use them either as Liquidity Targets or as Inducement Levels once they are taken out.
Enjoy!
One for AllOne for All (OFA) - Complete ICT Analysis Suite
Version 3.3.0 by theCodeman
📊 Overview
One for All (OFA) is a comprehensive TradingView indicator designed for traders who follow Inner Circle Trader (ICT) concepts. This all-in-one tool combines essential ICT analysis features—sessions, kill zones, previous period levels, and higher timeframe candles with Fair Value Gaps (FVGs) and Volume Imbalances (VIs)—into a single, highly customizable indicator. Whether you're a beginner learning ICT concepts or an experienced trader refining your edge, OFA provides the visual structure needed for precise market analysis and execution.
✨ Key Features
- 🏷️ Customizable Watermark**: Display your trading identity with customizable titles, subtitles, symbol info, and full style control
- 🌍 Trading Sessions**: Visualize Asian, London, and New York sessions with high/low lines, range boxes, and open/close markers
- 🎯 Kill Zones**: Highlight 5 critical ICT kill zones with precise timing and visual boxes
- 📈 Previous Period H/L**: Track Daily, Weekly, and Monthly highs/lows with customizable styles and lookback periods
- 🕐 Higher Timeframe Candles**: Display up to 5 HTF timeframes with OHLC trace lines, timers, and interval labels
- 🔍 FVG & VI Detection**: Automatically detect and visualize Fair Value Gaps and Volume Imbalances on HTF candles
- ⚙️ Universal Timezone Support**: Works globally with GMT-12 to GMT+14 timezone selection
- 🎨 Full Customization**: Control colors, styles, visibility, and layout for every feature
🚀 How to Use
Watermark Setup
The watermark overlay helps you identify your charts and maintain focus on your trading principles:
1. Enable/disable watermark via "Show Watermark" toggle
2. Customize the title (default: "Name") to display your trading name or account identifier
3. Set up to 3 subtitles (default: "Patience", "Confidence", "Execution") as trading reminders
4. Choose position (9 locations available), size, color, and transparency
5. Toggle symbol and timeframe display as needed
Use Case: Display your trading principles or account name for multi-monitor setups or content creation.
Trading Sessions Analysis
Sessions define market character and liquidity availability:
1. Enable "Show All Sessions" to visualize all three sessions
2. Adjust timezone to match your local market (default: UTC-5 for EST)
3. Customize session times if needed (defaults cover standard hours)
4. Enable session range boxes to see consolidation zones
5. Use session high/low lines to identify key levels for the current session
6. Enable open/close markers to track session transitions
Use Case: Identify which session you're trading in, track session highs/lows for liquidity, and anticipate session transition volatility.
Kill Zones Trading
Kill zones are ICT's high-probability trading windows:
1. Enable individual kill zones or use "Show All Kill Zones"
2. **Asian Kill Zone** (2000-0000 GMT): Early positioning and smart money accumulation
3. **London Kill Zone** (0300-0500 GMT): European market opening volatility
4. **NY AM Kill Zone** (0930-1100 EST): Post-NYSE open expansion
5. **NY Lunch Kill Zone** (1200-1300 EST): Midday consolidation or manipulation
6. **NY PM Kill Zone** (1330-1600 EST): Afternoon positioning and closes
7. Customize colors and times to match your trading style
8. Set max days display to control historical visibility (default: 30 days)
Use Case: Focus entries during high-probability windows. Watch for liquidity sweeps at kill zone openings and institutional positioning.
Previous Period High/Low Levels
Previous period levels act as magnetic price targets and support/resistance:
1. Enable Daily (PDH/PDL), Weekly (PWH/PWL), or Monthly (PMH/PML) levels individually
2. Set lookback period (how many previous periods to display)
3. Choose line style: Solid (current emphasis), Dashed (standard), or Dotted (subtle)
4. Customize colors per timeframe for visual hierarchy
5. Adjust line width (1-5) for visibility preference
6. Enable gradient effect to fade older periods
7. Position labels left or right based on chart layout
8. Customize label text for your preferred notation
Use Case: Identify key levels where price is likely to react. Daily levels work on intraday timeframes, Weekly on daily charts, Monthly for swing trading.
Higher Timeframe (HTF) Candles
HTF candles reveal the larger market context while trading lower timeframes:
1. Enable up to 5 HTF slots simultaneously (default: 5m, 15m, 1H, 4H, Daily)
2. Choose display mode: "Below Chart" (stacked rows) or "Right Side" (compact column)
3. Customize timeframe, colors (bull/bear), and titles for each slot
4. **OHLC Trace Lines**: Visual lines connecting HTF candle levels to chart bars
5. **HTF Timer**: Countdown showing time remaining until HTF candle close
6. **Interval Labels**: Display day of week (Daily+) or time (intraday) on each candle
7. For Daily candles: Choose open time (Midnight, 8:30, 9:30) to match your market structure preference
Use Case: Trade lower timeframes while respecting higher timeframe structure. Watch for HTF candle closes to confirm directional bias.
FVG & VI Detection
Fair Value Gaps and Volume Imbalances highlight inefficiencies that price often revisits:
1. **Fair Value Gaps (FVGs)**: Detected when HTF candle wicks don't overlap between 3 consecutive candles
- Bullish FVG: Gap between candle 1 high and candle 3 low (green box by default)
- Bearish FVG: Gap between candle 1 low and candle 3 high (red box by default)
2. **Volume Imbalances (VIs)**: Similar detection but focuses on body gaps
- Bullish VI: Gap between candle 1 close and candle 3 open
- Bearish VI: Gap between candle 1 open and candle 3 close
3. Enable FVG/VI detection per HTF slot individually
4. Customize colors and transparency for each imbalance type
5. Boxes appear on chart at formation and remain visible as retracement targets
**Use Case**: Identify high-probability retracement zones. Price often returns to fill FVGs and VIs before continuing the trend. Use as entry zones or profit targets.
🎨 Customization
OFA is built for flexibility. Every feature includes extensive customization options:
Visual Customization
- **Colors**: Independent color control for every element (sessions, kill zones, lines, labels, FVGs, VIs)
- **Transparency**: Adjust box and label transparency (0-100%) for clean charts
- **Line Styles**: Choose Solid, Dashed, or Dotted for previous period lines
- **Sizes**: Control text size, line width, and box borders
- **Positions**: Place watermark in 9 positions, labels left/right
Layout Control
- **HTF Display Mode**: "Below Chart" for detailed analysis, "Right Side" for space efficiency
- **Drawing Limits**: Set max days for sessions/kill zones to manage chart clutter
- **Lookback Periods**: Control how many previous periods to display (1-10)
- **Gradient Effects**: Enable fading for older previous period lines
Timing Adjustments
- **Timezone**: Universal GMT offset selector (-12 to +14) for global markets
- **Session Times**: Customize each session's start/end times
- **Kill Zone Times**: Adjust kill zone windows to match your market's characteristics
- **Daily Open**: Choose Midnight, 8:30, or 9:30 for Daily HTF candle open time
💡 Best Practices
1. Start Simple: Enable one feature at a time to learn how each element affects your analysis
2. Match Your Timeframe: Use Daily levels on intraday charts, Weekly on daily charts, HTF candles one or two levels above your trading timeframe
3. Kill Zone Focus: Concentrate your trading activity during kill zones for higher probability setups
4. HTF Confirmation: Wait for HTF candle closes before committing to directional bias
5. FVG/VI Entries: Look for price to return to unfilled FVGs/VIs for entry opportunities with favorable risk/reward
6. Customize Colors: Use a consistent color scheme that matches your chart theme and reduces visual fatigue
7. Reduce Clutter: Disable features you're not actively using in your current trading plan
8. Session Context: Understand which session controls the market—trade with session direction or anticipate reversals at session transitions
⚙️ Settings Guide
OFA organizes settings into logical groups for easy navigation:
- **═══ WATERMARK ═══**: Title, subtitles, position, style, symbol/timeframe display
- **═══ SESSIONS ═══**: Enable/disable sessions, times, colors, high/low lines, boxes, markers
- **═══ KILL ZONES ═══**: Individual kill zone toggles, times, colors, max days display
- **═══ PREVIOUS H/L - DAILY ═══**: Daily high/low lines, style, color, lookback, labels
- **═══ PREVIOUS H/L - WEEKLY ═══**: Weekly high/low lines, style, color, lookback, labels
- **═══ PREVIOUS H/L - MONTHLY ═══**: Monthly high/low lines, style, color, lookback, labels
- **═══ HTF CANDLES ═══**: Global display mode, layout settings
- **═══ HTF SLOT 1-5 ═══**: Individual HTF configuration (timeframe, colors, title, FVG/VI detection, trace lines, timer, interval labels)
Each setting includes tooltips explaining its function. Hover over any input for detailed guidance.
📝 Final Notes
One for All (OFA) represents a complete ICT analysis toolkit in a single indicator. By combining watermark customization, session visualization, kill zone highlighting, previous period levels, and higher timeframe candles with FVG/VI detection, OFA eliminates the need for multiple indicators cluttering your chart.
**Version**: 3.3.0
**Author**: theCodeman
**Pine Script**: v6
**License**: Mozilla Public License 2.0
Start with default settings to learn the indicator's structure, then customize extensively to match your personal trading style. Remember: tools provide information, but your edge comes from disciplined execution of a proven strategy.
Happy Trading! 📈

Previous Session Lines — High, Low, and 50% LevelsThis indicator automatically marks the previous completed session’s price range on your chart. You select a daily session window (for example: 09:30–16:00) and the script calculates:
* Previous Session High
* Previous Session Low
* Previous Session 50% (Midpoint)
When a session closes, the indicator draws all three levels on the chart and extends them forward for 24 hours, giving you clean, stable reference levels for the current trading day. Only the most recent session is shown; older sessions are automatically removed.
These levels are commonly used by day traders and swing traders to identify:
* Key support and resistance zones
* Breakout or rejection levels
* Market bias for the new session
* Areas where liquidity tends to accumulate
* Price reaction levels during overnight or intraday trading
Because the lines do not update in real time during the session, the levels remain static, accurate, and truly represent the completed session.
Settings users can adjust:
Session Settings:
* Start and end time of the session (repeats daily)
* Custom session name, which appears on the line labels
Line Appearance:
* Color
* Line thickness
* Line style (solid, dashed, dotted)
Label Appearance:
* Text size (tiny to huge)
* Text color automatically adjusts to contrast with the selected line color
Why this indicator is useful:
* Makes prior session structure immediately visible
* Helps identify high-probability reaction areas
* Shows only one session to reduce clutter
* Lines stay stable regardless of chart zoom or scaling
* Labels stay aligned at the right side of the chart
* Works on all timeframes, including extended hours and crypto charts
This tool is ideal for traders who rely on structured session analysis, including day traders, futures traders, forex traders, crypto traders, and anyone using session highs and lows to guide trading decisions.
This was developed to create an auto-mapping tool to comply with MrZinc's "London 50" strategy. You can learn more about that on his YouTube channel www.youtube.com
You can follow my YouTube trading channel here
www.youtube.com

OBR 15min Session Opening Range Breakout + Volume Trend DeltaQuick Overview
This Pine Script plots the opening range for London and New York sessions, highlights breakout levels, draws previous session pivots, and offers a live volume delta table for trend confirmation.
Session Opening Range
- Captures the high/low of the first 15 minutes (configurable) for both London & NY sessions.
- Fills the range area with adjustable semi‑transparent colors.
- Optional alerts fire on breakout above the high or below the low.
Previous Session Levels
- Automatically draws previous day’s High, Low, Open and previous 4‑hour High/Low.
- Helps identify key S/R zones as price approaches ORB breakouts.
Volume Trend Delta
- Uses a CMO‑weighted moving average and ATR bands to detect trend state.
- Accumulates bullish vs. bearish volume during each trend.
- Displays Bull Vol, Bear Vol, and Delta % in a movable table for quick strength checks.
How to Use
1. Let the opening range complete (first 15 min).
2. Look for price closing above/below the ORB—enter long on an upside break, short on a downside break.
3. Check the Volume Delta table: positive delta confirms buying strength; negative delta confirms selling pressure.
4. Use previous day/4h levels as additional support/resistance filters.
Settings & Customization
- ORB Duration & Session Times (London/NY), fill colors, and toggles.
- Enable/disable Previous Day & 4H levels.
- Trend Period, Momentum Window, and Delta table position/size.
- Pre‑built alert conditions for all ORB breakouts.
Developer Notes
- Fully commented for easy adjustments.
- Modular sections: ORB, previous levels, trend delta, and alerts.
- No external libraries—pure Pine Script v6.
Tip
Combine ORB breakouts with Volume Delta and prior session pivots to filter false signals and trade stronger, more reliable moves.

Zen FDAX Session📝 Description
OVERVIEW
The Zen FDAX Session indicator highlights periods outside the regular trading hours of the FDAX (DAX Futures) on the Xetra exchange. It shades the chart background during non-trading hours, aiding traders in distinguishing active market periods from inactive ones.
FUNCTIONALITY
Customizable Trading Hours: Users can define the session's start and end times in UTC, allowing flexibility to match personal trading schedules or account for daylight saving changes.
Visual Clarity: The indicator applies a subtle background color to non-trading hours, ensuring clear demarcation without obscuring price data.
Time Zone Awareness: Designed with UTC inputs to maintain consistency across different user time zones.
USAGE
Add the Indicator: Apply the "Zen FDAX Session" indicator to your chart.
Set Trading Hours: Input your desired session start and end times in UTC.
Interpret the Shading: Areas with shaded backgrounds represent times outside your defined trading session.
Note: This indicator does not generate buy/sell signals but serves as a visual aid to identify trading sessions.

CM Opening Range-Asia and Europe SessionCM Opening Range Asia AndEurope Sessions
Requested by rayhug1 to use Asia Range of 5pm Est to 2am Est...uses 540 minutes (5pm to 2am Est — 9 Hours) to calculate the Range...then breakouts trigger after 2am
-Ability to change Start and End Times to use any entire session.
---Defaults to 540 minutes (9 hours) but Opening Range Calculation can be changed to 1 hour, 2 hour etc. in Inputs tab
***Known Bug…Currently will NOT Plot accurately the U.S. Session from 0800 to 0759. Will Update Indicator when Fixed.
-Ability to Change the Start and End Times to Accommodate any session.
—Default is 1700 to 1659 (Asian Range)
—Europe Session 0200 to 0159
***All times are based on New York Time or Eastern Standard time … GMT-5
***Times will change based on Daylight Savings Time.

VX-Session-Boxes-(AM/PM Split)(Customizable) by Ikaru-s-VX-Session-Boxes-(AM/PM Split) is a session-based visualization tool for TradingView that highlights major market sessions directly on the chart using dotted range boxes and an optional AM/PM split.
The indicator allows traders to visually separate market behavior across different sessions while keeping the chart clean and readable.
🔹 Key Features
Custom Session Definitions
Define up to 4 independent sessions using TradingView’s session format (HHMM-HHMM + weekdays).
Timezone-Aware
All sessions are calculated using a user-defined timezone (IANA or UTC offset), ensuring accurate session alignment across markets.
Dotted Session Boxes
Each session is drawn as a dotted box based on the session’s high/low range, providing a clear view of volatility and price structure.
AM / PM Split Visualization
Sessions can be visually split into AM and PM parts:
Separate box shading for AM and PM
Optional dotted vertical split line at the AM → PM transition (12:00 in the selected timezone)
Session Labels
Optional labels at the start of each session for quick identification (e.g. Sydney, Tokyo, London, New York).
Fully Customizable Visuals
Adjustable opacity, border width, and visibility toggles for boxes, split lines, and labels.
🔹 Use Cases
Session-based market analysis (Asia / London / New York)
Identifying session ranges and volatility expansion
Observing price behavior differences between AM and PM
Studying session transitions and liquidity shifts
🔹 Notes
Session boxes are based on session high and low, not full chart height.
AM/PM split is based on 12:00 (noon) in the selected timezone.
Designed for clarity and performance on intraday timeframes.
🔹 Compatibility
Pine Script® v6
Works on all intraday timeframes
Overlay indicator (draws directly on the price chart)

ICT Sessions Ranges [SwissAlgo]ICT Session Ranges - ICT Liquidity Zones & Market Structure
OVERVIEW
This indicator identifies and visualizes key intraday trading sessions and liquidity zones based on Inner Circle Trader (ICT) methodology (AM, NY Lunch Raid, PM Session, London Raid). It tracks 'higher high' and 'lower low' price levels during specific time periods that may represent areas where market participants have placed orders (liquidity).
PURPOSE
The indicator helps traders observe:
Session-based price ranges during different market hours
Opening range gaps between market close and next day's open
Potential areas where liquidity may be concentrated and trigger price action
SESSIONS TRACKED
1. London Session (02:00-05:00 ET): Tracks price range during early London trading hours
2. AM Session (09:30-12:00 ET): Tracks price range during the morning New York session
3. NY Lunch Session (12:00-13:30 ET): Tracks price range during typical low-volume lunch period
4. PM Session (13:30-16:00 ET): Tracks price range during the afternoon New York session
CALCULATIONS
Session High/Low: The highest high and lowest low recorded during each active session period
Opening Range Gap: Calculated as the difference between the previous day's 16:00 close and the current day's 09:30 open
Gap Mitigation: A gap is considered mitigated when the price reaches 50% of the gap range
All times are based on America/New_York timezone (ET)
BACKGROUND INDICATORS
NY Trading Hours (09:30-16:00 ET): Optional gray background overlay
Asian Session (20:00-23:59 ET): Optional purple background overlay
VISUAL ELEMENTS
Horizontal lines mark session highs and lows
Subtle background boxes highlight each session range
Labels identify each session type
Orange shaded boxes indicate unmitigated opening range gaps
Dotted line at 50% gap level shows mitigation threshold
FEATURES
Toggle visibility for each session independently
Customizable colors for each session type
Automatic removal of mitigated gaps
All drawing objects use transparent backgrounds for chart clarity
ICT CONCEPTS
This tool relates to concepts discussed by Inner Circle Trader regarding liquidity pools, session-based analysis, and gap theory. The indicator assumes that session highs and lows may represent areas where liquidity is concentrated, and that opening range gaps may attract price until mitigated.
USAGE NOTES
Best used on intraday timeframes (1-15 minute charts)
All sessions are calculated based on actual price movement during specified time periods
Historical session data is preserved as new sessions develop
Gap detection only triggers at 09:30 ET market open
DISCLAIMER
This indicator is for educational and informational purposes only. It displays historical price levels and time-based calculations. Past performance of price levels is not indicative of future results. The identification of "liquidity zones" is a theoretical concept and does not guarantee that orders exist at these levels or that prices will react to them. Trading involves substantial risk of loss. Users should conduct their own analysis and risk assessment before making any trading decisions.
TIME ZONE
Set your timezone to: America/New_York (UTC-5)

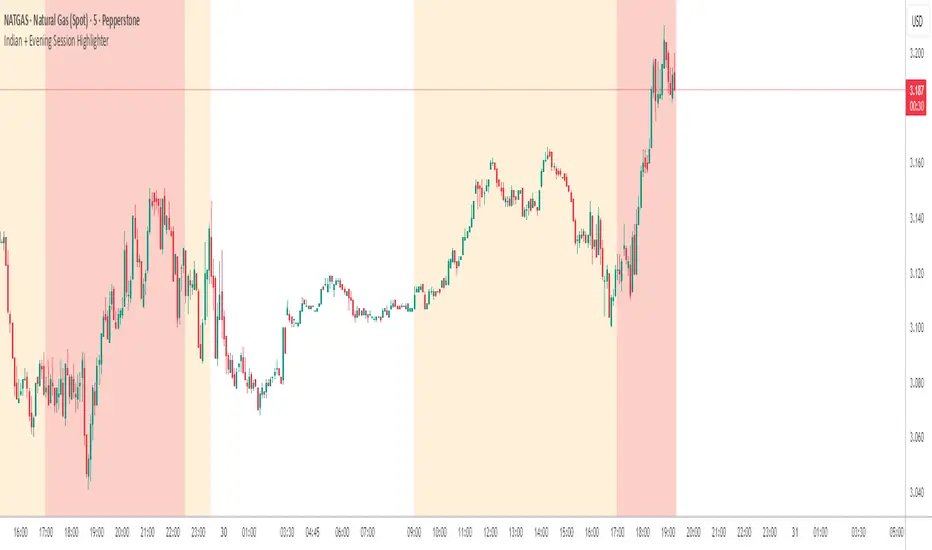
Indian + Evening Session HighlighterThis indicator visually highlights two key trading windows for Indian instruments according to IST:
Indian Session: 9:00 AM to 11:30 PM IST is shaded light orange on the chart, representing the main domestic trading hours for stocks, indices, commodities, or derivatives.
Evening Session: 5:00 PM to 10:30 PM IST is shaded light red, marking the commonly followed evening window, which often captures the impact of US and European market movements.
The indicator automatically overlays these session backgrounds on your chart, helping you quickly identify when price action occurs during India’s core and evening trade windows. This allows traders to focus on strategies specific to these time intervals, identify session-based volatility, and avoid trading during less active periods. If the evening session overlaps with the Indian session, the colors are layered for visual clarity.
It is ideal for intraday traders, option strategists, and anyone monitoring Indian market rhythms or US-linked volatility impacts on Indian assets. No inputs are required; simply apply the script and view distinct session highlights for improved timing and decision making.
ICT Killzones & MacrosICT Killzones & Macros (v1.1.5) — configurable ICT session windows + refined “macro” windows with live High/Low levels, optional extensions, next-window previews, and lightweight opening-price lines. Built to be clock-robust, timezone-aware, and performant on intraday charts.
Tip: All times are interpreted in your chosen IANA timezone (default: America/New_York) and auto-handle DST. You can rename, recolor, enable/disable, and retime every window.
What it plots
- Killzones (5) : Asia (19:00–02:00), London (02:00–05:00), NY AM (07:00–09:30), London Close (10:00–12:00), NY PM (13:30–16:00) — full-height boxes with optional header.
- Macros (8) (defaults tailored for common ICT “refined” windows): Asia-1 (18:00–21:00), Asia-2 (21:00–00:00), London-1 (01:00–04:00), AM-1 (09:45–10:15), AM-2 (10:45–11:15), Lunch (12:00–13:00), PM-1 (13:30–14:30), Power Hour (15:10–16:00).
- Live High/Low lines for the current Macro/Killzone window.
- Optional HL extension to the right until price crosses or the trading day rolls (style selectable).
- “Next” previews : earliest upcoming Macro and Killzone header; optional next-window background band.
- Opening Prices (3 lightweight time lines) : defaults 00:00, 08:30, 09:30 with right-edge labels, scoped to a session you choose (auto-cleans at session end).
- Key inputs & styling
- General : Timezone (IANA), “Sessions to show” (per window) to keep only the last N completed windows.
- Header : height (ticks), gap (ticks), fill opacity, border width/style, text size/color, toggle “Next Macro/Killzone” headers.
- Boxes : global fill opacity, global border width/style (used by both Macros & Killzones).
- High/Low : show HL, HL line style, extend on/off + extension style, optional extension labels.
- Opening Prices : enable Time 1/2/3, set HH:MM for each, session window, per-line colors, style (dotted/dashed/solid), width.
- Per-window controls : each Macro/Killzone has Enable, Session (HHMM-HHMM), Label, Fill color.
How to use (quick start)
- Set Timezone to your preference (default America/New_York).
- Toggle on the Macros and Killzones you trade. Adjust session times if needed.
- (Optional) Turn on Extend High/Low to project levels until crossed/day-roll.
- (Optional) Enable Next… headers to see the next upcoming window at a glance.
- (Optional) Configure Opening Prices (00:00 / 08:30 / 09:30 by default) and the session over which they appear.
Behavior & notes
- Time windows are computed by clock, not by guessing bar timestamps, making them robust across brokers and timeframes.
- With HL extension on, the current window’s levels extend until crossed or the end of the trading day (in your timezone). With it off, completed windows keep static HL markers (limited by “Sessions to show”).
- “Sessions to show” applies per Macro/Killzone to automatically prune older windows and keep charts snappy.
- Opening-price lines exist only within the chosen “Opening Prices Session” and are removed when it ends (keeps charts clean).
Defaults (color cues)
Killzones: Asia (blue), London (purple), NY AM (green), London Close (yellow), NY PM (orange).
Macros: neutral greys with Lunch and PM accents out of the box (all customizable).
Performance tips
- Reduce “Sessions to show” if you scroll far back in history.
- Disable “Next…” previews and/or extension labels on very slow machines.
- Narrow the “Opening Prices Session” window to exactly when you need those lines.
Changelog highlights
- v1.1.5 : Internal refinements and stability.
- v1.1.3 : Live High/Low lines for current windows + optional extension.
- v1.1.2 : Added “next Killzone” preview (to match “next Macro”).
- v1.1.0 : Defaults updated (5 KZ, 8 Macros). Removed “snap-to-killzone” behavior.
- v1.0.0 : Independent Macro vs. Killzone rendering; cleaner header logic.
- Known limitations
If your chart warns about drawings, trim “Sessions to show”.
If your broker session times differ from NY hours, adjust the sessions or change the indicator timezone.
Credits & intent
Inspired by ICT timing concepts; provided for education/mark-up, not financial advice.
Built to be flexible so you can mirror your personal playbook and journaling workflow.

ORB & Sessions [Capitalize Labs]ORB & Sessions Indicator
The ORB & Sessions Indicator provides a structured way to analyze intraday price action by combining two well-established concepts: global trading sessions and Opening Range Breakouts (ORB). It is designed to help traders identify where liquidity forms, when volatility expands, and how price behaves around key session and range levels.
Market Sessions Framework
Displays New York, London, and Asian sessions directly on the chart.
Each session can be shown as a highlighted background zone, or with extended highs and lows for liquidity tracking.
Session highs and lows remain projected forward after the session ends, allowing traders to monitor sweeps, retests, and reactions throughout the day.
Session times are fully customizable and can be aligned with the trader’s own timezone or broker feed.
This structure helps traders place price action into context, whether during quiet Asian trading, London-driven volatility, or New York reversals.
Opening Range Breakouts (ORB)
Supports three independent ORBs, each with configurable session times.
During the defined ORB window, the indicator captures the high and low of the range and plots a live updating box.
Once the ORB closes, the range locks and projects breakout targets (T1 and T2) based on user-defined risk-to-reward multiples.
Alerts are included for breakouts of highs, lows, or target levels.
Traders can use a single ORB or multiple—for example, tracking an Asian ORB into London, or London into New York.
Visualization and Clarity
Color-coded boxes and levels for sessions and ORBs.
Labels such as “Range High” and “Range Low” ensure clarity without clutter.
Flexible display settings allow highlighting full zones, just lines, or minimal markers depending on preference.
Practical Applications
This indicator is useful for:
Liquidity and volatility analysis: Observe where session highs and lows form and how they influence later trading.
Breakout and reversal strategies: Use ORB ranges to define risk and plan target projections.
Time-based research: Explore how different session overlaps or ORBs affect markets like indices, FX, and commodities.
Risk planning: Built-in R-multiple targets provide a consistent framework for evaluating setups.
Why It’s Different
Instead of showing sessions and ORBs separately, this indicator integrates them into one framework. Traders can:
See when and where sessions open and establish range levels.
Define precise ORBs with customizable timing.
Track breakout levels and targets in real time with alerts.
The result is a clear, time-structured view of the trading day, helping traders align setups with session dynamics and opening range behavior.
This indicator does not generate buy or sell signals. It is an analytical and visualization tool, providing structure for traders to better interpret intraday price action.

Simple Sessions & LevelsWhat this indicator does:
This script marks out two essential types of price levels for intraday and swing traders:
The high and low of a customizable 15-minute opening range after the market/session open.
The previous day’s high, midpoint (“halfback”), and low.
How it works:
The script lets you set the session start time (hour and minute) to match your market.
It then calculates the high and low of the first 15 minutes after the session opens and plots those as solid lines.
It also plots the prior day’s high, halfback (midpoint), and low on your chart for easy reference.
Each line and each label can be toggled on or off independently in the settings for maximum customization.
Colors for each level are also fully customizable.
How to use it:
Add the script to your chart.
Set the session start hour and minute to match the open of the market or instrument you trade.
Choose which levels and labels you want displayed by using the toggles in the settings.
The indicator will automatically draw the session range and prior day levels for you.
Use these lines as reference for key support, resistance, and potential trade entry/exit points.
What makes it unique and useful:
This tool combines a flexible session opening range with classic daily reference levels in one package. You have complete control over which levels and labels are shown, making it adaptable for any trading style. It’s especially useful for day traders who want to quickly identify volatility windows and the most important price levels from the previous session.

TradeJorno - Time + Price Levels
Tired of manually drawing and updating important ICT or SMC time and price levels on your charts every day?
Here’s an indicator to draw important TIME and PRICE levels automatically.
Here’s what you can highlight in realtime on your charts:
1. Previous major highs and lows
⁃ Previous daily and weekly highs and low
- Weekly dividing lines
2. Session highs/lows
⁃ Plot the high and low of Asia and London sessions.
⁃ Customise the timeframe and appearance on the chart.
- Previous session settlement price.
3. Various price levels
⁃ Pre-market opening prices : midnight, 7:30 and 8:30
⁃ Regular market opening prices: 9:30, 10:00, 14:00
- end of session settlement prices
4. Market opening range high and low
⁃ Lines extending throughout the current session
⁃ Customise the timeframe and appearance on the chart.
5. ICT Macro times
- Draw customisable vertical lines and labels to indicate the start of each ICT macro
period.
Let us know in the comments below if there’s anything else we need to add!

Umesh BC IST 3:30 AM Session Tracker + 4H Candles📌 IST 3:30 AM Session Tracker + 4H Candle Marker
This indicator is designed for traders who follow Indian Standard Time (IST) and want precise session tracking and 4H candle insights.
🔧 Features:
🕒 Daily Session Start at 3:30 AM IST
Automatically detects and marks the beginning of each new trading day based on 3:30 AM IST, not midnight.
Displays session Open, High, and Low lines.
Background shading for each session.
Customizable alert when a new day starts.
🟧 4H Candle Start Markers (IST Time)
Identifies every new 4-hour candle that starts at:
3:30, 7:30, 11:30, 3:30 PM, 7:30 PM, 11:30 PM IST
Adds a vertical line and label ("🟧 4H") above the candle.
Plots a dynamic line for the 4H candle's opening price.
Includes optional alert for new 4H candles.
🔔 Alerts Included:
"🕒 New IST Day Start": Triggers at 3:30 AM IST.
"🟧 New 4H Candle": Triggers at each 4H candle start (IST).
✅ Best for:
Intraday, swing, and institutional traders using IST-based analysis.
Those wanting more accurate daily sessions and clear candle structuring.

Trading Sessions Highs/Lows | InvrsROBINHOODTrading Sessions Highs/Lows | InvrsROBINHOOD
🚀 A powerful indicator for tracking key trading sessions and the highs and lows of each session!
📌 Description
The Trading Sessions Highs/Lows indicator visually marks the most critical trading sessions—Asia, London, and New York—using small colored dots at the bottom of the candle. It also tracks and plots the highs and lows of each session, along with the Daily Open and Weekly Open levels.
This tool is designed to help traders identify session-based liquidity zones, price reactions, and potential trade setups with minimal chart clutter.
Key Features:
✅ Session markers (Asia, London, NY AM, NY Lunch, NY PM) plotted as small dots
✅ Plots session highs and lows for market structure insights
✅ Daily Open line for intraday reference
✅ Weekly Open line for higher timeframe bias
✅ Alerts for session high/low breaks to capture momentum shifts
✅ User-defined UTC offset for global traders
✅ Customizable session colors for personal preference
📖 How to Use the Indicator
1️⃣ Understanding the Sessions
Asia Session (Yellow Dot) → Marks liquidity buildup & pre-London moves
London Session (Blue Dot) → Strong volatility, breakout opportunities
New York AM Session (Green Dot) → Major trends & institutional participation
New York Lunch (Red Dot) → Low volume, ranging market
New York PM Session (Dark Green Dot) → End-of-day movements & reversals
2️⃣ Session Highs & Lows for Market Structure
Session Highs can act as resistance or breakout points.
Session Lows can act as support or stop-hunt zones.
Break of a session high/low with volume may indicate continuation or reversal.
3️⃣ Using the Daily & Weekly Open
The Daily Open (Black Line) helps gauge the intraday trend.
Above Daily Open → Bearish Bias
Below Daily Open → Bullish Bias
The Weekly Open (Red Line) sets the higher timeframe directional bias.
4️⃣ Alerts for Breakouts
The indicator will trigger alerts when price breaks session highs or lows.
Useful for setting stop-losses, breakout trades, and risk management.
💡 Why This Indicator is Important for Beginners
1️⃣ Avoids Overtrading:
Many beginners trade in low-volume periods (NY Lunch, Asia session) and get stuck in choppy price action.
This indicator highlights when volatility is high so traders focus on better opportunities.
2️⃣ Session-Based Liquidity Traps:
Market makers often run stops at session highs/lows before reversing.
Watching session breaks prevents traders from falling into liquidity grabs.
3️⃣ Reduces Emotional Trading:
If price is above the Daily Open, a beginner shouldn’t look for shorts.
If price is below a key session low, it may signal a fake breakout.
4️⃣ Aligns with Institutional Trading:
Smart money traders use session highs/lows to set stop hunts & reversals.
Beginners can use this indicator to spot these zones before entering trades.
🛡️ How to Mitigate Risk with This Indicator
✅ Wait for Confirmations – Don’t trade blindly at session highs/lows. Look for wicks, rejections, or break/retests.
✅ Use Stop-Loss Above/Below Session Levels – If you’re going long, set SL below a session low. If short, set SL above a session high.
✅ Watch Volume & News Events – Breakouts without strong volume or news may be fake moves.
✅ Combine with Other Strategies – Use price action, trendlines, or EMAs with this indicator for higher probability trades.
✅ Use the Weekly Open for Trend Bias – If price stays below the Weekly Open, avoid bullish setups unless key support holds.
🎯 Who is This Indicator For?
📌 Beginners who need clear session-based trading levels.
📌 Day traders & scalpers looking to refine their intraday setups.
📌 Smart money traders using liquidity concepts.
📌 Swing traders tracking higher timeframe momentum shifts.
🚀 Final Thoughts
This indicator is an essential tool for traders who want to understand market structure, liquidity, and volatility cycles. Whether you’re trading forex, stocks, or crypto, it helps you stay on the right side of the market and avoid unnecessary risks.
🔹 Set it up, customize your colors, define your UTC offset, and start trading smarter today! 🏆📈
