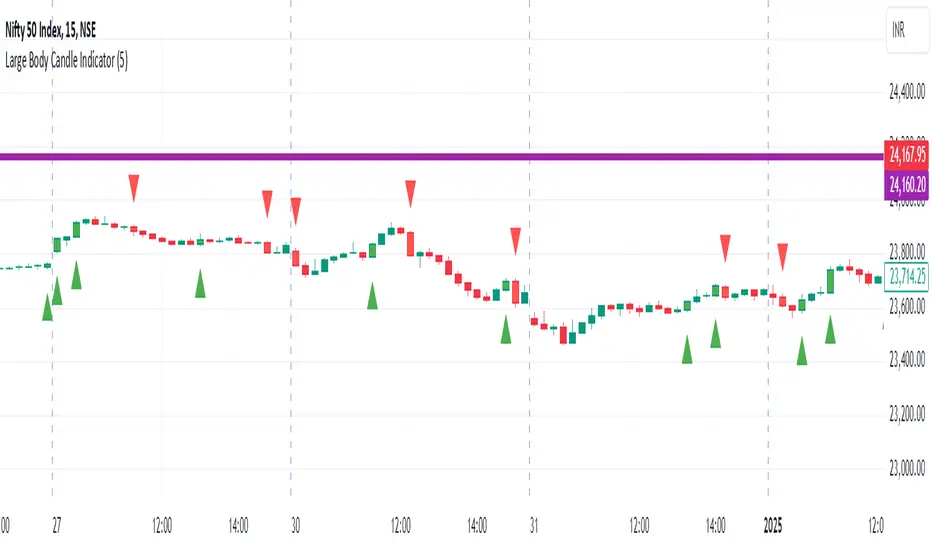
Large Body Candle IndicatorFunctionality
Comparison: The indicator compares the body size of the current candle to the maximum body size of the previous 5 candles.
Bullish Candles: When a bullish candle (close > open) has a larger body than the previous 5 candles:
A green triangle is plotted below the candle
The candle is colored green
Bearish Candles: When a bearish candle (close < open) has a larger body than the previous 5
candles:
A red triangle is plotted above the candle
The candle is colored red
Key Components
Lookback Period: Default set to 5 candles, but can be adjusted by the user.
Body Size Calculation: Calculated as the absolute difference between the open and close prices.
Maximum Previous Body Size: Determined by comparing the body sizes of the previous 5 candles.
Candle Classification: Candles are classified as bullish or bearish based on the relationship between open and close prices.
Visual Indicators:
Shape plotting for triangles
Bar coloring for highlighted candles
User Customization
Users can adjust the lookback period through the indicator settings, allowing for flexibility in identifying significant candles based on recent price action.
Use Cases
Identifying potential breakout candles
Spotting significant price movements
Enhancing visual analysis of price action
Supporting decision-making in trading strategies
Limitations
The indicator does not predict future price movements
It's based solely on recent price action and doesn't consider other technical or fundamental factors
Conclusion
The Large Body Candle Indicator provides a simple yet effective way to visually identify candles that show significant price movement relative to recent price action. It can be a valuable tool when used in conjunction with other technical analysis methods.
"candle" için komut dosyalarını ara
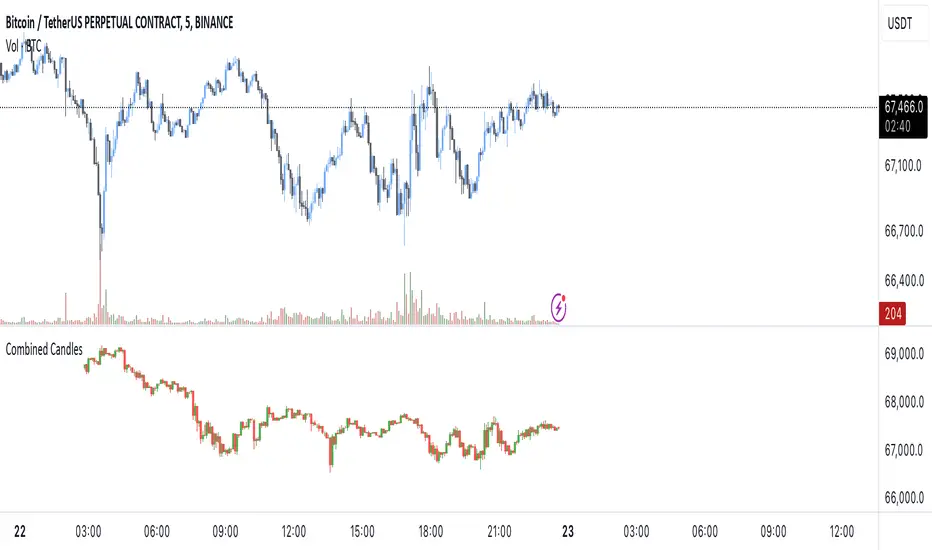
[EmreKb] Combined CandlesThis script combines multiple candlestick patterns into a single, unified candle when they are of the same type (bullish or bearish). Instead of displaying every individual candle on the chart, it merges consecutive candles based on their direction to simplify the visual analysis of price movements.
What It Does:
Combines Candles: If two or more consecutive candles are bullish (close price higher than open price) or bearish (close price lower than open price), the script merges them into a single candle, adjusting the high, low, and close values accordingly.
Displays Merged Candles: The merged candles are drawn on the chart. A green bar represents a bullish period, while a red bar represents a bearish period.
How It Works:
The script tracks whether each candle is bullish or bearish.
If a candle is the same type as the previous one, it updates the combined candle (adjusting the high, low, and close values).
When the type changes (from bullish to bearish or vice versa), it finalizes the current combined candle and starts a new one.
The merged candles are displayed on the chart at the end of the data series.
Use Case:
This script simplifies price action by grouping similar candles together, making it easier to identify trends and spot periods of sustained buying or selling pressure. It can help traders focus on the overall direction of the market rather than being distracted by small fluctuations between individual candles.
Green/Red Candle Probability (EMA 7, SMA 20, SMA 200)### Strategy Explanation for Candle Probability Indicator
This script is designed to calculate the **probability of bullish (green) and bearish (red) candles** over a given analysis period. It leverages three key moving averages to identify market trends and display these probabilities directly on the chart, making it easier for traders to make informed decisions.
#### **How the Script Works:**
1. **Trend Detection Using Moving Averages:**
- The script calculates three moving averages:
- **EMA (Exponential Moving Average) over 7 periods**
- **SMA (Simple Moving Average) over 20 periods**
- **SMA over 200 periods**
The trend is classified as:
- **Bullish:** When EMA 7 > SMA 20 > SMA 200
- **Bearish:** When EMA 7 < SMA 20 < SMA 200
2. **Candle Analysis:**
The script analyzes the last "n" candles (based on the user-defined lookback period) to count the number of bullish and bearish candles:
- **Bullish (green) candle:** The closing price is higher than the opening price.
- **Bearish (red) candle:** The closing price is lower than the opening price.
3. **Probability Calculation:**
The probabilities are calculated as a percentage of bullish and bearish candles in the lookback period:
- **Green Probability (%) = (Number of Green Candles / Lookback Period) × 100**
- **Red Probability (%) = (Number of Red Candles / Lookback Period) × 100**
4. **Displaying Results in a Table:**
The results are displayed in a table on the chart, including:
- **Green Probability (%)**
- **Red Probability (%)**
- **Current Trend (Bullish, Bearish, or Neutral)**
#### **Strategy Overview:**
This indicator provides traders with a quick overview of the candle probabilities and the current market trend based on moving averages. It helps traders:
- Gauge the likelihood of bullish or bearish candles appearing in the near future.
- Identify the prevailing trend (bullish, bearish, or neutral).
- Adjust their trading strategies based on statistical probabilities rather than assumptions.
### **Important Notes:**
- The lookback period can be customized between **10 and 200 periods**.
- The indicator does not provide buy/sell signals but gives insights into market behavior.
By understanding the candle probabilities and the trend, traders can better assess market conditions and improve their decision-making process.

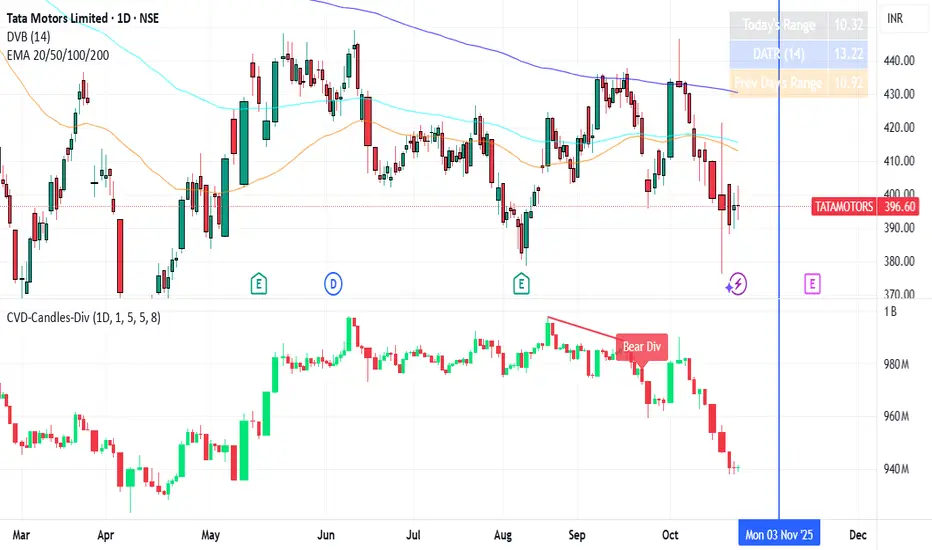
CVD Candles + Divergence (Pane) [NIRALA]This indicator provides a powerful way to analyze market dynamics by visualizing Cumulative Volume Delta (CVD) as candlesticks and automatically detecting divergences between price and order flow. It is designed to help traders spot potential trend exhaustion and reversals that may not be apparent from price action alone.
Key Concepts
Cumulative Volume Delta (CVD): CVD is a running total of the difference between buying and selling volume from market orders. A rising CVD indicates aggressive buying, while a falling CVD indicates aggressive selling. Unlike price, which can be influenced by passive limit orders, CVD shows the raw intent of aggressive market participants.
Divergence: A divergence occurs when price and CVD move in opposite directions. This signals a potential conflict between price action and the underlying order flow, often preceding a reversal.
Bearish Divergence: Price makes a new high, but CVD fails to make a new high (or makes a lower high). This suggests buying aggression is weakening despite the higher price, and a reversal to the downside may be imminent.
Bullish Divergence: Price makes a new low, but CVD fails to make a new low (or makes a higher low). This suggests selling pressure is drying up, and a reversal to the upside may be coming.
Features
CVD as Candlesticks: Plots CVD in a familiar OHLC candlestick format in a separate pane, providing a more intuitive view of order flow momentum and volatility compared to a simple line.
Automatic Divergence Detection: The script automatically identifies classic bullish and bearish divergences between price pivots and CVD pivots, drawing lines on both the main price chart and the indicator pane to clearly highlight them.
Multi-Timeframe Analysis: Calculates CVD from a user-defined lower timeframe, offering a more granular and precise view of the order flow that builds up a single candle on your chart.
Customizable Pivot Lookbacks: Allows you to adjust the sensitivity of the pivot detection for finding both short-term and long-term divergences.
Alerts: Includes built-in alerts that can notify you when a new bullish or bearish divergence is confirmed.
How to Use
Look for High-Probability Setups: This indicator is most powerful when its signals appear at key areas of support or resistance. A divergence at a major price level is a much stronger signal than one in the middle of a range.
Confirm with Price Action: Do not trade on a divergence signal alone. Wait for a confirmation candle (e.g., a bearish engulfing candle after a bearish divergence, or a bullish hammer after a bullish divergence) before considering an entry.
Combine with Your Strategy: Use this indicator as a confirmation tool to enhance your existing trading strategy. For example, if your primary strategy gives a sell signal and this indicator simultaneously prints a bearish divergence, it significantly increases the probability of the trade.
This tool is designed for discretionary traders looking to add a layer of order flow analysis to their decision-making process.
Good Candles with Risk TableThis custom Pine Script indicator highlights bullish and bearish candles based on the highest and lowest close prices over the past specified number of candles (look-back period).
Bullish candles are marked with an orange color when the close is higher than the highest close from the previous candle.
Bearish candles are marked with a purple color when the close is lower than the lowest close from the previous candle.
The indicator also draws two lines for each colored candle:
Midline: A horizontal line drawn at the midpoint between the open and close of the candle, which helps visualize the candle's body.
Open line: A horizontal line drawn at the open price, offering an additional reference point for market action.
Lines are visible for the last 5 colored candles (either bullish or bearish), with old lines being removed to avoid clutter on the chart.
Additionally, the Risk Table at the top right of the chart shows the calculated units to buy for the specified risk amount (default value of $0.1), based on the distance between the candle’s close and its midpoint. This allows users to manage their risk effectively by knowing how many units they should purchase to match their desired risk level.

Extended Engulfing CandleExtended Engulfing Candle Pattern Indicator
This indicator advances the standard engulfing candle pattern, capturing more reliable trend reversal signals in the market. Traditional engulfing candle patterns often lead to premature judgments of trend reversals, but the Extended Engulfing Indicator considers consecutive rising or falling candles to pinpoint more conservative trend reversal points.
Features:
Detection of Consecutive Rising/Falling Candles:
This indicator detects the occurrence of consecutive rising or falling candles, considering them when identifying extended engulfing candles. This creates a more potent reversal signal compared to single candle patterns.
Visual Display:
“U” and “D” labels are displayed at the top and bottom of the chart, clearly showing users the rising and falling engulfing patterns.
It only displays a label once, until a pattern in the opposite direction is shown.
Enhanced Accuracy:
By using the information from consecutive candles, the indicator captures trend reversals more conservatively and accurately. This reduces the number of false signals compared to traditional engulfing candle patterns.
How to Use:
When a rising engulfing candle pattern is displayed, it signifies the start of a potential upward trend. Conversely, when a falling engulfing candle pattern appears, it implies the beginning of a potential downward trend.
Caution:
Trading solely with this indicator has its limitations; hence users should cautiously integrate it with their trading strategies. Not all rising and falling engulfing patterns signify trend reversals.
Conclusion:
The Extended Engulfing Candle Pattern Indicator assists in identifying more reliable trend reversal points compared to the traditional engulfing candle patterns. By identifying the high and low points of consecutive candles, it minimizes false signals and helps traders make more accurate judgments on market movements.
확장 장악형 캔들 패턴 인디케이터
이 인디케이터는 표준 장악형 캔들 패턴을 발전시켜, 마켓에서 더 확실한 트렌드 전환 시그널을 포착합니다. 기존의 장악형 캔들 패턴은 종종 너무 이른 트렌드 전환 판단을 내리지만, 확장 장악형 인디케이터는 연속적인 상승 혹은 하락 캔들을 고려하여 더 보수적인 트렌드 전환점을 포착합니다.
특징:
연속 상승/하락 캔들 감지:
이 인디케이터는 연속적인 상승 또는 하락 캔들의 발생을 감지하여, 확장 장악형 캔들이 나타날 때 이를 고려합니다.
이는 단일 캔들 패턴보다 더 강력한 전환 시그널을 생성합니다.
시각적 표시:
차트의 상단과 하단에 “U”와 “D” 라벨을 표시하여, 사용자에게 상승 장악형 및 하락 장악형 패턴을 명확하게 보여줍니다.
반대 방향의 패턴이 나타날 때까지 라벨은 한 번만 표시됩니다.
개선된 정확도:
연속적인 캔들의 정보를 사용함으로써, 트렌드의 전환을 보다 보수적이고 정확하게 포착합니다.
이로 인해 기존의 장악형 캔들 패턴 대비 거짓 신호의 수가 줄어듭니다.
사용 방법:
상승 장악형 캔들 패턴이 표시되면, 이는 잠재적인 상승 트렌드의 시작을 나타냅니다.
반대로, 하락 장악형 캔들 패턴이 나타나면, 이는 잠재적인 하락 트렌드의 시작을 의미합니다.
주의사항:
이 지표만을 이용한 트레이딩에는 한계가 있을 수 있으므로 사용자는 본인의 트레이딩 전략과 결합하여 조심스럽게 사용해야 합니다. 모든 상승, 하락 장악형 패턴이 트렌드의 전환을 의미하지 않습니다.
결론:
확장 장악형 캔들 패턴 인디케이터는 기존의 장악형 캔들 패턴보다 더욱 신뢰할 수 있는 트렌드 전환 포인트를 식별할 수 있게 도와줍니다. 연속적인 캔들의 고점 및 저점을 식별함으로써 거짓 신호를 최소화하고, 트레이더들이 마켓의 움직임에 대해 보다 정확한 판단을 내릴 수 있게 합니다.

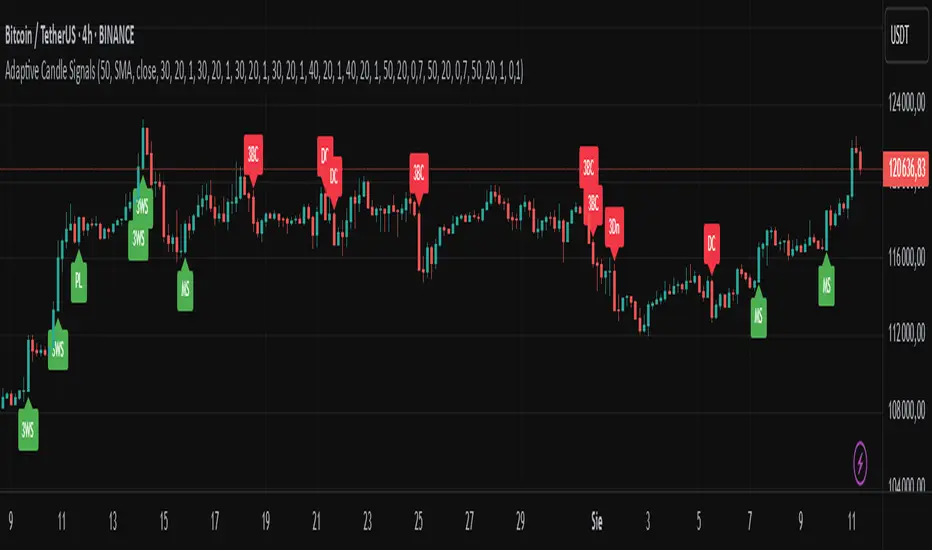
Adaptive Candle Signals█ OVERVIEW
The Adaptive Candle Signals indicator is a Pine Script® tool designed to identify key candlestick patterns on the chart, such as Bullish Engulfing, Bearish Engulfing, Piercing Line, Dark Cloud Cover, Morning Star, Evening Star, Three White Soldiers, Three Black Crows, and Three Inside Up/Down. The indicator allows customization of settings, including a Moving Average (MA) filter, candle size control, and maximum wick percentage, enabling precise adaptation to various trading strategies. Signals are displayed as labels on the chart, and each pattern can trigger alerts for user convenience.
█ CONCEPTS
The indicator is designed with flexibility and readability in mind. Its main features include:
Features
Signal Filtering: Enables the use of a Moving Average (MA) filter to confirm signals based on trend direction. Bullish signals are generated when the price is above the MA, and bearish signals when below.
Pattern Customization: Users can enable or disable individual candlestick patterns and adjust their parameters, such as maximum wick percentage or candle size multiplier. The candle size multiplier applies to the largest candle in the pattern and determines its minimum size relative to the average candle body size over a specified volatility period.
Labels and Colors: Signals are displayed as clear labels with customizable colors for bullish and bearish patterns.
Alerts: Each pattern has a dedicated alert function, facilitating integration with automated trading strategies.
List of Patterns
The indicator recognizes the following candlestick patterns (labels displayed in parentheses):
Bullish Engulfing (BE): Signals a potential upward reversal after a downtrend.
Bearish Engulfing (BE): Indicates a possible downward reversal after an uptrend.
Piercing Line (PL): A bullish pattern suggesting a bounce from support.
Dark Cloud Cover (DC): A bearish pattern indicating a potential downward reversal.
Morning Star (MS): A three-candle bullish pattern signaling an upward reversal.
Evening Star (ES): A three-candle bearish pattern indicating a downward reversal.
Three White Soldiers (3WS): A strong bullish signal based on three large bullish candles.
Three Black Crows (3BC): A strong bearish signal based on three large bearish candles.
Three Inside Up/Down (3Up/3Dn): Patterns indicating trend reversal based on an inside bar structure.
Settings
Settings are organized as follows:
MA Filter: Allows enabling a Moving Average (SMA, EMA, WMA) to filter signals based on trend direction.
Pattern Parameters: Each pattern has its own settings, such as volatility period, candle size multiplier, and maximum wick percentage. The size of the largest candle in the pattern is compared to the average candle body size over the specified volatility period.
Colors and Labels: Users can customize label colors and their distance from candles to improve readability.
█ SETTINGS
Detailed description of the indicator’s settings:
MA Filter:
Use MA Filter: Enables/disables the Moving Average filter.
MA Length: Specifies the period of the Moving Average (default: 50).
MA Type: Choose between SMA, EMA, or WMA.
MA Source: Select the data source (default: close price).
Pattern Settings:
Enable Pattern: Checkbox for each pattern (e.g., Bullish Engulfing, Morning Star).
Maximum Wick Percentage: Defines the maximum allowable wick size as a percentage of the candle body.
Big Candle Filter: Enables/disables checking if the largest candle in the pattern is larger than the average over the specified volatility period.
Volatility Period: Sets the period for calculating the average candle body size.
Candle Multiplier: Multiplier determining the minimum size of the largest candle in the pattern relative to the average candle body size over the specified volatility period.
Appearance:
Signal Text Color: Color of the label text (default: white).
Bullish Label Color: Color for bullish signals (default: green).
Bearish Label Color: Color for bearish signals (default: red).
Label Offset Factor: Controls the distance of labels from candles (from 0.0 to 1.0).
█ HOW TO USE
Add the indicator to your TradingView chart.
Configure the settings in the indicator’s dialog box:
Enable desired candlestick patterns.
Adjust the MA filter parameters to restrict signals to the trend.
Set colors and label offset for better readability.
Enable alerts for selected patterns to receive real-time notifications.
Monitor the labels on the chart and use them alongside other technical analysis tools.
█ LIMITATIONS
The indicator relies on historical price data and may produce false signals in volatile market conditions.
The big candle filter may be less effective on charts with low volatility.
The indicator performs best when combined with other analysis methods, such as support and resistance levels.
Strong Trend CandlesThis indicator highlights trend candles using a mathematically grounded method designed to identify moments when the market is truly dominated by buyers or sellers
Up-Trend Candle (UP):
The open is close to the session’s low.
The close is close to the session’s high.
This structure reflects sustained bullish control from start to finish.
Down-Trend Candle (DOWN):
The open is near the high.
The close is near the low.
This reflects clear bearish control throughout the session.
Precise Definitions Used:
UP-Trend Candle:
Open ≤ Low + 10% of range
Close ≥ High - 20% of range
DOWN-Trend Candle:
Open ≥ High - 10% of range
Close ≤ Low + 20% of range
Here, the range is simply High - Low.
Why are the thresholds different (10% vs 20%)?
This is intentional and based on how markets behave:
The opening price tends to be precise and stable in trend days. A strong trending candle usually opens very close to one end (high or low), reflecting a clean start without hesitation.
The closing price, however, often pulls back slightly before the end of the session—even during strong trends—due to profit-taking or last-minute volatility.
That’s why the close is allowed more tolerance (20%), while the open is held to a stricter threshold (10%). This balance allows the indicator to be strict enough to filter noise, yet flexible enough to capture real trends.
✅ Why this is useful
Unlike vague candle patterns like "bullish engulfing" or "marubozu," this method focuses strictly on structure and positioning, not color or subjective shape. It isolates the candles where one side clearly dominated, offering cleaner entries for breakout, continuation, or confirmation strategies.
You can use this tool to:
Spot high-momentum price action
Confirm breakouts or directional bias
Filter setups based on strong market conviction
🔹 How it works
An Up-Trend Candle is detected when the open is close to the daily low and the close is close to the daily high.
A Down-Trend Candle is detected when the open is close to the daily high and the close is close to the daily low.
The thresholds for “close to high/low” are configurable through the Open % of Range and Close % of Range inputs.
🔹 How to use it
Candles are colored according to their classification.
Colors can be customized in the settings.
This tool can be applied in any timeframe.
⚠️ Notes:
This script does not generate buy/sell signals.
It is designed to help visualize strong candles based on intraday range conditions.
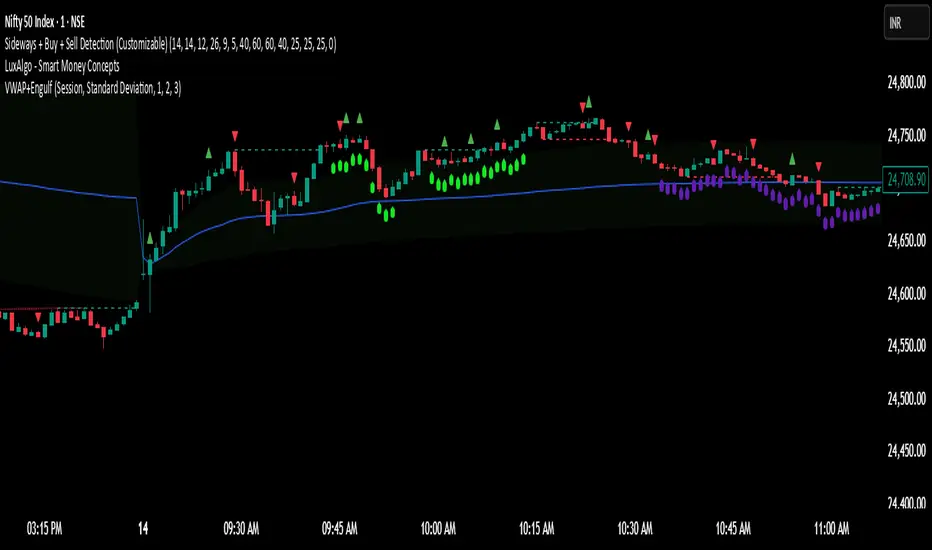
VWAP + Engulfing CandlesHere’s a clear breakdown of what your merged Pine Script does:
---
### 📌 **Indicator Name: VWAP + Engulfing Candles**
* This custom TradingView indicator **plots VWAP (Volume Weighted Average Price)** along with **up to 3 dynamic bands** around it.
* It also **detects Bullish and Bearish Engulfing Candlestick Patterns**, displaying visual markers and triggering alerts.
---
## 🔹 **1. VWAP Section**
### ➤ **Main Features:**
* Calculates VWAP anchored to a **customizable time period**:
* Options: Session, Week, Month, Quarter, Year, Decade, Century, Earnings, Dividends, Splits.
* Optional **hiding of VWAP on Daily/Weekly/Monthly charts** to reduce clutter.
### ➤ **Bands Around VWAP:**
* Up to **3 bands** can be plotted above and below the VWAP.
* Bands can be based on either:
* **Standard Deviation** of the price from VWAP (volatility-based), or
* **Percentage** deviation from VWAP (fixed range).
* You can control:
* Whether each band is shown
* Band width via multiplier (e.g., 1x, 2x, 3x)
### ➤ **Plot Colors:**
* VWAP: Blue
* Bands: Green (1x), Olive (2x), Teal (3x)
* Band fill areas are semi-transparent.
---
## 🔹 **2. Engulfing Candlestick Pattern Detector**
### ➤ **Bullish Engulfing Criteria:**
* Current candle opens **below** or **equal to** the close of the previous candle.
* Current candle opens **below** the previous candle's open.
* Current candle closes **above** the previous candle’s open.
### ➤ **Bearish Engulfing Criteria:**
* Current candle opens **above** or **equal to** the close of the previous candle.
* Current candle opens **above** the previous candle’s open.
* Current candle closes **below** the previous candle’s open.
### ➤ **Visual Signals:**
* 🔼 Green triangle **below bar** for **Bullish Engulfing**
* 🔽 Red triangle **above bar** for **Bearish Engulfing**
### ➤ **Alerts:**
* The script includes two alert conditions:
* One for Bullish Engulfing
* One for Bearish Engulfing
These alerts can be used to automate notifications for potential reversal points.
---
## 🛠️ **Use Cases**
* **Trend following or reversal spotting**: VWAP helps identify the average trading price; engulfing patterns often signal reversals.
* **Intraday and swing trading**: Works best on timeframes like 5m, 15m, 1h for intraday, or 4h, 1D for swing.
* **Mean reversion strategies**: Bands help spot overbought/oversold areas relative to VWAP.
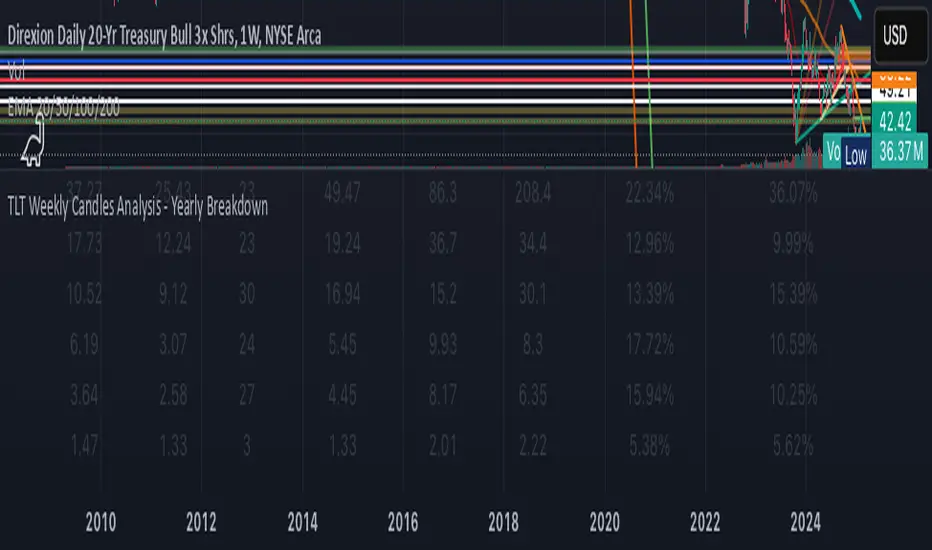
KAI QUANTUM Candles Analysis - Yearly BreakdownThe "KAI QUANTUM Analysis – Yearly Breakdown" indicator offers a comprehensive, year-by-year examination of candlestick behavior, enabling traders and analysts to gauge market dynamics over extended periods. Key features include:
Yearly Aggregation:
The indicator groups candlestick data by year, providing a clear snapshot of market behavior for each period.
Dual-Color Analysis:
It categorizes candles as bullish (green) or bearish (red) and computes statistics separately for each, allowing you to assess both upward and downward market trends.
Average Body Size & Candle Count:
For each year, the indicator calculates the average body size of green and red candles and tracks the total number of each, helping you understand overall market volatility and momentum.
Top 10 Candle Analysis:
It identifies the ten largest candles (by body size) in each year and computes their average size, offering insight into the most significant market moves during that period.
Largest Candle Metrics:
The indicator determines the absolute size of the largest green and red candles in each year.
Percentage Move Calculation:
In addition to absolute values, it computes the largest move as a percentage of the open price for both green and red candles. This allows you to see not only which year experienced the biggest moves but also how those moves compare relative to the opening price.
Clear Tabular Display:
All the computed statistics are organized in an on-chart table, making it easy to compare yearly trends at a glance.
Ideal for daily and higher timeframes, this indicator is a valuable tool for long-term market analysis, enabling you to identify trends, assess volatility, and make informed trading decisions based on historical market behavior.
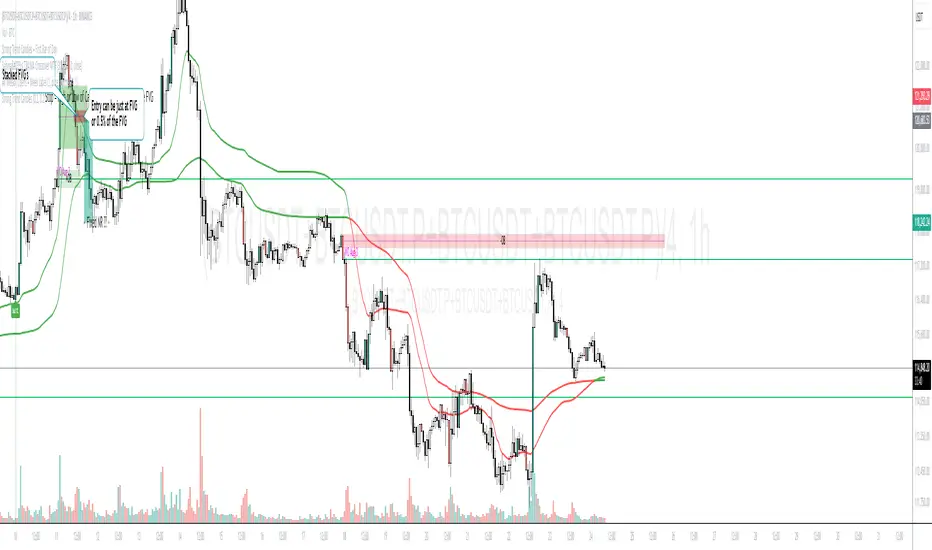
Exciting Candles by BitcoinBailyExciting Candles by BitcoinBaily — is a custom indicator that visually highlights "momentum" or "exciting" candlesticks on the chart.
It helps traders quickly identify candles with strong body-to-range ratios, i.e., candles showing strong price momentum (big move between open and close relative to the high-low range).
If the candle’s body is greater than or equal to the threshold percentage (say 85%), the bar is colored yellow. Otherwise, no color is applied.
Yellow Candle = Exciting Candle
The candle’s body occupies ≥ the set % (e.g., 85%) of the total high-low range.
Indicates strong momentum (buyers or sellers dominated most of that period).
No Color = Neutral / Normal Candle
Price moved both ways (upper & lower wicks), but neither buyers nor sellers fully dominated.
1. Range Breakout: When price breaks a sideways range and a yellow (exciting) candle appears,
it confirms that real momentum has entered — a good time to catch the move early.
2. Trend Pullback: If price dips to a moving average (like 20 or 50 SMA) and then forms a yellow
candle, it signals that buyers are regaining control — often a high-probability trend
continuation entry.
3. Exhaustion Top: A yellow bearish candle near a resistance area shows strong selling pressure
— a warning that the uptrend may be ending.
4. Sideways Market: When no yellow candles appear, the market lacks momentum — best to
stay out and avoid choppy trades.

Katz Candle Momentum Reversal Indicator v4.1Katz Candle Momentum Reversal Indicator (CMRI) v4.1
Overview
The Katz CMRI is a comprehensive trading indicator designed to identify trend direction, momentum shifts, and potential market reversals. It combines several different concepts into a single, cohesive visual tool.
At its core, the indicator uses a custom Line Break chart calculation to filter out market noise and a Heikin-Ashi-style formula to smooth price action. This combination helps to more clearly define the underlying trend. The main output is a dynamic, multi-colored trend line accompanied by various signals that appear directly on your chart. It's designed to help traders stay with the trend while also spotting key moments of expansion, contraction, and potential reversal.
How to Interpret the Indicator
The indicator has several key visual components:
Main Trend Line: This is the thick, central line that changes color.
Green: Indicates a bullish (upward) trend.
Red: Indicates a bearish (downward) trend.
Faded/Light Colors: Suggest a potential loss of momentum or a pullback within the trend.
White: Signals a significant break in the trend structure.
Trend Cloud: The shaded area between the main trend line and the white midline (mid). A green cloud shows the trend is above the midpoint, while a red cloud shows it's below.
Upper/Lower Bands: The aqua (Trend Up) and yellow (Trend Down) lines represent the recent highs and lows of the established trend. When price is pushing against these bands, it signals trend strength.
Background Colors:
Gray: A "Contraction Zone." This indicates that the trend is losing momentum and consolidating, warning of potential chop or a reversal.
Blue: An "Expansion Event." This highlights a sudden increase in momentum in the direction of the trend.
Signal Shapes:
Diamonds: These are the primary entry signals. A green diamond below a candle signals a potential long entry, while a red diamond above a candle signals a potential short entry.
⬆️⬇️ Arrows: These are secondary momentum signals. They can be used as confirmation that the trend is continuing.
Trading Strategy & Rules
This strategy uses the primary diamond signals for entries and trend changes for exits.
Long Trade (Buy) Rules
Entry: Wait for a green diamond to appear below the price candles. For confirmation, the main trend line should turn solid green, and the price should ideally be above the white midline.
Exit:
Stop Loss: Place a stop loss below the recent swing low or below the candle where the green diamond appeared.
Take Profit: Consider exiting the trade when a red diamond appears above the candles, signaling a potential trend reversal. Alternatively, a trader might exit if the background turns gray (Contraction Zone), indicating the bullish momentum has faded.
Short Trade (Sell) Rules
Entry: Wait for a red diamond to appear above the price candles. For confirmation, the main trend line should turn solid red, and the price should ideally be below the white midline.
Exit:
Stop Loss: Place a stop loss above the recent swing high or above the candle where the red diamond appeared.
Take Profit: Consider exiting the trade when a green diamond appears below the candles. A gray "Contraction Zone" can also serve as an early warning to exit as bearish momentum wanes.
Indicator Filters Explained
The indicator includes a "Trend Filter Type" setting that allows you to adjust its sensitivity. This can help reduce false signals in choppy markets.
Raw: This is the most sensitive setting. It will generate a trend change signal as soon as the basic conditions are met. Use this for scalping or in strongly trending markets, but be aware that it may produce more false signals.
OutStep: This is the default, balanced setting. It adds an extra layer of confirmation by requiring the main trend line itself to be moving in the direction of the new trend. For example, a new green signal will only be confirmed if the trend line's value is higher than its previous value. This helps filter out weak signals.
FullStep: This is the most conservative and filtered setting. It includes the "OutStep" logic and adds further conditions related to the upper and lower trend bands. This setting will produce the fewest signals, but they are generally the highest quality, making it suitable for swing trading or avoiding choppy market conditions.
Disclaimer
This indicator is a tool for technical analysis and should not be considered financial advice. All trading involves substantial risk, including the possible loss of principal. Past performance is not indicative of future results. The signals generated by this indicator are for educational and informational purposes only. You are solely responsible for any trading decisions you make. Use this indicator at your own risk.

Liquidation/Doji CandlesLiquidation/Doji Candles
This indicator highlights candles with a body length smaller than 30% of the candle’s total range. These candles are displayed in orange, representing potential liquidation points or doji candles.
The idea behind this tool is to help traders spot moments of market indecision, where buying and selling pressure are in balance. Such conditions often hint at institutional liquidation events or possible retail-driven reversals.
You can fully customize the detection sensitivity by adjusting the percentage input. This allows you to tighten or loosen the condition depending on your trading style and market preference.
To support passive traders, the script also includes built-in alerts for:
• The formation of a new liquidation/doji candle.
• A close above its high (bullish engulfment).
• A close below its low (bearish engulfment).
These alerts make it easier to stay on top of potential market shifts without needing to constantly monitor the charts.

Same-Direction Candles (Two Symbols)Same-Direction Candles (Two Symbols)
What it does
Highlights bars on your chart when two symbols print the same candle direction on the chosen timeframe:
Both Bullish → one color
Both Bearish → another color
Great for spotting synchronous moves (e.g., NQ & ES, QQQ & SPY), or confirming risk-on/risk-off with an inverse asset (e.g., NQ vs DXY with inversion).
How it works
For each bar, the script checks whether close > open (bullish), close < open (bearish), or equal (doji) for:
The chart’s symbol
A second symbol pulled via request.security() (optionally on a different timeframe)
If both symbols are bullish, it paints Bull color; if both are bearish, it paints Bear color. Dojis can be ignored.
Inputs
Second symbol: Ticker to compare (e.g., CME_MINI:ES1!, NASDAQ:QQQ, TVC:DXY).
Second symbol timeframe: Leave blank to use the chart’s TF, or set a specific one (e.g., 5, 15, D).
Invert second symbol direction?: Flips the second symbol’s candle direction (useful for inversely related assets like DXY vs indices).
Ignore doji candles: Skip highlights when either candle is neutral (open == close).
Coloring options: Toggle bar coloring and/or background shading; pick colors; set background transparency.
Alerts
Three alert conditions:
Both Bullish
Both Bearish
Both Same Direction (bullish or bearish)
Create alerts from the Add Alert dialog after adding the script.
Use cases
Index confluence: NQ & ES moving in lockstep
ETF confirmation: QQQ & SPY agreement
FX/Index risk signals: Invert DXY against NQ/ES to see when equity strength aligns with dollar weakness
Tips
For mixed timeframes (e.g., chart on 1m, ES on 5m), set Second symbol timeframe to the higher TF to reduce noise.
Keep Ignore dojis on for cleaner signals.
Combine with your own entry rules (structure, FVGs, liquidity sweeps).
Notes
Works on any symbol/timeframe supported by TradingView.
Overlay script; no strategy/entries/exits are executed.
Past performance ≠ future results; for education only.
Version: 1.0 – initial release (bar/background highlights, doji filter, inversion, multi-TF support, alerts).

Dump CandleThe "Dump Candle" indicator is a tool designed to help traders visualise potential "dump" candles on a altcoin's price chart. A dump candle is a transparent candle with pink outline and it shows where the price experiences a significant drop from its high to its close, indicating a potential sell-off or market weakness. These are usually caused by relatively smaller moves on BTC.
Features:
Customizable Percentage Drop: Traders can input the desired percentage drop threshold to define what constitutes a dump candle. This allows for flexibility in adapting the indicator to different market conditions and trading styles.
Historical Dump Candle Highlighting: Traders have the option to highlight historical dump candles on the chart, making it easier to spot past instances of significant price drops and analyze their impact on the market.
Average Dump Percentage: The indicator can calculate the average percentage drop of the five most recent dump candles, giving traders a sense of the typical magnitude of price drops in the current market environment.
Informative Label: A label is displayed next to the most recent dump candle, providing key information such as the percentage drop, the number of candles since the last dump, and the average dump percentage. This helps traders quickly assess the significance and context of the identified dump candle.
Usage:
Use the dump candle to find where to set your bids/buys for the moment when BTC drops to wipe out leveraged traders. This can be very lucrative, as your orders get wicked into, and price very quickly heads north again, meaning you are instantly in profit, and the overall market generally continues being bullish from that point, as people buy the dip. I place by bids at the 4H or 12H RMA14 moving average, in Fair Value Gaps, and at orderblocks. Obviously make sure to use a stop loss too

Wickless Candle IndicatorIt is designed to identify and visually highlight wickless candles on trading charts. A wickless candle is defined as a candle where the high equals either the open or close, and the low equals either the open or close, indicating no wicks.
Key features of the script include:
Customizable Line Width: Users can adjust the width of the lines drawn over wickless candles.
Wickless Candle Detection: A function isWickless is used to determine whether a candle is wickless based on its open, close, high, and low values.
Line Drawing and Management: The script draws lines over wickless candles and extends these lines as long as consecutive wickless candles are detected. The lines are terminated when a candle with a wick is encountered or when the line extends beyond one bar.
Visual Indicators: Wickless candles are marked with a cross shape above them, and lines are colored black for clear visibility.
Efficient Line Handling: The script uses variables to store and update line information, ensuring efficient management of the drawn lines as new price data comes in.
This indicator is particularly useful for traders who consider wickless candles significant in their analysis, providing an automated and visually clear way to identify these candles on a chart.
HTF Candle Overlay - PO3HTF Candle Overlay Script Description
This Pine Script indicator creates a visual overlay of higher timeframe (HTF) candles on your chart. It's a useful tool for multi-timeframe analysis that allows you to see higher timeframe price action context directly on your current chart without having to switch between timeframes.
Main Purpose
The primary purpose of this indicator is to display candles from a higher timeframe (like daily or weekly) directly on your lower timeframe chart (like 5-minute or hourly). This provides crucial context about the larger market structure while you're analyzing shorter-term price movements.
Key Features
Higher Timeframe Selection: You can choose any higher timeframe from the available options (1-minute to monthly), allowing you to view price action from any timeframe higher than your current chart.
Customizable Appearance:
Control the number of HTF candles displayed (1-10)
Adjust the spacing between the candles and current price
Modify candle width for better visibility
Customize colors for bullish and bearish candles, wicks, and borders
Real-time Updates: The current (ongoing) HTF candle updates in real-time as new price data comes in, showing you how the higher timeframe candle is developing.
Time Remaining Display: An optional label shows the current HTF period and how much time remains until the candle closes, helping you time your entries and exits.
Visual Warnings: The script warns you if you select a timeframe that matches your current chart timeframe.
How It Works
Data Retrieval: The script fetches both the current developing candle and historical candles from the selected higher timeframe using request.security() calls.
Candle Processing:
It stores candle data (open, high, low, close, and time) in arrays
Handles both the current developing candle and past completed candles
Updates the current candle in real-time as new price data comes in
Visual Rendering:
Draws candle bodies as boxes with appropriate bullish/bearish colors
Creates wicks as lines extending from the candle bodies
Places candles horizontally on your chart with proper spacing
Timing Information:
Calculates and displays the remaining time until the current higher timeframe candle closes
Formats the time remaining in a user-friendly way (days, hours, minutes)
Practical Applications
Context for Trading Decisions: See where price is in relation to higher timeframe support/resistance levels.
Entry and Exit Timing: Time your entries and exits based on higher timeframe candle closings.
Trend Alignment: Ensure your trades align with the higher timeframe trend direction.
Support/Resistance Identification: Easily identify key price levels from higher timeframes.
Candle Pattern Recognition: Spot important higher timeframe candlestick patterns without switching timeframes.
This indicator essentially brings the higher timeframe context directly to your current chart, allowing for more informed trading decisions that consider both short-term and long-term market structures simultaneously.

HTF Candle Overlay (Boxes + Wicks) 1hr / SolalDescription:
This indicator lets you visualize higher time frame (HTF) candles directly on a lower time frame chart.
It draws each HTF candle as a transparent box (the body) with wicks extending to the high and low. The boxes automatically update as each higher time frame candle forms and remain fixed once the candle closes.
You can choose any higher time frame (e.g., 1H, 4H, 1D) while trading on lower intervals (like 1m, 5m, 15m) to see key market structure and price zones.
Features:
Display candles from any higher time frame on your current chart.
Customizable colors for bullish and bearish candles.
Adjustable transparency, border and wick thickness.
History depth setting to control how many past HTF candles are displayed.
No repainting — candles stay fixed once closed.
Use case:
Ideal for traders who want to monitor higher time frame price action (support/resistance, trend direction) without switching chart time frames.

Strong Candle Detector (Candles Close UP/DOWN)The Strong Candle Detector highlights candles that close decisively above or below the previous candle’s range, which means the resting liquidity of the previous candle has been entirely absorbed.
How it works:
A candle is considered Bullish (UP) when its close is higher than the previous candle’s high.
A candle is considered Bearish (DOWN) when its close is lower than the previous candle’s low.
This tool helps traders:
Spot strong breakouts or breakdowns.
Know when a liquidity sweep of a previous candle's extremes has failed
Quickly identify potential momentum continuation or reversal points.
Improve chart clarity by emphasizing only significant candles.
⚠️ Note: This indicator does not provide buy/sell signals. It is meant as a visual aid to support your trading strategy.

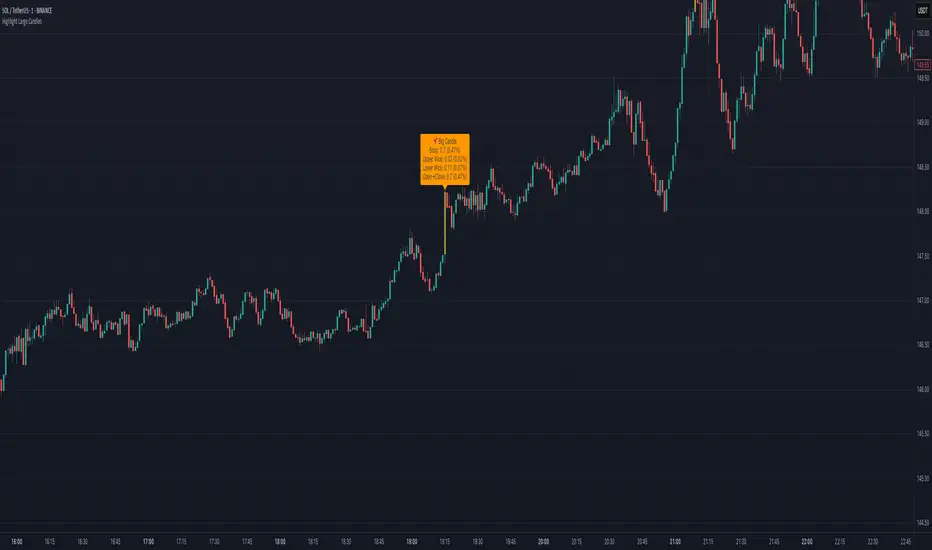
Highlight Large Candles// 🔍 Highlight Large Candles Indicator
// 🇬🇧 This indicator highlights candles where the full candle size (high - low) exceeds a user-defined percentage of the opening price (e.g., 1%).
// 🟠 When detected, the candle is colored orange and a label appears showing:
// - Body size
// - Upper wick size
// - Lower wick size
// - Open → Close distance (in price and %)
//
// 🔧 The minimum candle size threshold can be customized in the Settings.
// Ideal for identifying strong momentum or breakout candles.
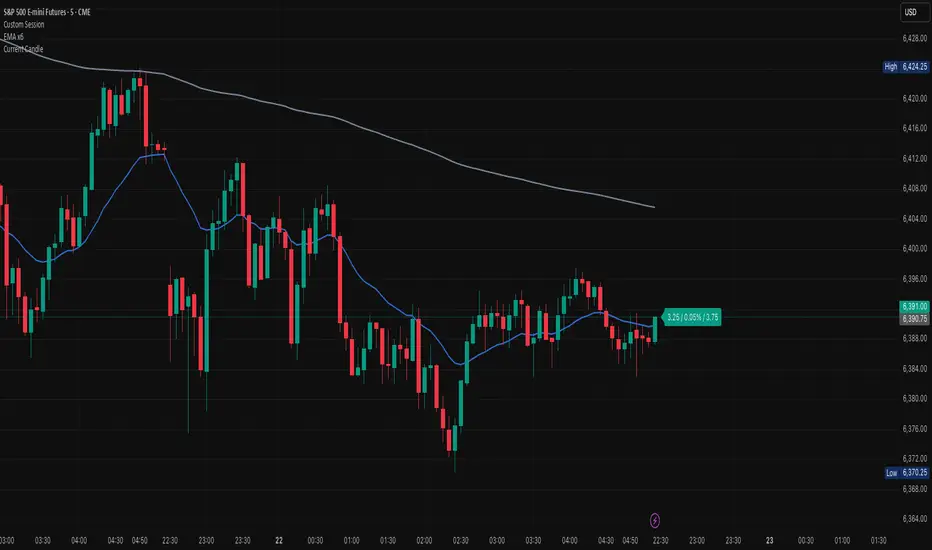
Current Candle### Overview
The **Current Candle** indicator displays live information about the active bar. It shows the price change, percentage change, and candle range (high–low), conveniently placed to the right of the current candle.
### Features
• Shows absolute price change from the previous close
• Shows percentage change (%)
• Shows candle range (high–low)
• Customizable bull and bear colors (default TradingView candle colors: green = rgb(8,153,129), red = rgb(242,54,44))
• Toggle on/off Value, Percentage, and Range individually
• Always updates on the latest candle only, keeping charts clean
### How to Use
1. Add the indicator to your chart.
2. Adjust the “Right offset (bars)” to position the label.
3. Enable or disable Value, Percentage, or Range via checkboxes.
4. Customize bull/bear colors to match your chart theme if desired.
### Notes
• Label is plotted only on the latest candle (`barstate.islast`) to avoid clutter.
• Colors cannot be automatically synced to your TradingView chart theme — use the color inputs to match them manually.
• This script is designed for clarity and quick reference without altering your chart’s candles.
---
*Stay focused on the current candle — see change, percentage, and range at a glance.*
HTF Candle Display (Evolution FX)HTF Candle Display (Evolution FX)
WHAT IT DOES
This tool overlays a **higher timeframe candle** (like Daily or Weekly) directly on your current lower timeframe chart (like 5m, 15m, 1h). It visually anchors current price action within its broader market context, ideal for traders using multi-timeframe confluence, liquidity mapping, or High-Timeframe-Based decision-making.
KEY FEATURES
Timeframe selection : Choose any higher timeframe (HTF) to display (e.g., D, W, M).
Dynamic candle placement : Position the HTF candle overlay away from price action using distance presets: `Close`, `Near`, `Far`, `Very Far`.
Adjustable thickness : Choose candle body width via `Thin`, `Thick`, or `Thicker` styles.
Fully customisable visuals : Set custom colours for bullish and bearish candles, borders, wicks, and labels.
Highlight box (optional) : Display a semi-transparent box aligned to the HTF candle's real time span.
Label with live countdown : Optionally show a floating label with timeframe info and time remaining in the HTF candle.
Previous candle display : Toggle to show or hide the prior HTF candle for better comparison.
HOW TO USE IT
Select your HTF (e.g., Daily) from the input dropdown.
Use "Distance From Price Action" to shift the visual away from the candles for a cleaner layout.
Adjust "Candle Width" to visually match your preferences.
Optionally toggle:
- "Show Previous Candle"
- "Show Label"
- "Highlight Current Day Price Action Box"
Customise your **colour scheme** to match your charting setup.
Recommended to use on charts like `15m`, `1h`, or `4h` for best visual clarity.
USE CASES
HTF liquidity hunting
Bias framing via daily/weekly structure
Institutional-style trading models
Scalping with macro trend context

Strong Engulfing Candlestick (With Alerts)Detect only Strong Bullish and Strong Bearish Engulfing candle patterns and provide visual signals along with alerts.
Key Features
Bullish Engulfing Detection:
Conditions:
Current candle's close > open (bullish).
Previous candle's close < open (bearish).
Current candle's high ≥ Previous candle's high (includes wicks).
Current candle's low ≤ Previous candle's low (includes wicks).
The body of the current bullish candle is stronger than the previous bearish candle.
Signal: Plots a green upward arrow below the bar when conditions are met.
Bearish Engulfing Detection:
Conditions:
Current candle's close < open (bearish).
Previous candle's close > open (bullish).
Current candle's high ≥ Previous candle's high (includes wicks).
Current candle's low ≤ Previous candle's low (includes wicks).
The body of the current bearish candle is stronger than the previous bullish candle.
Signal: Plots a red downward arrow above the bar when conditions are met.
Alerts:
Custom alerts are included for both bullish and bearish engulfing patterns:
Bullish Alert Message: "Strong Bullish Engulfing detected!"
Bearish Alert Message: "Strong Bearish Engulfing detected!"
