Same Day Past CandlesSame-Day Past Candles
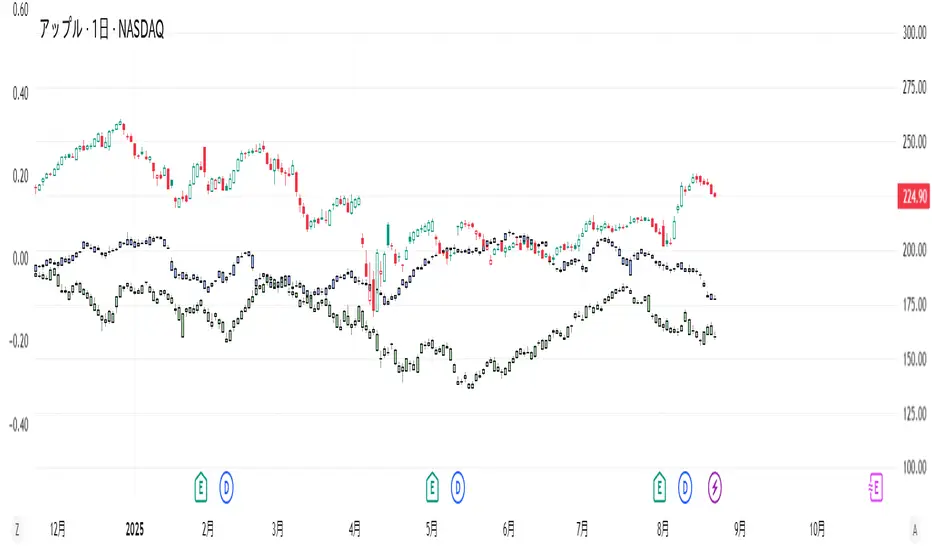
This indicator is a tool that plots the shapes of the candles from the same date one and two years ago directly on the current chart. By visually comparing past price movements, it can help you analyze seasonality and cyclical patterns.
Key Features
Plots Past Candles: Displays candles from the same date one and two years ago on your current chart.
Toggle Visibility: You can individually turn the display of the "1 year ago candle" and "2 years ago candle" on or off in the indicator's settings.
Candle Shape: The open, high, low, and close prices of the past candles are plotted, scaled to the current price range.
How to Use
Add this indicator to a daily chart for best results. The plotted candles are slightly offset upwards so they don't overlap with the current price, making it easier to compare the shape of the past candles with the current chart movement.
Visually checking how specific past price changes are reflected on the same day this year can provide insights for your trading strategy.
I do not speak English at all. Please understand that if you send me a message, I may not be able to reply, or my reply may have a different meaning. Thank you for your understanding.
"candle" için komut dosyalarını ara
HTF Candle Extremes Zigzag (Drawn on LTF)HTF Candle Extremes Zigzag (Drawn on LTF)
This indicator plots zigzag lines connecting the extremes (highs and lows) of Higher Timeframe (HTF) candles directly on your lower timeframe (LTF) chart. It visually highlights trend changes and HTF candle structure by drawing colored lines representing uptrends and downtrends based on HTF candle extremes.
"Key Features"
Higher Timeframe Tracking: Select any HTF to track candle extremes using the built-in security function.
Zigzag Lines: Connects HTF candle lows to highs in an intuitive zigzag pattern.
Trend Indication: Uptrend lines are green, downtrend lines are red (customizable colors).
Customizable Line Width: Adjust the thickness of the zigzag lines for better visibility.
Drawn on Lower Timeframe: All lines appear on your active lower timeframe chart, allowing easy visual correlation.
"How It Works"
The script fetches the open, high, low, close, and time data of the specified HTF candle. It detects new HTF bars and identifies trend direction changes by comparing the highs and lows of consecutive HTF candles.
- When an uptrend is detected, vertical lines are drawn from low to high of the HTF candle, connected to the previous extreme low.
- When a downtrend is detected, vertical lines are drawn from high to low, connected to the previous extreme high.
- Transitions between trends are highlighted by connecting the last extreme of the previous trend to the current extreme, creating a clean zigzag pattern.
Usage Notes:
Ideal for traders who want to visualize HTF market structure and trend changes while analyzing price action on lower timeframes.
---
© The_Forex_Steward
(mozilla.org)

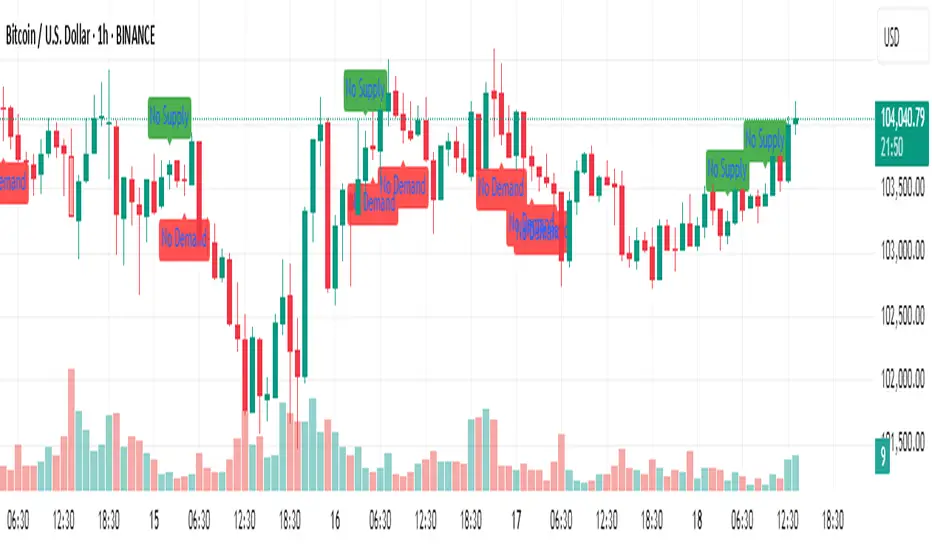
No Supply / No Demand Candle AlertsNo Supply Candle: A No Supply candle generally has a large body (close near high) with low volume. So, you would likely want the body percentage to be high, meaning the price action is concentrated near the high of the candle.
No Demand Candle: A No Demand candle generally has a large body (close near low) with low volume. You would want a high body percentage but with the close near low.
Umesh BC IST 3:30 AM Session Tracker + 4H Candles📌 IST 3:30 AM Session Tracker + 4H Candle Marker
This indicator is designed for traders who follow Indian Standard Time (IST) and want precise session tracking and 4H candle insights.
🔧 Features:
🕒 Daily Session Start at 3:30 AM IST
Automatically detects and marks the beginning of each new trading day based on 3:30 AM IST, not midnight.
Displays session Open, High, and Low lines.
Background shading for each session.
Customizable alert when a new day starts.
🟧 4H Candle Start Markers (IST Time)
Identifies every new 4-hour candle that starts at:
3:30, 7:30, 11:30, 3:30 PM, 7:30 PM, 11:30 PM IST
Adds a vertical line and label ("🟧 4H") above the candle.
Plots a dynamic line for the 4H candle's opening price.
Includes optional alert for new 4H candles.
🔔 Alerts Included:
"🕒 New IST Day Start": Triggers at 3:30 AM IST.
"🟧 New 4H Candle": Triggers at each 4H candle start (IST).
✅ Best for:
Intraday, swing, and institutional traders using IST-based analysis.
Those wanting more accurate daily sessions and clear candle structuring.

fractal candle The fractal candle technical indicator to identify potential trend reversals in financial markets. It works by counting a series of price bars and looking for specific patterns that indicate when a trend is likely to reverse.
How the Indicator Works:
Counting Candles:
The indicator compares the closing price of the current candle with the closing price from 4 candles ago.
If the current close is higher, the bullish (buy) count increases.
If the current close is lower, the bearish (sell) count increases.
When a count reaches 9 or 13, it may signal a trend reversal.
Buy and Sell Setup:
A buy setup occurs when there have been 9 consecutive candles where each close is lower than the close 4 candles before. This suggests a possible bullish reversal.
A sell setup occurs when there have been 9 consecutive candles where each close is higher than the close 4 candles before. This suggests a possible bearish reversal.
Support and Resistance Levels:
The indicator tracks previous highs and lows during buy/sell setups to identify potential support and resistance levels.
These levels can help traders decide where price might reverse or consolidate.
Candle Coloring for Visual Aid:
The script changes candle colors:
Red for sell signals 📉
Green for buy signals 📈
Different shades for overshoot conditions (extended trends)

Master Candle Breakout V1 Master Candle Breakout V1 - Indicator Description
The Master Candle Breakout V1 indicator is a powerful price action-based tool designed to help traders identify and capitalize on breakout opportunities from consolidation phases. This indicator is particularly useful for identifying master candles, which are large candles that encompass the range of subsequent candles, creating a key level of support or resistance. Once the price breaks above or below the range of the master candle, the indicator provides clear buy or sell signals, allowing traders to ride the momentum of the breakout.
Key Features:
Master Candle Detection: The indicator identifies master candles based on a user-defined period, marking them on the chart as critical breakout points.
Buy and Sell Signals: When the price breaks above the master candle's high, a buy signal is plotted. Similarly, when the price breaks below the master candle's low, a sell signal is generated. These signals are displayed on the chart with customizable shapes (diamonds, arrows, circles, crosses) and colors for easy visualization.
Stop-Loss Level Display: For risk management, the indicator calculates and plots a stop-loss level based on user-defined ticks above or below the master candle's high or low. The stop-loss value is shown as a label next to the signal, helping traders manage risk effectively.
Customizable Colors and Shapes: Users can fully customize the appearance of the signals, including the color of the buy/sell diamonds, the stop-loss label text color, and the type of shape used for the signals.
Versatile Application: The Master Candle Breakout V1 can be applied to any timeframe and market, from forex and stocks to commodities and cryptocurrencies, making it a highly versatile tool for traders of all types.
How to Use:
Master Candle Period: Define how many candles should follow the master candle for confirmation.
Stop Loss Ticks: Set the number of ticks above or below the master candle to define your stop-loss level.
Entry Signals: Once the price closes outside the high or low of the master candle, enter the trade accordingly (buy on breakouts above the high, sell on breakouts below the low).
Risk Management: Use the stop-loss level provided by the indicator to minimize losses and protect your capital.
This indicator is perfect for traders who prefer a simple, price-action-based strategy and want to avoid the clutter of traditional indicators. By focusing on the core principle of breakouts, Master Candle Breakout V1 helps traders quickly identify consolidation zones and potential breakout trades.

Candlestick Reversal SignalsTitle: Candlestick Reversal Signals
This Pine Script indicator is designed to identify and plot signals for two key candlestick reversal patterns: Bullish and Bearish Engulfing patterns, as well as Bullish and Bearish Harami patterns. These patterns are widely recognized for their ability to indicate potential trend reversals in the market, providing traders with valuable insights for making informed trading decisions.
Features:
• Bullish Engulfing Pattern:
• Conditions: This pattern is identified when the current candle’s close is higher than the previous candle’s open, and the current candle’s open is lower than the previous candle’s close. Additionally, the current candle’s close must be higher than the previous candle’s close, and the current candle’s open must be lower than the previous candle’s open.
• Signal: When a Bullish Engulfing pattern is detected, a green label is plotted below the relevant bar, indicating a potential upward reversal.
• Bearish Engulfing Pattern:
• Conditions: This pattern is identified when the current candle’s close is lower than the previous candle’s open, and the current candle’s open is higher than the previous candle’s close. Additionally, the current candle’s close must be lower than the previous candle’s close, and the current candle’s open must be higher than the previous candle’s open.
• Signal: When a Bearish Engulfing pattern is detected, a red label is plotted above the relevant bar, indicating a potential downward reversal.
• Bullish Harami Pattern:
• Conditions: This pattern is identified when the previous candle is a bearish candle (open higher than close), and the current candle is a bullish candle (close higher than open) that is contained within the body of the previous bearish candle.
• Signal: When a Bullish Harami pattern is detected, a green label is plotted below the relevant bar, indicating a potential upward reversal.
• Bearish Harami Pattern:
• Conditions: This pattern is identified when the previous candle is a bullish candle (open lower than close), and the current candle is a bearish candle (close lower than open) that is contained within the body of the previous bullish candle.
• Signal: When a Bearish Harami pattern is detected, a red label is plotted above the relevant bar, indicating a potential downward reversal.
Usage:
To use this script, simply add it to your TradingView chart. The script will automatically highlight the Bullish and Bearish Engulfing patterns, as well as Bullish and Bearish Harami patterns, by plotting green and red labels on the chart. These visual signals make it easy to spot potential reversal points, helping traders to identify and capitalize on trading opportunities.
Example:
• When you see a green “Bullish Engulfing” label below a candlestick, it suggests that the market might reverse upwards, signaling a potential buy opportunity.
• Conversely, a red “Bearish Engulfing” label above a candlestick suggests a potential downward reversal, signaling a potential sell opportunity.
• A green “Bullish Harami” label below a candlestick also indicates a potential upward reversal.
• A red “Bearish Harami” label above a candlestick indicates a potential downward reversal.
This indicator is a valuable addition to any trader’s technical analysis toolkit, providing clear and actionable signals based on well-established candlestick patterns. By incorporating these reversal patterns into your analysis, you can enhance your trading strategy and improve your decision-making process.
HTF Candle Consistency [LuxAlgo]The HTF Candle Consistency indicator tracks the most recent candle sentiment in up to 10 Higher Timeframe (HTF) and colors the user chart candle bodies based on the dominating sentiment. Users can weigh specific timeframes more significantly.
Additionally, the script provides an HTF dashboard that displays the current directional readouts for each selected timeframe to allow for an independent HTF analysis.
🔶 USAGE
Analyzing the movement and direction of higher timeframe candles can help filter out noisy variation from the price, and could be utilized to time trades better. When the majority of recent candles from the selected timeframes are bullish, the candle body will be colored in green, if this majority is bearish it will be colored in red.
Using the "Tricolor" coloring mode introduces a third coloring option, and is used when there isn't a clear sentiment majority across the selected timeframes, this option effectively allows for filtering out unwanted trends.
Users can control the variations to be filtered out depending on their chart timeframe and the enabled HTF's in the settings. Using low timeframes with higher HTF's will gray out a larger amount of candles, disabling these timeframes, changing them, or giving higher weighting to lower HTF's will allow for obtaining more dominance detection, and as such less grayed-out candles.
As seen above, the weight function allows for precise control over the specific elements being analyzed.
This indicator also features a dashboard for viewing each timeframe's direction at the same time. By doing so, it allows for better judgment on the specific elements composing the current HTF majority.
🔶 DETAILS
This indicator is only intended for Higher Timeframe Analysis, all the input timeframes should be kept equal to or lower than your current chart timeframe.
NOTE: This is necessary for data accuracy in most multi-timeframe indicators, and is generally a good practice to keep in mind.
As a reminder, the dashboard will display the timeframe in red text if a lower timeframe is detected. It is recommended to change or disable this timeframe for your analysis.
This indicator can support up to 10 timeframes, each with independent weightings.
NOTE: When a timeframe is disabled, the dashboard will no longer display that timeframe, and it will not be used in calculations.
🔹 Candle Coloring
Candle color can be selected between 3 modes.
Tricolor (Default): Changes the color based on a 3-part split of the possible data sum range.
Bicolor: Changes the color based on the sum being greater than or less than 0.
Gradient: Uses a 3-color gradient to determine the candle color based on the possible data sum range.
🔶 SETTINGS
🔹 Higher Timeframes
Toggle: Enable/Disable the timeframe from analysis.
Timeframe: Select which timeframe to use for analysis. <- NOTE: This input reflects any custom intervals you have created on Tradingview.
Weight: Determines the Weighting (Multiplier) for the timeframe's direction.
🔹 Style
Color Mode: (More details above) Determines the color mode in use for coloring candles.
🔹 Dashboard
General Settings: Control Toggle, Location, & Size of Dashboard on your chart.
Orientation: Choose to display the dashboard in a "Vertical (default)" or "Horizontal" orientation to fit your style.

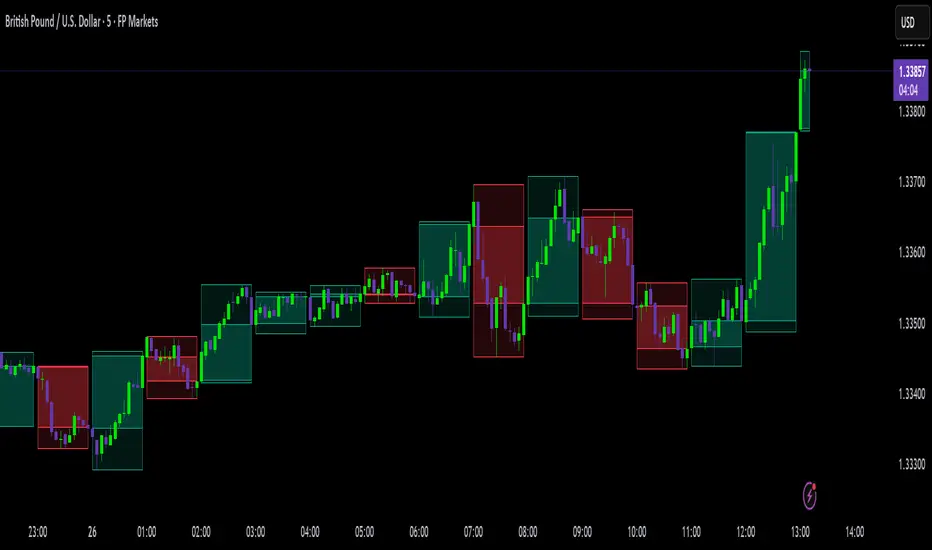
Red Candles with Green Precedent
**Title**: Red Candles with Green Precedent Indicator
**Description**:
This TradingView indicator is designed to help traders identify potential reversal or continuation patterns based on the appearance of consecutive red candles following a green candle. The script marks a region starting from a green candle that precedes at least four consecutive red candles, extending a box forward for a predefined number of bars to analyze the continuation of the trend.
**Key Features**:
- **Consecutive Red Candles Detection**: The indicator counts consecutive red candles that close lower than they open.
- **Initial Green Candle Identification**: Identifies the last green candle before a series of red candles begins. This green candle must close higher than it opens.
- **Visual Box Extension**: Creates a visual box from the open to the high of the green candle and extends it forward to highlight the period of interest.
- **Dynamic Box Termination**: Optionally terminates the box early if a significant green candle appears within the extension period, suggesting a potential reversal.
**Usage**:
1. **Setup**: Apply the indicator to any chart in TradingView. Adjust the number of consecutive red candles to track based on your trading strategy.
2. **Interpretation**: A visual green box will appear when the criteria are met. This box helps focus on the price action following a potentially significant green candle. Traders should watch for price actions within and around the box to make informed decisions.
3. **Alerts**: Consider setting alerts for when a new box is created or when a significant green candle forms that might terminate the box early, indicating potential market movements.
**Suitable for**: This indicator is suitable for traders looking for visual cues about potential bearish exhaustion or the setup for a bullish reversal, particularly in volatile markets.
---
Feel free to customize the description and features according to any additional details or personal insights you might want to include based on your trading experience or the specific behaviors of the markets you track.
**Disclaimer**:
This script is provided as a tool for trading analysis and is not intended to be used as the sole basis for any trading decisions. While this indicator aims to identify potential trading opportunities, its effectiveness can depend on market conditions and individual trading strategies. Users should conduct their own research and consult with professional advisors before making any investment decisions. The creator of this script assumes no responsibility for any potential financial losses incurred from using this indicator. Trading in financial markets involves risk, and it is possible to lose more than your initial investment.
---

Pump and Dump CandlesDescription:
The Pump and Dump Candles indicator is a robust tool designed to assist traders in identifying potential pump and dump scenarios within the financial markets. This innovative indicator combines key elements of price action and volatility to provide valuable insights into market manipulations and potential risks. This indicator uses ATR to standardize candle sizes as they vary across different assets and timeframes; by using a percentage of the ATR, you can adjust the threshold dynamically based on the volatility of each asset.
Features:
- Pump/dump candles: Candle bars are colored green when it is pumping and red when it is dumping.
- Pump/dump rallies: The background turns green during sequences of consecutive pumping candles and red in the presence of sustained dumping.
- Candle Size Percentage: Users have the flexibility to define a personalized percentage for calculating candle size.
- Wick Exclusion: This option factors in pump and dump candles with substantial body sizes, mitigating the impact of bars with large wicks and smaller candle bodies.
( These inputs can all be modified within the indicator settings )
Utility:
Understanding pump and dump candles and rallies can be a valuable asset for traders seeking to navigate volatile markets effectively. By closely monitoring the color-coded indicators that highlight pumping and dumping phases, traders gain insights into abrupt and often exaggerated price movements. This information aids in identifying potential short-term trends and anticipating market reversals. Pump and dump rallies, signaled by consecutive pumping or dumping candles, provide a visual representation of sustained buying or selling pressure, allowing traders to assess the strength and duration of market sentiment. Armed with this knowledge, traders can make informed decisions, implement risk management strategies, and capitalize on short-term opportunities, thereby enhancing their overall trading proficiency in dynamic market conditions.

Bullish Candle Highlighter by MalviyaOverview:
The Bullish Candle Highlighter is a comprehensive and user-friendly TradingView indicator designed to assist traders in identifying individual bullish candles, facilitating the recognition of potential bullish trends and reversal patterns. This tool is meticulously crafted to enhance the precision of your technical analysis, making it an essential addition to your trading arsenal.
Key Features:
Bullish Candle Identification:
The indicator meticulously scans price action, pinpointing individual candles with a bullish bias.
Each identified bullish candle is distinctly marked on the chart for easy recognition.
Minimum Body Size Filter:
To refine the selection of signals, the indicator incorporates a minimum body size filter.
This filter ensures that only candles with a significant body size are considered, reducing noise and enhancing the reliability of bullish signals.
Visual Highlighting:
Bullish candles are visually highlighted with a vibrant green background, ensuring they stand out on your chart.
The visual cues simplify the process of identifying potential entry points during bullish market conditions.
How to Use:
Bullish Candle Identification:
Keep an eye on the chart for instances where the indicator marks a candle with the label "Bullish Candle."
Each marked candle signifies a potential bullish reversal or continuation pattern.
Buy Signal:
Consider entering a long position when the current candle closes above the high of the identified bullish candle.
The indicator's signals can be used to align your trading decisions with emerging bullish trends.
Advanced Tips:
Confirmation with Other Indicators:
Boost the accuracy of your trades by combining Bullish Candle Highlighter signals with other technical indicators or trend analysis tools.
Risk Management:
Implement sound risk management strategies to protect your capital and optimize your trading performance.
Important Note:
The Bullish Candle Highlighter is a valuable tool, but no indicator guarantees profits. Always conduct thorough analysis and consider multiple factors before making trading decisions.
Disclaimer:
This indicator is provided for educational purposes and is not financial advice. Trading involves risk, and past performance is not indicative of future results.
Feel free to tailor the description to match any specific features or nuances of your indicator. Providing detailed information and usage guidance will help users understand and maximize the benefits of your Bullish Candle Highlighter.

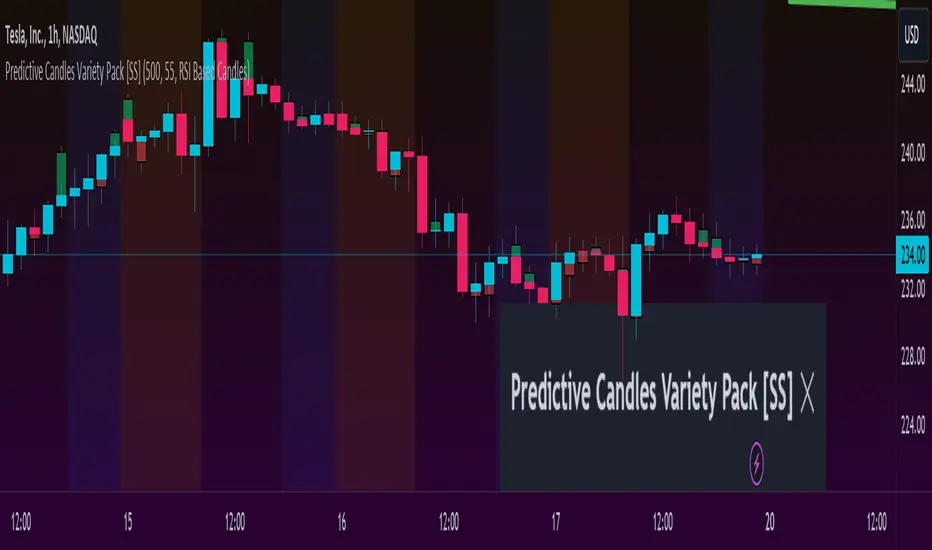
Predictive Candles Variety Pack [SS]This indicator provides you with the ability to select from a variety of candle prediction methods.
It permits for:
👉 Traditional Linear Regression Candle Predictions
👉 Candle Predictions based on the underlying Stochastics
👉 Candle Predictions based on the underlying RSI
👉 Candle Predictions based on the underlying MFI
👉 Candle Predictions based on the EMA 9
👉 Candle Predictions based on ARIMA modelling
Which is best?
Each method serves its unique purpose.
Here are some general tips of which candles are better suited for what:
🎯Trend Following🎯
For Trend following, the EMA 9 would be an appropriate choice of candle as it helps you to identify the current trend and potential early pullbacks/reversals.
🎯Momentum Following🎯
Momentum following is best carried out with the Stochastics Candles.
🎯Pullback Determination🎯
Pullback Determination is best accomplished through the RSI candles, as the ranges compress or expand based on the current state of oversold/overboughtness.
🎯Detrended Range🎯
To see the detrended range of where the ticker should be falling, absent the trendy noise, it's best to use the ARIMA candles.
Other Features
👉 Other features include a Backtest option that can be toggled on or off and will backtest over the length of the assessment. I don't recommend leaving it on as it can be resource-heavy on Pinescript though.
👉 The ability to adjust the transparency of the candles if you want them to be more or less visible.
Troubleshooting Note
The ARIMA modeling version is extremely resource-heavy, as it has to fully develop an ARIMA model. I have tried to optimize it by reducing the lagged assessment to just 2 lags. If you are using a free or non-premium membership, you may need to reduce the length of the assessment.
And that's it! Pretty straightforward indicator.
Hope you enjoy it!
((Bullish)) Candle below EMA Hello People of the Trading World...
Todays script is a basic concept of using Moving Averages and Candle Closes - this works best on Higher Timeframes and only in Bullish Conditions
"When the market is trending to the upside - we tend to see price overextend from the moving average and price revert back to the mean (Mean Reversion)"
You may ask why would you want this candle - this presents good opportunities in a trending market (NOT AN ENTRY CANDLE). This can be useful to get into existing trends which you may have missed
This candle will display when the candle close is below one of the below EMAS
9EMA
50EMA
100EMA
You can choose which one to show ie if the 21ema wasnt important but the 100ema was... turn off the 21ema and 50ema and this will display candle below the 100ema
This candle can be alerted in the settings so if price does close you wont miss it.
EXMAPLES:
If you find this script useful please leave a comment and a thumbs up :)

Better Heiken-Ashi Candles w/ Expanded Source Types [Loxx]Better Heiken-Ashi Candles w/ Expanded Source Types is an indicator to compare regular candles to traditional Heiken-Ashi candles to "better" Heiken Ashi candles. This indicator and comparison study appears an oscillator. The purpose of this indicator is to demonstrate a better way to calculate HA candles and also to demonstrate expanded source types. This indicator is meant to be used by advanced Pine Coders who wish to add fine-tuning to their indicators and strategies.
What are Heiken Ashi "better" candles?
The "better formula" was proposed in an article/memo by BNP-Paribas (In Warrants & Zertifikate, No. 8, August 2004 (a monthly German magazine published by BNP Paribas, Frankfurt), there is an article by Sebastian Schmidt about further development (smoothing) of Heikin-Ashi chart.)
They proposed to use the following :
(Open+Close)/2+(((Close-Open)/(High-Low))*ABS((Close-Open)/2))
instead of using :
haClose = (O+H+L+C)/4
According to that document the HA representation using their proposed formula is better than the traditional formula.
What are traditional Heiken-Ashi candles?
The Heikin-Ashi technique averages price data to create a Japanese candlestick chart that filters out market noise.
Heikin-Ashi charts, developed by Munehisa Homma in the 1700s, share some characteristics with standard candlestick charts but differ based on the values used to create each candle. Instead of using the open, high, low, and close like standard candlestick charts, the Heikin-Ashi technique uses a modified formula based on two-period averages. This gives the chart a smoother appearance, making it easier to spots trends and reversals, but also obscures gaps and some price data.
What's going on with this indicator?
- First, we have the options to select the candlestick type: Regular, HA, HA Better
- Next, and to demonstrate the expanded source types, I've added a simple moving average. In the drop down for the SMA source you'll notice something very different from the typical TradingView source selector. Here's how to decode the new names for the sources:
Close = close
Open = open
High = high
Low = low
Median = hl2
Typical = hlc3
Weighted = hlcc4
Average = ohlc4
Average Median Body = (open+close)/2
Trend Biased = (see code, too complex to explain here)
Trend Biased (extreme) = (see code, too complex to explain here)
... for HA and HA better, see the same set up as above but with different open and close values to calcualate the other source types
- For the HA better calculations, we run the close value through either an Adaptive, Kaufman, or T3 smoothing filter. The length for these smoothing filters, either 2 or 3, can be found in the code and is a constant value that shouldn't be changed. This smoothing is in inline with what is described in the article mentioned above
- Lastly, I've placed an SMA over the oscillator so that the user can test out the various sources explained above
Included:
- Toggle on/off bar coloring

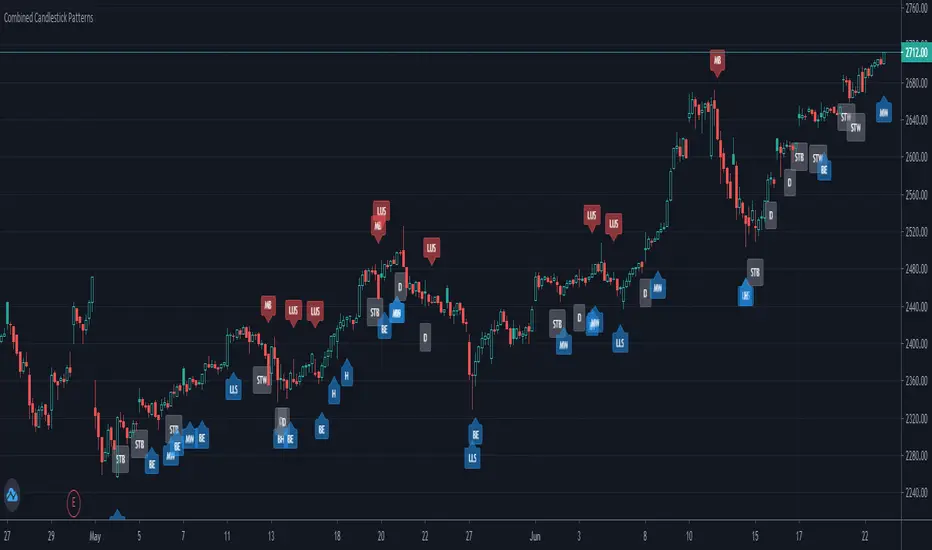
Combined Candlestick PatternsI combined all the build-in candlestick patterns scripts into one single script so anyone who does not have a Pro plan can display all the patterns in the same chart.
Leave a comment for any feedback!
<50% Body CandleScript to identify candlesticks with less than 50% body of total high low candlestick. Places a dot inside the candle. Make sure indicator is moved in the top of Objects Tree so the dot will not be hidden behind the candlebar.

[AlscapeLabs] HTF Candle Stack (Multi-Timeframe)
Overview
The HTF Candle Stack (Multi-TF) indicator is a powerful visualization tool designed to overlay high-timeframe (HTF) price action directly onto your current chart, independent of the chart's price scale. This gives traders a clear, aligned, and non-overlapping view of simultaneous price movements across customizable timeframes.
By stacking the candles horizontally next to the chart's price action, the indicator allows for quick identification of multi-timeframe correlation, trend confluence, and key levels without switching chart timeframes.
Key Features
6 Independent Stacks: Configure up to 6 separate timeframes (e.g., 5m, 15m, 1H, 4H, Daily, Weekly) to view the complete market fractals from micro to macro.
Price-Aligned Visualization : All HTF candle stacks are perfectly aligned with the main chart's vertical price axis
Replay Mode Safe : Includes dedicated logic to prevent "duplicate candles" during Bar Replay, ensuring accurate backtesting and historical analysis.
Toggleable Stacks : Each stack can be individually enabled or disabled via input settings
Dynamic Spacing : The distance between active stacks is automatically calculated and adjusted based on the visibility of the preceding stack.
Settings Guide
Stack Configuration (1 - 6)
Each of the six stacks has identical controls:
Show/Hide : Enable or disable this specific stack.
Timeframe : The specific HTF to display (e.g., "60" for 1 Hour, "D" for Daily).
[*} Count : How many candles to show in this stack (Current Active Candle + Past Closed Candles). Tip: Use higher counts (10-12) for lower TFs (Stack 1-2) and lower counts (2-4) for higher TFs (Stack 5-6)
Candle Color
Controls global coloring
Bullish / Bearish : Customize the body colors.
Wick : Separate control for wick color and transparency
Layout
Distance from Chart : How far (in bars) to the right the first stack begins
Space between Stacks : The gap (in bars) between each active stack.
Candle Width : The thickness of the HTF candles.
Labels
Displays a time-frame next to the active (live) candle in each stack
Show TF Labels : Enable or disable labels through all stacks
Text Color : Label text color
Background : Label background color
Style : Label position (Left, Down)
Size : Label text size (Tiny, Small, Normal, Large, Huge)
Developed by AlscapeLabs

Multi-Candle Reversal ConfirmationMulti-Candle Reversal Confirmation (MCRC)
This indicator identifies potential price reversals using a 3-candle confirmation pattern. It filters out noise by requiring a significant prior trend before signaling, helping you catch turning points rather than getting trapped in choppy price action.
How It Works
The indicator uses a three-step process to confirm reversals:
Candle 1 (Rejection) - Detects a rejection candle after a sustained move. This includes hammer/shooting star patterns with long wicks, doji candles showing indecision, or stall candles with unusually small bodies.
Candle 2 (Reversal) - Confirms the candle closes in the opposite direction of the prior trend.
Candle 3 (Confirmation) - Validates the reversal by either continuing in the new direction or breaking the high/low of the previous candle.
Key Features
Requires a significant prior trend before looking for reversals (no signals in choppy, sideways markets)
Uses ATR to measure move significance, adapting to current volatility
Marks rejection candles with small circles for early awareness
Confirmed signals shown as triangles with Bull/Bear labels
Built-in alerts for all signal types
Settings
Wick to Body Ratio - How pronounced the rejection wick must be compared to the candle body (default: 2.0)
Doji Threshold - Maximum body size relative to total range to qualify as a doji (default: 0.1)
Trend Lookback - Number of candles to analyze for prior trend detection (default: 5)
Trend Strength - Percentage of lookback candles required in trend direction (default: 0.6 = 60%)
Minimum Move (ATR multiple) - How large the prior move must be before signaling (default: 1.5)
Show Bullish/Bearish - Toggle each signal type on or off
Visual Signals
Small Circle - Marks potential rejection candles (first candle in the pattern)
Green Triangle (Bull) - Confirmed bullish reversal signal
Red Triangle (Bear) - Confirmed bearish reversal signal
Alerts
Three alert options are available:
Bullish Reversal Confirmed
Bearish Reversal Confirmed
Any Reversal Confirmed
How To Set Up Alerts
Add the indicator to your chart
Right-click on the chart and select "Add Alert" (or press Alt+A)
In the Condition dropdown, select "Multi-Candle Reversal Confirmation"
Choose your preferred alert type
Set notification preferences (popup, email, sound, webhook)
Click "Create"
Tips For Best Results
Combine with key support/resistance levels for higher probability trades
Use higher timeframe trend direction as a filter
Adjust Trend Lookback based on your timeframe (higher for longer timeframes)
Increase Minimum Move ATR in volatile conditions to reduce false signals
Signals appearing near VWAP, moving averages, or prior day levels tend to be more reliable
Note: This indicator is for informational purposes only and should not be used as the sole basis for trading decisions. Always use proper risk management and consider combining with other forms of analysis.
3/4-Bar GRG / RGR Pattern (Conditional 4th Candle)This indicator can be used to identify the Green-Red-Green or Red-Green-Red pattern.
It is a price action indicator where a price action which identifies the defeat of buyers and sellers.
If the buyers comprehensively defeat the sellers then the price moves up and if the sellers defeat the buyers then the price moves down.
In my trading experience this is what defines the price movement.
It is a 3 or 4 candle pattern, beyond that i.e, 5 or more candles could mean a very sideways market and unnecessary signal generation.
How does it work?
Upside/Green signal
Say candle 1 is Green, which means buyers stepped in, then candle 2 is Red or a Doji, that means sellers brought the price down. Then if candle 3 is forming to be Green and breaks the closing of the 1st candle and opening of the 2nd candle, then a green arrow will appear and that is the place where you want to take your trade.
Here the buyers defeated the sellers.
Sometimes candle 3 falls short but candle 4 breaks candle 1's closing and candle 2's opening price. We can enter on candle 4.
Important - We need to enter the trade as soon as the price moves above the candle 1 and 2's body and should not wait for the 3rd or 4th candle to close. Ignore wicks.
I have restricted it to 4 candles and that is all that is needed. More than that is a longer sideways market.
I call it the +-+ or GRG pattern.
Stop loss can be candle 2's mid for safe traders (that includes me) or candle 2's body low for risky traders.
Back testing suggests that body low will be useless and result in more points in loss because for the bigger move this point will not be touched, so why not get out faster.
Downside/Red signal
Say candle 1 is Red, which means sellers stepped in, then candle 2 is Green or a Doji, that means buyers took the price up. Then if candle 3 is forming to be Red and breaks the closing of the 1st candle and opening of the 2nd candle then a Red arrow will appear and that is the place where you want to take your trade.
Sometimes candle 3 falls short but candle 4 breaks candle 1's closing and candle 2's opening price. We can enter on candle 4.
We need to enter the trade as soon as the price moves below the candle 1 and 2's body and should not wait for the 3rd or 4th candle to close.
I have restricted it to 4 candles and that is all that is needed. More than that is a longer sideways market.
I call it the -+- or RGR pattern.
Stop loss can be candle 2's mid for safe traders ( that includes me) or candle 2's body high for risky traders.
Back testing suggests that body high will be useless and result in more points in loss because for the bigger move this point will not be touched, so why not get out faster.
Important Settings
You can enable or disable the 4th candle signal to avoid the noise, but at times I have noticed that the 4th candle gives a very strong signal or I can say that the strong signal falls on the 4th candle. This is mostly a coincidence.
You can also configure how many previous bars should the signal be generated for. 10 to 30 is good enough. To backtest increase it to 2000 or 5000 for example.
Rest are self explanatory.
Pointers
If after taking the trade, the next candle moves in your direction and closes strong bullish or bearish, then move SL to break even and after that you can trail it.
If a upside trade hits SL and immediately a down side trade signal is generated on the next candle then take it. Vice versa is true.
Trades need to be taken on previous 2 candle's body high or low combined and not the wicks.
The most losses a trader takes is on a sideways day and because in our strategy the stop loss is so small that even on a sideways day we'll get out with a little profit or worst break even.
Hold targets for longer targets and don't panic.
If last 3-4 days have been sideways then there is a good probability that day will be trending so we can hold our trade for longer targets. Target to hold the trade for whole day and not exit till the day closes.
In general avoid trading in the middle of the day for index and stocks. Divide the day into 3 parts and avoid the middle.
Use Support/Resistance, 10, 20, 50, 200 EMA/SMA, Gaps, Whole/Round numbers(very imp) for identifying targets.
Trail your SL.
For indexes I would use 5 min and 15 min timeframe.
For commodities and crypto we can use higher timeframe as well. Look for signals during volatile time durations and avoid trading the whole day. Signal usually gives good targets on those times.
If a GRG or RGR pattern appears on a daily timeframe then this is our time to go big.
Minimum Risk to Reward should be 1:2 and for longer targets can be 1:4 to 1:10.
Trade with small lot size. Money management will happen automatically.
With small lot size and correct Risk-Re ward we can be very profitable. Don't trade with big lot size.
Stay in the market for longer and collect points not money.
Very imp - Watch market and learn to generate a market view.
Very imp - Only 4 candles are needed in trading - strong bullish, strong bearish, hammer, inverse hammer and doji.
Go big on bearish days for option traders. Puts are better bought and Calls are better sold.
Cluster of green signals can lead to bigger move on the upside and vice versa for red signals.
Most of this is what I learned from successful traders (from the top 2%) only the indicator is mine.

High Timeframe Candle Overlay (Configurable)HTF Candle Overlay — Read Higher Timeframe on Lower Timeframe Charts
What it does
This indicator draws each selected Higher-Timeframe (HTF) candle directly on your lower-timeframe (LTF) chart. It shows a translucent range box (HTF high–low) and an inner body box (HTF open–close), so you can track how the bigger candle is forming while you analyze lower-timeframe structure, liquidity sweeps, and intrabar reactions.
Why it’s helpful
• See where the current HTF candle opened, where price sits inside its body, and how far wicks extend—without leaving your LTF chart.
• Combine HTF context (e.g., 1H/4H) with LTF execution (e.g., 1m–15m) to spot confluence, S/R flips, and failed breaks faster.
• The overlay is locked to the price scale and anchored by bar index, so it pans/zooms exactly with your chart (no drifting while dragging).
⸻
How it works (under the hood)
• Fetches HTF OHLC via request.security.
• When a new HTF bar starts, the previous HTF boxes are frozen at the true close.
• The current HTF bar updates intrabar (so you see live formation) and is clamped to the correct span.
• Horizontal anchoring uses bar index, and a hidden price plot binds the script to the main price scale for stable zoom/pan behavior.
⸻
Inputs
• High Timeframe (HTF): Default 1H (set any TF you like).
• Show High–Low Box: On/off.
• Show Body Box (Open–Close): On/off.
• Opacity for range/body boxes.
• Bull/Bear Colors and Outline + Width.
• Max HTF Candles to Keep: Auto-deletes older boxes to maintain performance.
⸻
Usage tips
• Popular combos: view 1H or 4H candles while trading 1–15m charts.
• Turn off the range box if you only want a clean HTF body overlay.
• Pair with your session/structure tools; this indicator is visual context only (no signals or alerts).
⸻
Notes & limitations
• Non-repainting for closed HTF bars: once an HTF candle closes, its boxes are fixed. The current/in-progress HTF bar updates until it closes (expected live behavior).
• Data alignment depends on your symbol’s feed and session settings. Heikin Ashi/renko/etc. may not match classic OHLC.
• Heavy history + many boxes can affect performance; reduce “Max HTF Candles to Keep” if needed.
⸻
Disclaimer
This script is for education and charting visualization only. It does not provide financial advice, trade signals, or performance guarantees. Always do your own research and manage risk.
[RealEdgeFX] - Manipulation CandleOverview
The Manipulation Candle indicator highlights potential liquidity grabs and false breakouts directly on the chart. It focuses on moments when price sweeps prior highs or lows but closes in the opposite direction, suggesting a possible manipulation before a market reversal.
Core Logic
The indicator compares the current candle against the previous one and colors the bar when specific conditions are met:
Sell Manipulation (dark red)
When the current candle breaks above the previous high but then closes below the prior low.
→ This often signals a stop hunt to the upside followed by bearish intent.
Buy Manipulation (light green)
When the current candle breaks below the previous low but then closes above the prior high.
→ This suggests a liquidity sweep to the downside before bullish continuation.
Neutral candles remain uncolored to avoid clutter and keep the focus on high-impact moments.
Design Approach
Clarity: Only the candles that meet strict criteria are marked, reducing noise.
Liquidity Focused : Built for traders who want to quickly spot manipulative price action.
Non-Repainting : Once a candle is identified as manipulation, the color stays fixed.
Usage
Add it as an overlay on your chart.
Watch for green or red manipulation candles as alerts of possible reversals or liquidity events.
Combine with your own market structure or bias tools to increase accuracy.
Dominance Candle Raja Saien (Detector with Alerts)Dominance Candle Finder with Alerts by Raja Saien
This powerful indicator is designed to detect dominance candles—those strong-bodied candles that often signify momentum and trend strength. Whether you're trading breakouts, trend continuations, or reversals, this tool helps you identify key market moves in real time with optional alerts.
🔍 Features:
Automatic Detection of Dominance Candles: Highlights candles with strong body size, showing decisive market movement.
Customizable Thresholds: Adjust sensitivity according to your strategy or asset volatility.
Built-in Alerts: Get notified the moment a dominance candle forms—no need to stare at charts all day!
Multi-Timeframe Compatibility: Works on any timeframe from 1-minute to daily or higher.
📊 Use Cases:
Entry confirmation on breakouts
Trend strength analysis
Volatility surge detection
Combine with support/resistance or order block zones for powerful setups
Tip: Best used with strong support/resistance levels or price action strategies for confluence

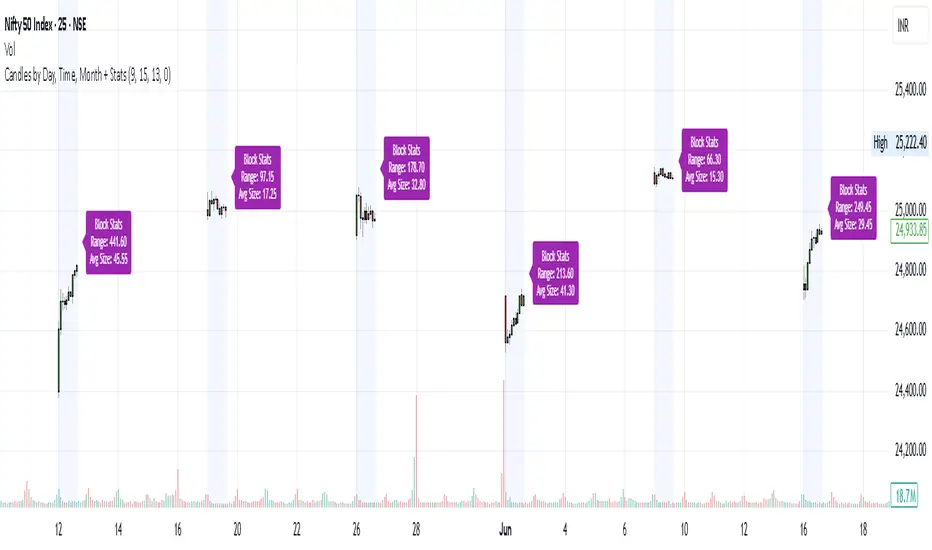
Candles by Day, Time, Month + StatsThis Pine Script allows you to filter and display candles based on:
📅 Specific days of the week
🕒 Custom intraday time ranges (e.g., 9:15 to 10:30)
📆 Selected months
📊 Shows stats for each filtered block:
🔼 Range (High – Low)
📏 Average candle body size
⚙️ Key Features:
✅ Filter by day, time, and month
🎛 Toggle to show/hide the stats label
🟩 Candles are drawn only for selected conditions
📍 Stats label is positioned above session high (adjustable)
⚠️ Important Setup Instructions:
✅ 1. Use it on a blank chart
To avoid overlaying with default candles:
Open the chart of your preferred symbol
Click on the chart type (top toolbar: "Candles", "Bars", etc.)
Select "Blank" from the dropdown (this will hide all native candles)
Apply this indicator
This ensures only the filtered candles from the script are visible.
Adjust for your local timezone
This script uses a hardcoded timezone: "Asia/Kolkata"
If you are in a different timezone, change it to your own (e.g. "America/New_York", "Europe/London", etc.) in all instances of:
time(timeframe.period, "Asia/Kolkata")
timestamp("Asia/Kolkata", ...)
Use Cases:
Opening range behavior on specific weekdays/months
Detecting market anomalies during exact windows
Building visual logs of preferred trade hours