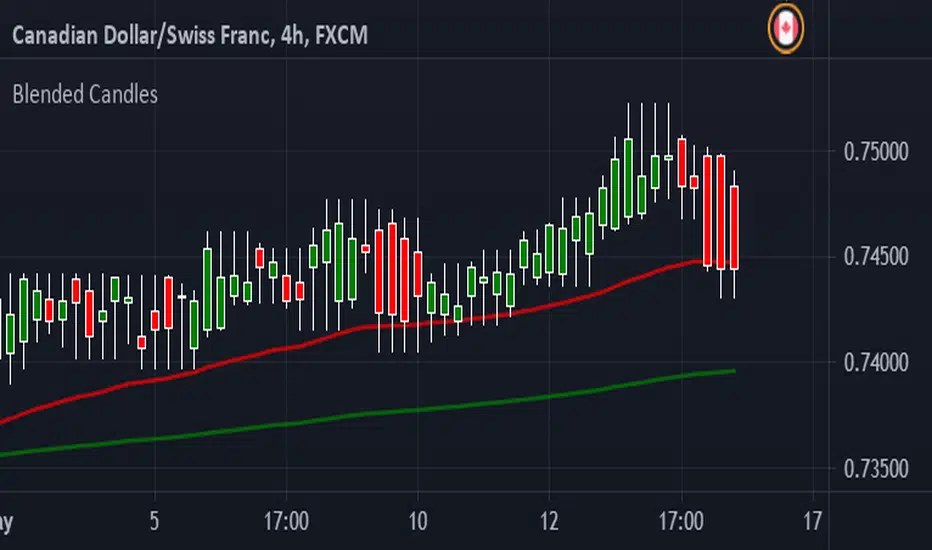
Blended CandlesHave been looking at YouTube and found a few videos about Blended Candles. Couldn't find a script here so I decided to script something myself.
I have also added a couple of EMA's, saves having to put them in individually.
You can Look Back as far back as you want but I find that each time frame looks better if you keep it to multiple of the next
IE : 1 min - look back 5 (5 min) up to 15 (15 min)
5 min - look back 3 (15 min) up to 12 (1 hour)
15 min - look back 4 (1 hour) up to 16 ( 4 hours)
1 hour - look back 4 (4 hours) up to 8 (8 hours - 1 trading session)
4 hour - look back 2 (8 hours - 1 trading session) up to 6 ( 1 Day)
1 day - look back 5 ( 1 week)
Shooting stars, Hammers and Doji's are very easy to recognize
Long wicks on top - Bearish
Long wick on bottom - Bullish
Support and Resistance is easier to spot as well :-)
Hope this helps someone - defiantly helps me time entries
Comments welcome and Happy Trading
"candle" için komut dosyalarını ara
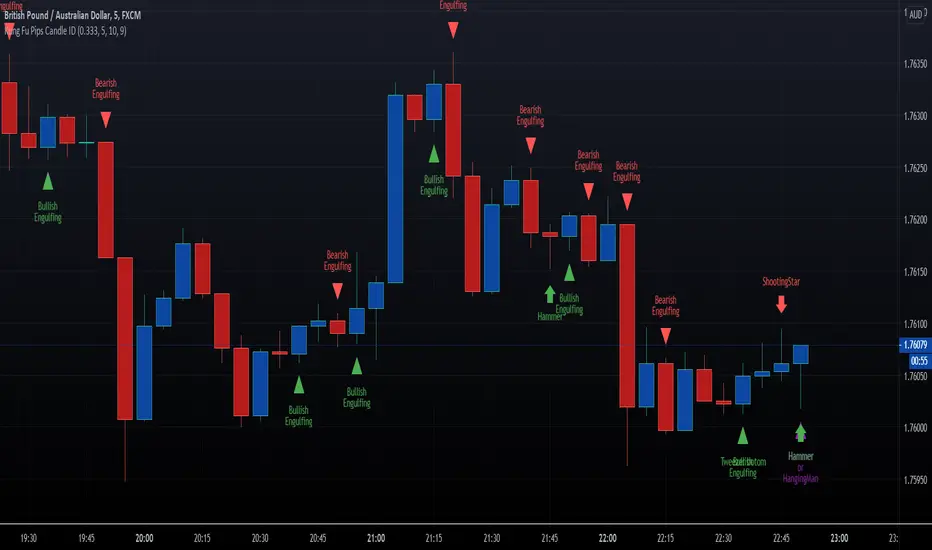
HFX Kung Fu Pips Candlestick Identifier by Trader ZThis indicator identifies the following candle stick patterns:
Bullish and Bearish Engulfing
Hammer/Hanging Man, Shooting Star
Tweezer Tops and Bottoms
Doji Star
Doji Gravestone
Made for trading Forex Binary Options but can be used in any market. When the candlestick pattern emerges the script will label the pattern. A helpful visual tool for your analysis.
Enjoy!!!!
BB and Engulfing Candle PatternHey this is my second script. This a combination of Bollinger Bands and detection of Engulfing Candles. This study also filters out and displays Bull, Bear, and False signals, using the long term 200 EMA Trend. Let me know what you think!

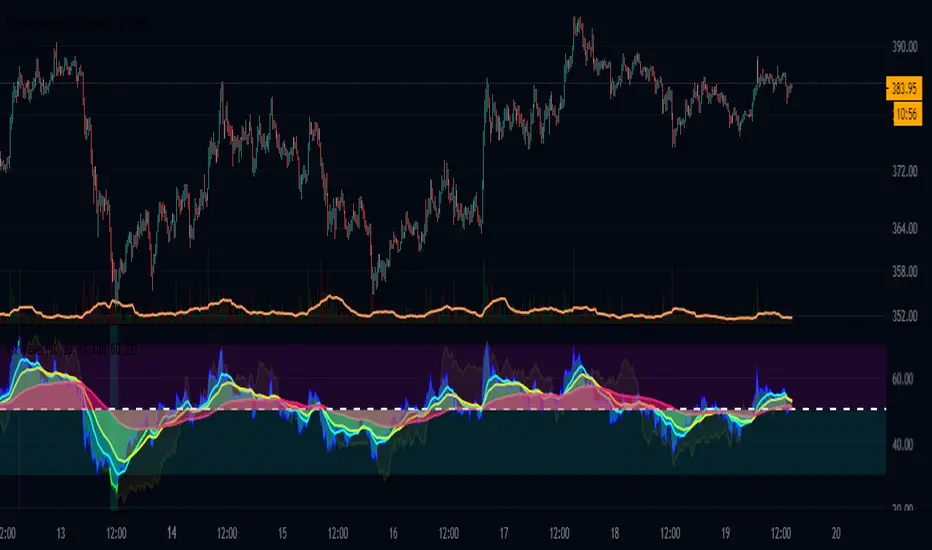
Finnie's RSI Waves + Volume Colored CandlesUsing RSI and 4 exponential moving averages, I created this indicator so that you can spot inconsistencies between price action and RSI. There's a lot of misunderstanding surrounding RSI, most people think if something's 'oversold' buying is a guarantee win. This definitely isn't the case as there's many more variable to consider. In addition, with this indicator, candles are colored based off of volume.
INDICATOR USE:
1. Determine trend
2. Find relative support/resistance
3. Once at support/resistance look for entries:
-RSI crossing over the Short EMA (CYAN) is your fist buy/sell signal
-Short EMA (CYAN) crossing Medium EMA (YELLOW) is your second
-RSI crossing Long EMA (PINK) is your final and most accurate signal
4. Once you've made an entry, you can follow step 3. in reverse for an exit
COLORED CANDLES:
Dark Green candles = Strong Bullish volume
Light Green = Average Bullish volume
Dark Red candles = Strong Bearish volume
Light Red = Average Bearish Volume
Orange/blue means volume is conflicting with price action
I plan to add a Colored DOT over each crossover as a visual buy/sell signal if anyone has any suggestions that'd be great :)
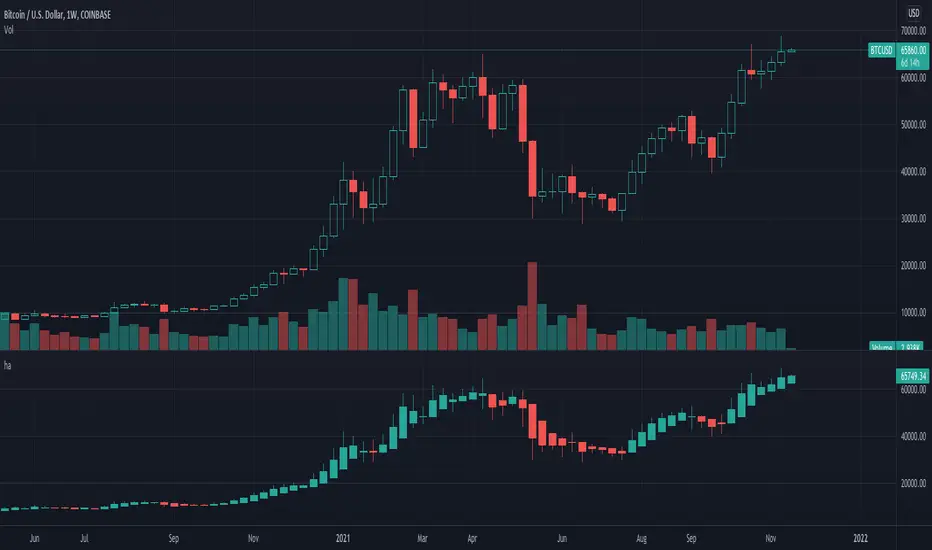
Heiken-Ashi CandlesSimple script to view Heiken-Ashi candles below a normal candles chart.
Could also be useful for using HA calcs in strategy scripts on normal candles chart for proper backtesting.
I adapted this to v4 from original v2 script by @samtsui. If you like please remember to give him a Thumbs Up for his original version! ->
Engulfing Candles DetectorHello traders
Credit to HPotter for that script
I took his script and added alerts to it. 2 lines lol
But anyway, useful to detect reversals by coloring bullish/bearish engulfing candles :)
Enjoy
David

Combined MTF Camarilla Pivots (HA + Candles)This is a fairly basic (but hopefully useful) indicator that combines three time-frames of Camarilla pivots into one.
Default time-frames are:
Weekly
Monthly
Yearly
Time-frames can be modified as you wish, they are just set to these as I generally only trade higher intervals (just note that formatting labels will not change - but you can update these as needed).
The Camarilla pivots displayed are as follows:
R3, R4, R5, R6
Pivot line (Middle/Base)
S3, S4, S5, S6
R1/S1 & R2/S2 are excluded to make way for R5/S5 & R6/S6 - as these are more useful for the majority of traders. The formula for levels 5/6 are always up for debate, as no official formula has ever been released. I've used what I consider a mid, or consensus calculation.
By default all historical pivot levels are displayed, as there can be some benefit to mapping these forward once the relevant period has ended. If people find it's too cluttered I'll look into having an option to display the current period only.
Unfortunately, TradingView doesn't allow labels on plots (seems like such a basic feature to be missing, but there you go), so you'll have to learn the colours/linewidths.
Oh, and there's a checkbox to enable pivots to be calculated on Heiken-Ashi prices/candles rather than default prices/candles. This heavily modifies the location of the Camarilla Pivots, but I've found that in certain situations you can get some great results.
Let me know your thoughts/comments/suggestions.
Cheers
DD

Average Candle LengthThis script is designed to show you the average candle size in pips (wick to wick) for however many bars you choose (20 is default).
The idea is that if the average candle size for the last 20 bars is, let's say 25, you would probably not want to set your stop loss less than 25 because it is more likely to get hit.
if you find this script helpful, tips and donations are always appreciated (venmo @rick-munoz) :)

IO_CWL IndexCandlestick body and Wick Length Index (CWL)
Shows a trend chart of candle body length and wick length.
Green -> Candle body
Red -> Candle Wick
-- Invsto

Small candle indicatorI've modified the original script by WiscoDish to show candles as green while they are smaller than the median of the past 10 candles. Once they become larger than the median they'll change to gray.
I've also added a horizontal median line so you can see how close the candle is to the median candle size.
This is very useful if you're stalking a trade and waiting for the candle to close small.

VWAP CandlesTried making candles of Vwap instead of normal price to see if something interesting would happen. Something interesting did happen as you can see.
Looks best in 4h because of reasons unknown. In lower timeframes it looks kinda stupid (moves the same as nrmal vwap). Day or above it looks the same as normal candles.
Gaps seem to work as s/r? or at least I've seen price react to those levels.
I've also seen a vwap reversal candles show (like dojis, pin bar), while price candles look normal. Could potentially give you a reversal warning?
You can also plot indicators like bollinger bands etc on the vwap candles. Just press the little plus.

EMA Market Regime & Real-Time Candle Projection System📌 EMA Market Regime & Real-Time Candle Projection System
EMA Market Regime & Parabolic Projection is a real-time market structure system designed to anticipate candle behavior before it fully forms, by dynamically projecting price levels based on trend strength, acceleration, and market expansion.
Unlike traditional indicators that react after the candle closes, this system continuously adapts to live price data to provide early insight into bullish, bearish, parabolic, and exhaustion phases.
🔍 Core Concept
The system operates on four key dimensions:
Market Structure
Uses a fast and a slow EMA to determine the dominant market regime (bullish or bearish).
Directional Momentum
Measures EMA slope to confirm directional commitment.
Acceleration & Parabolic Detection
Identifies true parabolic movements through acceleration analysis, filtering out weak or range-bound price action.
Expansion Validation
Confirms that movements are supported by genuine market expansion, reducing false signals.
By combining these elements, the indicator projects a dynamic price level in real time, effectively drawing a forward-looking guide that adapts as each candle evolves.
🧠 Real-Time Candle Projection
The projected line represents a dynamic equilibrium level derived from EMA structure and acceleration.
This allows traders to:
Anticipate continuation vs exhaustion
Visualize momentum shifts before candle close
Read potential candle direction and strength in real time
The projection is non-repainting and updates tick-by-tick during the candle’s formation.
🎯 Market Regime Classification
The system automatically classifies the market into distinct states:
Bullish Trend – Positive structure with controlled momentum
Bearish Trend – Negative structure with controlled momentum
Parabolic Expansion – Accelerated trend with strong continuation potential
Parabolic Exhaustion – Loss of acceleration signaling potential reversal or pullback
Neutral / Range – Low momentum and low expansion (no-trade zone)
Each state is visually encoded using subtle, professional coloring, ensuring price candles always remain the primary focus.
🛡️ Professional-Grade Filters
Anti-range and anti-fake breakout filtering
Cooldown logic to prevent repetitive signals
Slope normalization relative to volatility
Designed to remain readable on M1–M5 scalping and higher timeframes
⚙️ Designed For
Scalping & Intraday Trading
Real-time decision-making
Trend continuation & exhaustion timing
Prop-firm and professional trading environments
This system is intended as a market structure and timing tool, not a signal spam indicator.
⚠️ Disclaimer
This indicator does not predict the future and does not provide guaranteed results. It is designed to assist discretionary traders by improving real-time market reading and execution timing.

Momentum Squeeze Candle [Darwinian]# Momentum Squeeze Candle
Professional squeeze detection indicator with Wyckoff accumulation/distribution analysis and multi-method momentum signals.
## Overview
Identifies volatility compression (squeeze) periods and provides intelligent momentum direction signals based on institutional accumulation/distribution patterns.
## Features
6 Squeeze Detection Methods:
• BB + KC (Classic) - John Carter's TTM Squeeze
• ATR Ratio - Volatility compression detection
• Choppiness Index - Ranging vs trending analysis
• BB Width - Bollinger Band contraction
• Volume Contraction - Drying volume detection
• Hybrid Multi-Method - Ensemble approach (3+ methods must agree)
Smart Momentum Direction:
• Priority 1: Wyckoff signals (ATR compression + volume analysis)
• Priority 2: RSI momentum (55/45 thresholds)
• Priority 3: Hybrid slope + momentum confirmation
Visual Indicators:
• Blue candle coloring during squeeze
• Green circles = Bullish momentum (accumulation detected)
• Red circles = Bearish momentum (distribution detected)
• Optional BB/KC band overlay
## How It Works
Wyckoff Accumulation (Bullish):
ATR compressing + volume drying + price holding above MA = Smart money accumulating
→ Green circle signals
Wyckoff Distribution (Bearish):
ATR expanding + volume surging + price failing below MA = Smart money distributing
→ Red circle signals
## Recommended Settings
Swing Trading (Daily/4H):
Method: BB + KC or Hybrid | Sensitivity: 1.2-1.5
Day Trading (15m-1H):
Method: ATR Ratio or BB Width | Sensitivity: 0.8-1.0
Scalping (1m-5m):
Method: Volume Contraction | Sensitivity: 0.7-0.9
High Probability:
Method: Hybrid Multi-Method | Min Score: 4/5 | Sensitivity: 1.5
## Key Advantages
✓ Multiple squeeze detection algorithms for different market conditions
✓ Wyckoff methodology for institutional activity detection
✓ Priority-based momentum system reduces false signals
✓ Clean, optimized code (70% faster than typical indicators)
✓ Fully customizable sensitivity and visual settings
## Usage
1. Choose squeeze detection method based on your trading style
2. Watch for blue candles (squeeze active)
3. Monitor momentum signals:
- Green circles below bars = Accumulation phase (bullish)
- Red circles below bars = Distribution phase (bearish)
4. Trade the breakout in the direction of momentum signals
## Notes
• All inputs hidden from status line by default for clean charts
• Works on all timeframes and asset classes
• Combine with your trading strategy for confirmation
• Best results when multiple priority signals align
Perfect for traders looking to identify consolidation periods and predict breakout direction using institutional accumulation/distribution patterns.

HTF Candles with PVSRA Volume Coloring (PCS Series)This indicator displays higher timeframe (HTF) candles using a PVSRA-inspired color model that blends price and volume strength, allowing traders to visualize higher-timeframe activity directly on lower-timeframe charts without switching screens.
OVERVIEW
This script visualizes higher-timeframe (HTF) candles directly on lower-timeframe charts using a custom PVSRA (Price, Volume & Support/Resistance Analysis) color model.
Unlike standard HTF indicators, it aggregates real-time OHLC and volume data bar-by-bar and dynamically draws synthetic HTF candles that update as the higher-timeframe bar evolves.
This allows traders to interpret momentum, trend continuation, and volume pressure from broader market structures without switching charts.
INTEGRATION LOGIC
This script merges higher-timeframe candle projection with PVSRA volume analysis to provide a single, multi-timeframe momentum view.
The HTF structure reveals directional context, while PVSRA coloring exposes the underlying strength of buying and selling pressure.
By combining both, traders can see when a higher-timeframe candle is building with strong or weak volume, enabling more informed intraday decisions than either tool could offer alone.
HOW IT WORKS
Aggregates price data : Groups lower-timeframe bars to calculate higher-timeframe Open, High, Low, Close, and total Volume.
Applies PVSRA logic : Compares each HTF candle’s volume to the average of the last 10 bars:
• >200% of average = strong activity
• >150% of average = moderate activity
• ≤150% = normal activity
Assigns colors :
• Green/Blue = bullish high-volume
• Red/Fuchsia = bearish high-volume
• White/Gray = neutral or low-volume moves
Draws dynamic outlines : Outlines update live while the current HTF candle is forming.
Supports symbol override : Calculations can use another instrument for correlation analysis.
This multi-timeframe aggregation avoids repainting issues in request.security() and ensures accurate real-time HTF representation.
FEATURES
Dual HTF Display : Visualize two higher timeframes simultaneously (e.g., 4H and 1D).
Dynamic PVSRA Coloring : Volume-weighted candle colors reveal bullish or bearish dominance.
Customizable Layout : Adjust candle width, spacing, offset, and color schemes.
Candle Outlines : Highlight the forming HTF candle to monitor developing structure.
Symbol Override : Display HTF candles from another instrument for cross-analysis.
SETTINGS
HTF 1 & HTF 2 : enable/disable, set timeframes, choose label colors, show/hide outlines.
Number of Candles : choose how many HTF candles to plot (1–10).
Offset Position : distance to the right of the current price where HTF candles begin.
Spacing & Width : adjust separation and scaling of candle groups.
Show Wicks/Borders : toggle wick and border visibility.
PVSRA Colors : enable or disable volume-based coloring.
Symbol Override : use a secondary ticker for HTF data if desired.
USAGE TIPS
Set the indicator’s visual order to “Bring to front.”
Always choose HTFs higher than your active chart timeframe.
Use PVSRA colors to identify strong momentum and potential reversals.
Adjust candle spacing and width for your chart layout.
Outlines are not shown on chart timeframes below 5 minutes.
TRADING STRATEGY
Strategy Overview : Combine HTF structure and PVSRA volume signals to
• Identify zones of high institutional activity and potential reversals.
• Wait for confirmation through consolidation or a pullback to key levels.
• Trade in alignment with dominant higher-timeframe structure rather than chasing volatility.
Setup :
• Chart timeframe: lower (5m, 15m, 1H)
• HTF 1: 4H or 1D
• HTF 2: 1D or 1W
• PVSRA Colors: enabled
• Outlines: enabled
Entry Concept :
High-volume candles (green or red) often indicate market-maker activity , such zones often reflect liquidity absorption by larger players and are not necessarily ideal entry points.
Wait for the next consolidation or pullback toward a support or resistance level before acting.
Bullish scenario :
• After a high-volume or rejection candle near a low, price consolidates and forms a higher low.
• Enter long only when structure confirms strength above support.
Bearish scenario :
• After a high-volume or rejection candle near a top, price consolidates and forms a lower high.
• Enter short once resistance holds and momentum weakens.
Exit Guidelines :
• Exit when next HTF candle shifts in color or momentum fades.
• Exit if price structure breaks opposite to your trade direction.
• Always use stop-loss and take-profit levels.
Additional Tips :
• Never enter directly on strong green/red high-volume candles, these are usually areas of institutional absorption.
• Wait for market structure confirmation and volume normalization.
• Combine with RSI, moving averages, or support/resistance for timing.
• Avoid trading when HTF candles are mixed or low-volume (unclear bias).
• Outlines hidden below 5m charts.
Risk Management :
• Use stop-loss and take-profit on all positions.
• Limit risk to 1–2% per trade.
• Adjust position size for volatility.
FINAL NOTES
This script helps traders synchronize lower-timeframe execution with higher-timeframe momentum and volume dynamics.
Test it on demo before live use, and adjust settings to fit your trading style.
DISCLAIMER
This script is for educational purposes only and does not constitute financial advice.
SUPPORT & UPDATES
Future improvements may include alert conditions and additional visualization modes. Feedback is welcome in the comments section.
CREDITS & LICENSE
Created by @seoco — open source for community learning.
Licensed under Mozilla Public License 2.0 .

Session Open Candle MarkerThe "Session Open Candle Marker" is a Pine Script indicator designed for forex and futures traders using Smart Money Concepts (SMC) and RP Profits-inspired strategies. It marks the 15-minute opening range candles for the Asia, London, and NY sessions, where institutional "big players" often gather liquidity. Each session’s range is drawn as a rectangle with a customizable midpoint line, ideal for spotting breakouts, retests, and liquidity sweeps.
Features
Session Open Ranges: Plots rectangles for the 15m open candles of Asia (03:00 EEST), London (10:00 EEST), and NY (15:00 EEST), corresponding to 01:00, 08:00, and 13:00 GMT+1.
Customizable Visualization:
Toggle each session (Asia, London, NY) on/off.
Independent high/low label toggles for each session.
Adjustable rectangle color, midpoint line color, style (solid/dashed/dotted), and width.
Customizable rectangle duration (default: 96 bars, ~24 hours on 15m).
Timezone Flexibility: Default times are set for EEST (UTC+3). Adjust session inputs for your chart’s timezone (e.g., GMT+1: Asia 01:00, London 08:00, NY 13:00; UTC: Asia 00:00, London 07:00, NY 12:00).
Clean Design: Rectangles and labels update dynamically, with proper cleanup to avoid clutter.
Usage:
Setup: Add to a 15m chart (e.g., EURUSD, ES1!). Check your chart’s timezone (Chart Settings > Symbol > Timezone) and adjust session times if needed.
Settings:
Toggle sessions and labels to focus on desired ranges (e.g., London and NY for high volatility).
Customize colors, midpoint line style/width, and rectangle duration.
Trading:
Breakouts/Retests: Trade breakouts above/below the rectangle high/low, with retests back to the range or midpoint (aligned with RP Profits scalping).
Liquidity Sweeps: Watch for price sweeping session highs/lows, reversing for entries (SMC concept).

Highlight Candle with Half Volume on CloseIt checks volume of the current candle and compares with previous candle,
if volume is low then it highlights the candle. Lines are configurable.
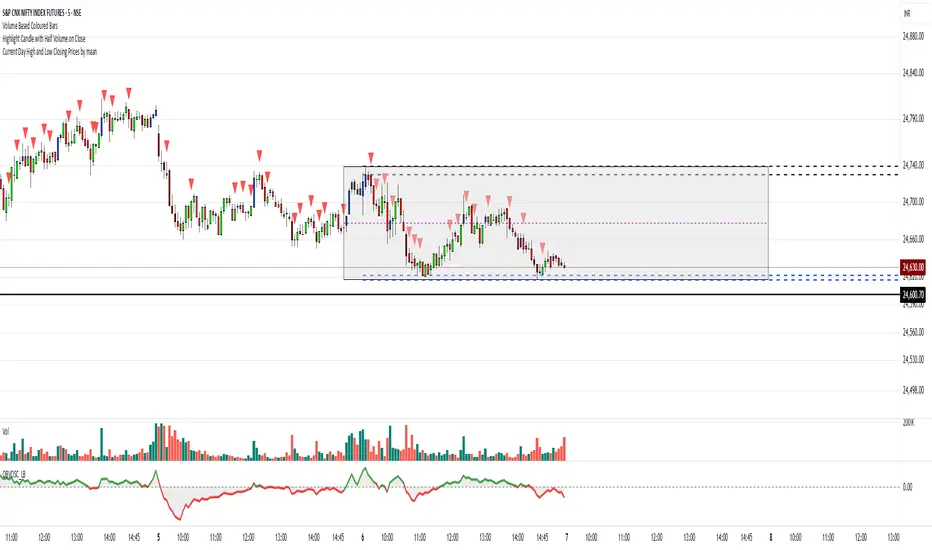
First Candle High Low LevelsDescription
The "First Candle High Low Levels" Pine Script indicator is designed to highlight the high and low levels of the first candle of the day on your TradingView chart. It works across different timeframes and specifically handles the Indian stock market trading hours (9:15 AM to 3:30 PM IST). The script draws a box from the start to the end of the trading session, visually marking the price range defined by the first candle of the day. Traders can customize the box's border color, fill color, and line width.
Features
Customizable Timeframe: Users can select the desired timeframe for the first candle (e.g., 5-minute, 15-minute, etc.).
Custom Box Appearance: Options to adjust the border color, fill color, and line width of the drawn box.
Auto Reset for Each New Day: The high and low of the first candle are reset daily to mark the start of the next trading day.
Accurate Market Session Handling: The box is drawn from the start of the first candle to the end of the trading session (3:30 PM IST).
Usage
Adding to Chart: Apply the script by copying it into the Pine Script editor in TradingView. Once added, the script will automatically draw a box representing the high and low of the first candle of the day.
Select Timeframe: You can adjust the First Candle Timeframe input to define which timeframe candle will be used for marking the high and low. For example, if you choose a 5-minute timeframe, the high and low of the first 5-minute candle will be used.
Customization:
Adjust the Border Color and Box Fill Color through the input settings to match your chart's style.
Modify the Box Line Width to make the box lines more or less prominent.

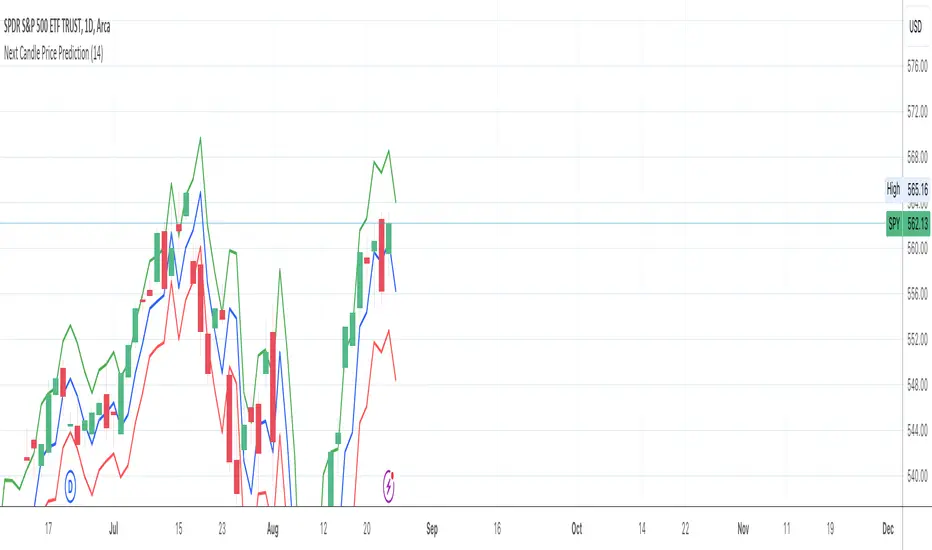
Next Candle Price Prediction FAJnext candle price prediction
Previous Day Data:
prevHigh, prevLow, and prevClose are calculated to capture the high, low, and close of the previous day. This is used to understand the previous day's price range and sentiment.
ATR Calculation:
The Average True Range (ATR) is a measure of volatility. We use it to estimate how much the price might move up or down from the previous close.
Predicted High and Low:
Using the previous close plus and minus the ATR value gives a range where the price might reach.
Predicted Target Price:
The script calculates a simple midpoint of the previous day's range to predict the target price for the next candle. This midpoint serves as a basic prediction, assuming price might oscillate within the previous day's range.
Plotting:
The script plots the predicted high, low, and target price as well as the previous day's high, low, and close for context.
First 12 Candles High/Low BreakoutThis indicator identifies potential breakout opportunities based on the high and low points formed within the first 12 candles after the market opens on a 5-minute timeframe. It provides visual cues and labels to help traders make informed decisions.
Features:
Market Open High/Low: Marks the highest and lowest price of the first 12 candles following the market open with horizontal lines for reference.
Breakout Signals: Identifies potential buy or sell signals based on the first 5-minute candle closing above the open high or below the open low.
Target and Stop-Loss: Plots horizontal lines for target prices (100 points by default, adjustable) and stop-loss levels (100 points by default, adjustable) based on the entry price.
Visual Cues: Uses green triangles (up) for buy signals and red triangles (down) for sell signals.
Informative Labels: Displays labels with "Buy" or "Sell" text, target price, and stop-loss price next to the entry signals (optional).
Customization:
You can adjust the target and stop-loss point values using the provided inputs.
How to Use:
Add the script to your TradingView chart.
The indicator will automatically plot the open high, open low, potential entry signals, target levels, and stop-loss levels based on the first 12 candles after the market opens.
Use the signals and price levels in conjunction with your own trading strategy to make informed decisions.

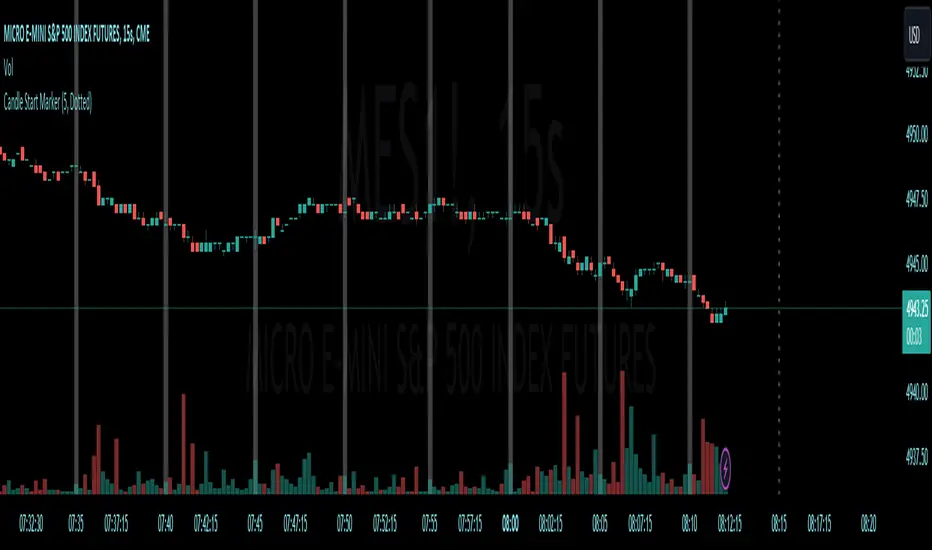
[CS] HTF Candle Start MarkerHello Traders!
I was using this script personally and thought it may be helpful to others that trade much lower timeframes. This script is particularly useful for traders who monitor price movements across multiple timeframes or need to synchronize their strategies with the start of new candle open.
Features:
User-Selectable Timeframe : Users can select the desired timeframe for the candle start marker, ranging from 1 to 60 minutes.
Start-of-Period Visualization : The indicator works by highlighting the background color at the start of each new candle for the chosen timeframe. This visual cue is particularly helpful for identifying the commencement of new trading intervals on lower timeframe charts.
Intelligent Timeframe Adaptation : A unique feature of this indicator is its ability to disable the marking on charts where the selected timeframe is equal to or higher than the chart's current timeframe. This ensures that the marker is only active when it provides meaningful information, avoiding redundancy on higher timeframe charts.
Usage:
This indicator is ideal for low time frame traders and those employing multi-timeframe analysis. It helps in quickly identifying the start of new time intervals. For example I trade the 15 second timeframe and mark the start of every 5 minute candle.
Rolling Heikin Ashi Candles█ OVERVIEW
This indicator displays a Rolling Heikin Ashi Candles for a given timeframe Multiplier. Contrary to Heikin Ashi Candles Charts, if the timeframe Multiplier is "5", this indicator plots Heikin Ashi Candles OHLC of the last 5 Candles.
█ WHAT IS THE NEED FOR IT
Let's see if we want to use a Higher timeframe OHLC Data using security function or resolution options. The indicator repaints until the higher timeframe Heikin Ashi Candles closes, leading to a repainting strategy or indicator using higher-timeframe data. So we can use Rolling Heikin Ashi Candles in these cases.
█ USES
To Pull out higher timeframe Heikin Ashi Candles OHLC Data to build a non-repainting strategy or indicator.
█ WHY I AM BUILDING THIS SIMPLE INDICATOR
There is no doubt higher timeframe analysis is a critical study to mastering the markets.
I found a necessity for an indicator that analyses multiple higher timeframes and gives us a cumulative or average trend direction. I already built the indicator; I will release it soon. The Indicator I am building is wholly based on my understanding and perspective of Market Structure. Please use this indicator idea to remove the repainting issue when you make an indicator that utilises higher timeframe data.
I am using this in my upcoming indicators. Felt to share before head.
Stay Tuned...
If you have any recommendations or alternative ideas, then please drop a comment under the script ;)

Hollow, Filled Candle IndicatorColored, Filled and Hollow candles similar to Stock charts candles.
Hollow Black - close > prior close and close > open
Filled Black - close > prior close and close < open
Hollow Red - close < prior close and close > open
Filled Red - close < prior close and close < open

HTF Candle [Custom Time Period] by JustUncleL [SOMMI 1.0 edit]This is a custom High Time Frame indicator, originally created by JustUncleL. 💚
I have edited the Pine Script to allow a custom Time Period input. 💛
In the original version, you could only select from a few time periods as your High Time Frame. 💙
In this version you can put any time frame as your reference. 🧡
Example: 6-hour HTF or 2-Day HTF
SOMMI'S SPECIAL NOTES:
-This indicator works with Heikin-Ashi candles.
-Please change your candles to Heikin-Ashi and apply the indicator.
-Advised to disable "Body Wicks"
-Advised to also refresh your page a few times a day as it doesn't update properly due to limitations of TradingView / Pinescript currently.
💙💛💚🧡
