Pin Candle DetectionPin candles are a variation of hammer candles that are useful in technical analysis . In particular, when combined with volume profile studies, they can be a powerful set up for long entries or other decision making.
For example, when looking at volume profiles, a long entry would be a fair value area (i.e. 40%) below the close of a pin candle. When combined with a support level , the set up is stronger.
While most scripts look for hammer candles, pin candles are somewhat different in that the length of the wick is significant.
This script and its parameters was built for ES futures 15 min chart in mind.
This script is unique in that it allows for the below parameters to be adjusted to suit other instruments and timeframes:
1. Fib level: Candle must close within a certain retracement level). My preference is 0.55. Some traders like 0.5, while others prefer 0.33
2. Wick length: Pin candles differ from pure hammers in that the length of the wick must be significant. My preference is 7 points on ES (as in $ and not ticks)
Add this script to your alerts to no longer miss these set ups.
"candle" için komut dosyalarını ara

Colorize Large Candles// I have written a Pine Script to re-paint large candles in a different Color.
// You can set the value that you want to use to define what is 'Large', and the script will re-paint any candle whose size is equal to or greater than your value.
// The number can be an integer (8) or a decimal (7.5).
// You can enable the size measurement to be done in one of two ways: 1) either on the Body (Open-to-Close); 2) or on the Wicks (High-to-Low) of the candle.
// The color of the re-painted candle can be set independently for Up and for Down candles. You can also set any Opacity that you want for these candles.
// I usually set the limit for the Visibility to the Second- and Minute-timeframes, as the Script produces too many Colorized Bars when using the Hour- or Day- timeframes.

Physics CandlesPhysics Candles embed volume and motion physics directly onto price candles or market internals according to the cyclic pattern of financial securities. The indicator works on both real-time “ticks” and historical data using statistical modeling to highlight when these values, like volume or momentum, is unusual or relatively high for some periodic window in time. Each candle is made out of one or more sub-candles that each contain their own information of motion, which converts to the color and transparency, or brightness, of that particular candle segment. The segments extend throughout the entire candle, both body and wicks, and Thick Wicks can be implemented to see the color coding better. This candle segmentation allows you to see if all the volume or energy is evenly distributed throughout the candle or highly contained in one small portion of it, and how intense these values are compared to similar time periods without going to lower time frames. Candle segmentation can also change a trader’s perspective on how valuable the information is. A “low” volume candle, for instance, could signify high value short-term stopping volume if the volume is all concentrated in one segment.
The Candles are flexible. The physics information embedded on the candles need not be from the same price security or market internal as the chart when using the Physics Source option, and multiple Candles can be overlayed together. You could embed stock price Candles with market volume, market price Candles with stock momentum, market structure with internal acceleration, stock price with stock force, etc. My particular use case is scalping the SPX futures market (ES), whose price action is also dictated by the volume action in the associated cash market, or SPY, as well as a host of other securities. Physics allows you to embed the ES volume on the SPY price action, or the SPY volume on the ES price action, or you can combine them both by overlaying two Candle streams and increasing the Number of Overlays option to two. That option decreases the transparency levels of your coloring scheme so that overlaying multiple Candles converges toward the same visual color intensity as if you had one. The Candle and Physics Sources allows for both Symbols and Spreads to visualize Candle physics from a single ticker or some mathematical transformation of tickers.
Due to certain TradingView programming restrictions, each Candle can only be made out of a maximum of 8 candle segments, or an “8-bit” resolution. Since limits are just an opportunity to go beyond, the user has the option to stack multiple Candle indicators together to further increase the candle resolution. If you don’t want to see the Candles for some particular period of the day, you can hide them, or use the hiding feature to have multiple Candles calibrated to show multiple parts of the trading day. Securities tend to have low volume after hours with sharp spikes at the open or close. Multiple Candles can be used for multiple parts of the trading day to accommodate these different cycles in volume.
The Candles do not need be associated with the nominal security listed on the TV chart. The Candle Source allows the user to look at AAPL Candles, for instance, while on a TSLA or SPY chart, each with their respective volume actions integrated into the candles, for instance, to allow the user to see multiple security price and volume correlation on a single chart.
The physics information currently embeddable on Candles are volume or time, velocity, momentum, acceleration, force, and kinetic energy. In order to apply equations of motion containing a mass variable to financial securities, some analogous value for mass must be assumed. Traders often regard volume or time as inextricable variables to a securities price that can indicate the direction and strength of a move. Since mass is the inextricable variable to calculating the momentum, force, or kinetic energy of motion, the user has the option to assume either time or volume is analogous to mass. Volume may be a better option for mass as it is not strictly dependent on the speed of a security, whereas time is.
Data transformations and outlier statistics are used to color code the intensity of the physics for each candle segment relative to past periodic behavior. A million shares during pre-market or a million shares during noontime may be more intense signals than a typical million shares traded at the open, and should have more intense color signals. To account for a specific cyclic behavior in the market, the user can specify the Window and Cycle Time Frames. The Window Time Frame splits up a Cycle into windows, samples and aggregates the statistics for each window, then compares the current physics values against past values in the same window. Intraday traders may benefit from using a Daily Cycle with a 30-minute Window Time Frame and 1-minute Sample Time Frame. These settings sample and compare the physics of 1-minute candles within the current 30-minute window to the same 30-minute window statistics for all past trading days, up until the data limit imposed by TradingView, or until the Data Collection Start Date specified in the settings. Longer-term traders may benefit from using a Monthly Cycle with a Weekly Time Frame, or a Yearly Cycle with a Quarterly Time Frame.
Multiple statistics and data transformation methods are available to convey relative intensity in different ways for different trading signals. Physics Candles allows for both Normal and Log-Normal assumptions in the physics distribution. The data can then be transformed by Linear, Logarithmic, Z-Score, or Power-Law scoring, where scoring simply assigns an intensity to the relative physics value of each candle segment based on some mathematical transformation. Z-scoring often renders adequate detection by scoring the segment value, such as volume or momentum, according to the mean and standard deviation of the data set in each window of the cycle. Logarithmic or power-law transformation with a gamma below 1 decreases the disparity between intensities so more less-important signals will show up, whereas the power-law transformation with gamma values above 1 increases the disparity between intensities, so less more-important signals will show up. These scores are then converted to color and transparency between the Min Score and the Max Score Cutoffs. The Auto-Normalization feature can automatically pick these cutoffs specific to each window based on the mean and standard deviation of the data set, or the user can manually set them. Physics was developed with novices in mind so that most users could calibrate their own settings by plotting the candle segment distributions directly on the chart and fiddling with the settings to see how different cutoffs capture different portions of the distribution and affect the relative color intensities differently. Security distributions are often skewed with fat-tails, known as kurtosis, where high-volume segments for example, have a higher-probabilities than expected for a normal distribution. These distribution are really log-normal, so that taking the logarithm leads to a standard bell-shaped distribution. Taking the Z-score of the Log-Normal distribution could make the most statistical sense, but color sensitivity is a discretionary preference.
Background Philosophy
This indicator was developed to study and trade the physics of motion in financial securities from a visually intuitive perspective. Newton’s laws of motion are loosely applied to financial motion:
“A body remains at rest, or in motion at a constant speed in a straight line, unless acted upon by a force”.
Financial securities remain at rest, or in motion at constant speed up or down, unless acted upon by the force of traders exchanging securities.
“When a body is acted upon by a force, the time rate of change of its momentum equals the force”.
Momentum is the product of mass and velocity, and force is the product of mass and acceleration. Traders render force on the security through the mass of their trading activity and the acceleration of price movement.
“If two bodies exert forces on each other, these forces have the same magnitude but opposite directions.”
Force arises from the interaction of traders, buyers and sellers. One body of motion, traders’ capitalization, exerts an equal and opposite force on another body of motion, the financial security. A securities movement arises at the expense of a buyer or seller’s capitalization.
Volume
The premise of this indicator assumes that volume, v, is an analogous means of measuring physical mass, m. This premise allows the application of the equations of motion to the movement of financial securities. We know from E=mc^2 that mass has energy. Energy can be used to create motion as kinetic energy. Taking a simple hypothetical example, the interaction of one short seller looking to cover lower and one buyer looking to sell higher exchange shares in a security at an agreed upon price to create volume or mass, and therefore, potential energy. Eventually the short seller will actively cover and buy the security from the previous buyer, moving the security higher, or the buyer will actively sell to the short seller, moving the security lower. The potential energy inherent in the initial consolidation or trading activity between buy and seller is now converted to kinetic energy on the subsequent trading activity that moves the securities price. The more potential energy that is created in the consolidation, the more kinetic energy there is to move price. This is why point and figure traders are said to give price targets based on the level of volatility or size of a consolidation range, or why Gann traders square price and time, as time is roughly proportional to mass and trading activity. The build-up of potential energy between short sellers and buyers in GME or TSLA led to their explosive moves beyond their standard fundamental valuations.
Position
Position, p, is simply the price or value of a financial security or market internal.
Time
Time, t, is another means of measuring mass to discover price behavior beyond the time snapshots that simple candle charts provide. We know from E=mc^2 that time is related to rest mass and energy given the speed of light, c, where time ≈ distance * sqrt(mass/E). This relation can also be derived from F=ma. The more mass there is, the longer it takes to compute the physics of a system. The more energy there is, the shorter it takes to compute the physics of a system. Similarly, more time is required to build a “resting” low-volatility trading consolidation with more mass. More energy added to that trading consolidation by competing buyers and sellers decreases the time it takes to build that same mass. Time is also related to price through velocity.
Velocity = (p(t1) – p(t0)) / p(t0)
Velocity, v, is the relative percent change of a securities price, p, over a period of time, t0 to t1. The period of time is between subsequent candles, and since time is constant between candles within the same timeframe, it is not used to calculate velocity or acceleration. Price moves faster with higher velocity, and slower with slower velocity, over the same fixed period of time. The product of velocity and mass gives momentum.
Momentum = mv
This indicator uses physics definition of momentum, not finance’s. In finance, momentum is defined as the amount of change in a securities price, either relative or absolute. This is definition is unfortunate, pun intended, since a one dollar move in a security from a thousand shares traded between a few traders has the exact same “momentum” as a one dollar move from millions of shares traded between hundreds of traders with everything else equal. If momentum is related to the energy of the move, momentum should consider both the level of activity in a price move, and the amount of that price move. If we equate mass to volume to account for the level of trading activity and use physics definition of momentum as the product of mass and velocity, this revised definition now gives a thousand-times more momentum to a one-dollar price move that has a thousand-times more volume behind it. If you want to use finance’s volume-less definition of momentum, use velocity in this indicator.
Acceleration = v(t1) – v(t0)
Acceleration, a, is the difference between velocities over some period of time, t0 to t1. Positive acceleration is necessary to increase a securities speed in the positive direction, while negative acceleration is necessary to decrease it. Acceleration is related to force by mass.
Force = ma
Force is required to change the speed of a securities valuation. Price movements with considerable force have considerably more impact on future direction. A change in direction requires force.
Kinetic Energy = 0.5mv^2
Kinetic energy is the energy that a financial security gains from the change in its velocity by force. The built-up of potential energy in trading consolidations can be converted to kinetic energy on a breakout from the consolidation.
Cycle Theory and Relativity
Just as the physics of motion is relative to a point of reference, so too should the physics of financial securities be relative to a point of reference. An object moving at a 100 mph towards another object moving in the same direction at 100 mph will not appear to be moving relative to each other, nor will they collide, but from an outsider observer, the objects are going 100 mph and will collide with significant impact if they run into a stationary object relative to the observer. Similarly, trading with a hundred thousand shares at the open when the average volume is a couple million may have a much smaller impact on the price compared to trading a hundred thousand shares pre-market when the average volume is ten thousand shares. The point of reference used in this indicator is the average statistics collected for a given Window Time Frame for every Cycle Time Frame. The physics values are normalized relative to these statistics.
Examples
The main chart of this publication shows the Force Candles for the SPY. An intense force candle is observed pre-market that implicates the directional overtone of the day. The assumption that direction should follow force arises from physical observation. If a large object is accelerating intensely in a particular direction, it may be fair to assume that the object continues its direction for the time being unless acted upon by another force.
The second example shows a similar Force Candle for the SPY that counters the assumption made in the first example and emphasizes the importance of both motion and context. While it’s fair to assume that a heavy highly accelerating object should continue its course, if that object runs into an obstacle, say a brick wall, it’s course may deviate. This example shows SPY running into the 50% retracement wall from the low of Mar 2020, a significant support level noted in literature. The example also conveys Gann’s idea of “lost motion”, where the SPY penetrated the 50% price but did not break through it. A brick wall is not one atom thick and price support is not one tick thick. An object can penetrate only one layer of a wall and not go through it.
The third example shows how Volume Candles can be used to identify scalping opportunities on the SPY and conveys why price behavior is as important as motion and context. It doesn’t take a brick wall to impede direction if you know that the person driving the car tends to forget to feed the cats before they leave. In the chart below, the SPY breaks down to a confluence of the 5-day SMA, 20-day SMA, and an important daily trendline (not shown) after the bullish bounce from the 50% retracement days earlier. High volume candles on the SMA signify stopping volume that reverse price direction. The character of the day changes. Bulls become more aggressive than bears with higher volume on upswings and resistance, whiles bears take on a defensive position with lower volume on downswings and support. High volume stopping candles are seen after rallies, and can tell you when to take profit, get out of a position, or go short. The character change can indicate that its relatively safe to re-enter bullish positions on many major supports, especially given the overarching bullish theme from the large reaction off the 50% retracement level.
The last example emphasizes the importance of relativity. The Volume Candles in the chart below are brightest pre-market even though the open has much higher volume since the pre-market activity is much higher compared to past pre-markets than the open is compared to past opens. Pre-market behavior is a good indicator for the character of the day. These bullish Volume Candles are some of the brightest seen since the bounce off the 50% retracement and indicates that bulls are making a relatively greater attempt to bring the SPY higher at the start of the day.
Infrequently Asked Questions
Where do I start?
The default settings are what I use to scalp the SPY throughout most of the extended trading day, on a one-minute chart using SPY volume. I also overlay another Candle set containing ES future volume on the SPY price structure by setting the Physics Source to ES1! and the Number of Overlays setting to 2 for each Candle stream in order to account for pre- and post-market trading activity better. Since the closing volume is exponential-like up until the end of the regular trading day, adding additional Candle streams with a tighter Window Time Frame (e.g., 2-5 minute) in the last 15 minutes of trading can be beneficial. The Hide feature can allow you to set certain intraday timeframes to hide one Candle set in order to show another Candle set during that time.
How crazy can you get with this indicator?
I hope you can answer this question better. One interesting use case is embedding the velocity of market volume onto an internal market structure. The PCTABOVEVWAP.US is a market statistic that indicates the percent of securities above their VWAP among US stocks and is helpful for determining short term trends in the US market. When securities are rising above their VWAP, the average long is up on the day and a rising PCTABOVEVWAP.US can be viewed as more bullish. When securities are falling below their VWAP, the average short is up on the day and a falling PCTABOVEVWAP.US can be viewed as more bearish. (UPVOL.US - DNVOL.US) / TVOL.US is a “spread” symbol, in TV parlance, that indicates the decimal percent difference between advancing volume and declining volume in the US market, showing the relative flow of volume between stocks that are up on the day, and stocks that are down on the day. Setting PCTABOVEVWAP.US in the Candle Source, (UPVOL.US - DNVOL.US) / TVOL.US in the Physics Source, and selecting the Physics to Velocity will embed the relative velocity of the spread symbol onto the PCTABOVEVWAP.US candles. This can be helpful in seeing short term trends in the US market that have an increasing amount of volume behind them compared to other trends. The chart below shows Volume Candles (top) and these Spread Candles (bottom). The first top at 9:30 and second top at 10:30, the high of the day, break down when the spread candles light up, showing a high velocity volume transfer from up stocks to down stocks.
How do I plot the indicator distribution and why should I even care?
The distribution is visually helpful in seeing how different normalization settings effect the distribution of candle segments. It is also helpful in seeing what physics intensities you want to ignore or show by segmenting part of the distribution within the Min and Max Cutoff values. The intensity of color is proportional to the physics value between the Min and Max Cutoff values, which correspond to the Min and Max Colors in your color scheme. Any physics value outside these Min and Max Cutoffs will be the same as the Min and Max Colors.
Select the Print Windows feature to show the window numbers according to the Cycle Time Frame and Window Time Frame settings. The window numbers are labeled at the start of each window and are candle width in size, so you may need to zoom into to see them. Selecting the Plot Window feature and input the window number of interest to shows the distribution of physics values for that particular window along with some statistics.
A log-normal volume distribution of segmented z-scores is shown below for 30-minute opening of the SPY. The Min and Max Cutoff at the top of the graph contain the part of the distribution whose intensities will be linearly color-coded between the Min and Max Colors of the color scheme. The part of the distribution below the Min Cutoff will be treated as lowest quality signals and set to the Min Color, while the few segments above the Max Cutoff will be treated as the highest quality signals and set to the Max Color.
What do I do if I don’t see anything?
Troubleshooting issues with this indicator can involve checking for error messages shown near the indicator name on the chart or using the Data Validation section to evaluate the statistics and normalization cutoffs. For example, if the Plot Window number is set to a window number that doesn’t exist, an error message will tell you and you won’t see any candles. You can use the Print Windows option to show windows that do exist for you current settings. The auto-normalization cutoff values may be inappropriate for your particular use case and literally cut the candles out of the chart. Try changing the chart time frame to see if they are appropriate for your cycle, sample and window time frames. If you get a “Timeframe passed to the request.security_lower_tf() function must be lower than the timeframe of the main chart” error, this means that the chart timeframe should be increased above the sample time frame. If you get a “Symbol resolve error”, ensure that you have correct symbol or spread in the Candle or Physics Source.
How do I see a relative physics values without cycles?
Set the Window Time Frame to be equal to the Cycle Time Frame. This will aggregate all the statistics into one bucket and show the physics values, such as volume, relative to all the past volumes that TV will allow.
How do I see candles without segmentation?
Segmentation can be very helpful in one context or annoying in another. Segmentation can be removed by setting the candle resolution value to 1.
Notes
I have yet to find a trading platform that consistently provides accurate real-time volume and pricing information, lacking adequate end-user data validation or quality control. I can provide plenty of examples of real-time volume counts or prices provided by TradingView and other platforms that were significantly off from what they should have been when comparing against the exchanges own data, and later retroactively corrected or not corrected at all. Since no indicator can work accurately with inaccurate data, please use at your own discretion.
The first version is a beta version. Debugging and validating code in Pine script is difficult without proper unit testing. Please report any bugs with enough information to reproduce them and indicate why they are important. I also encourage you to export the data from TradingView and verify the calculations for your particular use case.
The indicator works on real-time updates that occur at a higher frequency than the candle time frame, which TV incorrectly refers to as ticks. They use this terminology inaccurately as updates are really aggregated tick data that can take place at different prices and may not accurately reflect the real tick price action. Consequently, this inaccuracy also impacts the real-time segmentation accuracy to some degree. TV does not provide a means of retaining “tick” information, so the higher granularity of information seen real-time will be lost on a disconnect.
TV does not provide time and sales information. The volume and price information collected using the Sample Time Frame is intraday, which provides only part of the picture. Intraday volume is generally 50 to 80% of the end of day volume. Consequently, the daily+ OHLC prices are intraday, and may differ significantly from exchanged settled OHLC prices.
The Cycle and Window Time Frames refer to calendar days and time, not trading days or time. For example, the first window week of a monthly cycle is the first seven days of the month, not the first Monday through Friday of trading for the month.
Chart Time Frames that are higher than the Window Time Frames average the normalized physics for price action that occurred within a given Candle segment. It does not average price action that did not occur.
One of the main performance bottleneck in TradingView’s Pine Script is client-side drawing and plotting. The performance of this indicator can be increased by lowering the resolution (the number of sub-candles this indicator plots), getting a faster computer, or increasing the performance of your computer like plugging your laptop in and eliminating unnecessary processes.
The statistical integrity of this indicator relies on the number of samples collected per sample window in a given cycle. Higher sample counts can be obtained by increasing the chart time frame or upgrading the TradingView plan for a higher bar count. While increasing the chart time frame doesn’t increase the visual number of bars plotted on the chart, it does increase the number of bars that can be pulled at a lower time frame, up to 100,000.
Due to a limitation in Pine Scripts request_lower_tf() function, using a spread symbol will only work for regular trading hours, not extended trading hours.
Ideally, velocity or momentum should be calculated between candle closes. To eliminate the need to deal with price gaps that would lead to an incorrect statistical distributions, momentum is calculated between candle open and closes as a percent change of the price or value, which should not be an issue for most liquid securities.

Candle Stick UpdateHeikin ashi chart so powerful that you can understand trend direction easily. But sometimes, this type of chart doesn't update properly and make no sense on real time. So I made this script. You can now change candle stick style default to heikin ashi (default / modified version) on the real time default chart without switching heikin ashi chart. Enjoy traders!!! And don't forget to press the like button :)

Candlestick toolkit (Candle Over Candle)Candlestick pattern toolkit focused on reading price action via candle anatomy, body dynamics, and a specific 2-bar continuation/reversal pattern.
This indicator highlights:
Long upper and lower wicks (“topping” and “bottoming” tails) that can signal exhaustion or potential reversal.
Large bullish bodies relative to Average True Range (ATR), showing strong momentum.
Sequences of large green candles.
Runs of green candles with strictly increasing or strictly decreasing body size, to visualize acceleration vs. momentum fade.
A two-candle pattern:
“Candle over Candle” (CoC) for long bias: two bullish bars where the first has a small upper wick and the second has a modest lower wick (a brief dip then push higher).
Optional mirrored “Candle under Candle” (CuC) for short bias.
The script labels:
Topping/Bottoming tails (TT/BT).
Large-green sequences and increasing/decreasing bodies (N×LG, ↑B, ↓B).
CoC/CuC pattern bars as “PRE” and the actual breakout bars as “GO”.
While a pattern is “live,” a reference line marks the trigger level (pattern high for longs, pattern low for shorts).
Inputs let you:
Tune wick and body percentage thresholds for tail detection.
Adjust ATR length and the multiplier that defines a “large” body.
Change how many candles are required for large-green sequences and body size trends.
Configure the two-candle pattern (maximum wick sizes, whether a small dip is required, confirmation within N bars).
Choose confirmation mode: close-through the trigger or intrabar wick break.
Enable or disable the short (CuC) side.
Control visual features (tail markers, sequence markers, pattern labels, and background shading on pattern bars).
Typical use:
Apply on intraday or swing timeframes.
Use tails and body behavior to read strength/weakness and potential exhaustion.
Treat CoC/CuC PRE labels as pattern formation, and GO labels as potential trade triggers above/below the pattern.
Combine with your own filters (trend, volume, higher-timeframe levels) rather than using it as a standalone signal generator.

Strong Body Close Candle (90%)This indicator highlights Strong Body Close Candles, which are single bars where the real body makes up the vast majority of the total range and the close is positioned very close to the candle’s extreme. By default, the script looks for candles where the body is at least 90% of the full high-low range, and the close falls within the top 10% (for bullish) or bottom 10% (for bearish). These settings ensure that only very strong, conviction-driven candles are marked. The script plots labels above or below qualifying bars, colors the candle accordingly, and provides alert conditions so you can be notified in real time when such a candle forms.
Both percentages are fully adjustable so you can fine-tune the strictness of the definition. For example, if you change the body threshold to 85% and the close-to-extreme threshold to 15%, the script will highlight candles where the body makes up at least 85% of the total range and the close is within 15% of the high or low. This adjustment allows for a slightly looser definition, catching more frequent signals while still maintaining strength criteria. Built-in alerts let you choose between bullish and bearish signals separately (or both), ensuring you won’t miss setups even when you’re away from the chart.
This tool is flexible across timeframes and instruments. On lower timeframes, signals may appear more frequently, highlighting intraday momentum bursts, while on higher timeframes such as daily or weekly charts, these signals often represent periods of strong directional conviction. Traders can combine this indicator with additional filters such as trend direction, volume confirmation, VWAP, or moving averages to improve reliability and fit it into their broader strategy. Because the body and close thresholds are user-defined, you have control over whether the indicator is tuned to rare but powerful candles (stricter settings) or more frequent signals (looser settings).
The indicator is designed to be non-repainting since it only evaluates candles after they close. It can be used purely visually with chart labels and bar coloring or as part of an automated workflow with TradingView alerts. Alerts are triggered on bar close whenever a bullish or bearish strong body close candle is detected, allowing you to integrate them into your trading process via pop-ups, emails, mobile notifications, or webhooks. Whether you’re looking for sharp reversals, momentum continuation signals, or simply want to filter out weaker candles, this tool provides a clear and adjustable framework for identifying high-conviction bars.

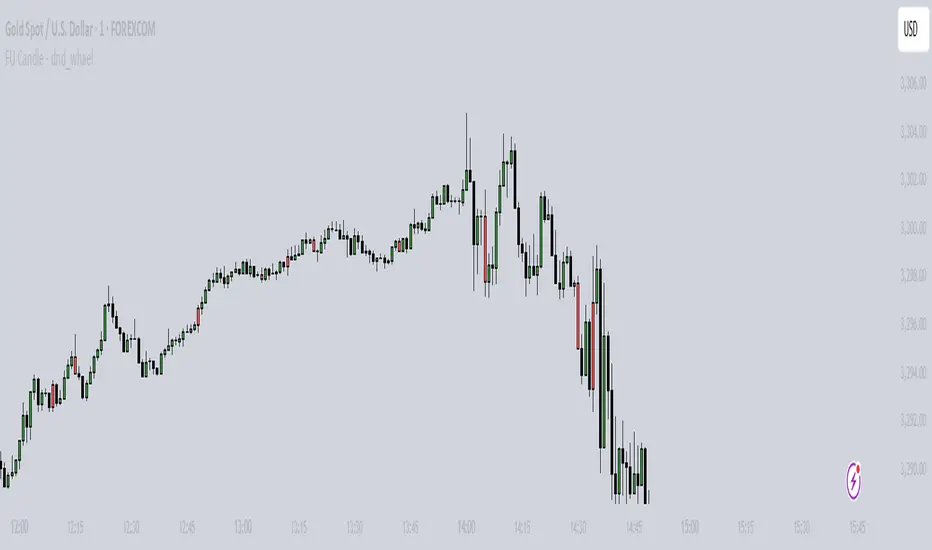
FU Candle - dnd_whael What the FU Candle Indicator does:
First we need to understand what FU candles are. There's bullish and bearish FU candles.
Bullish FU candles are candles that have a long wick that takes out the previous candles low, then turns around and closes above the high of the previous candle.
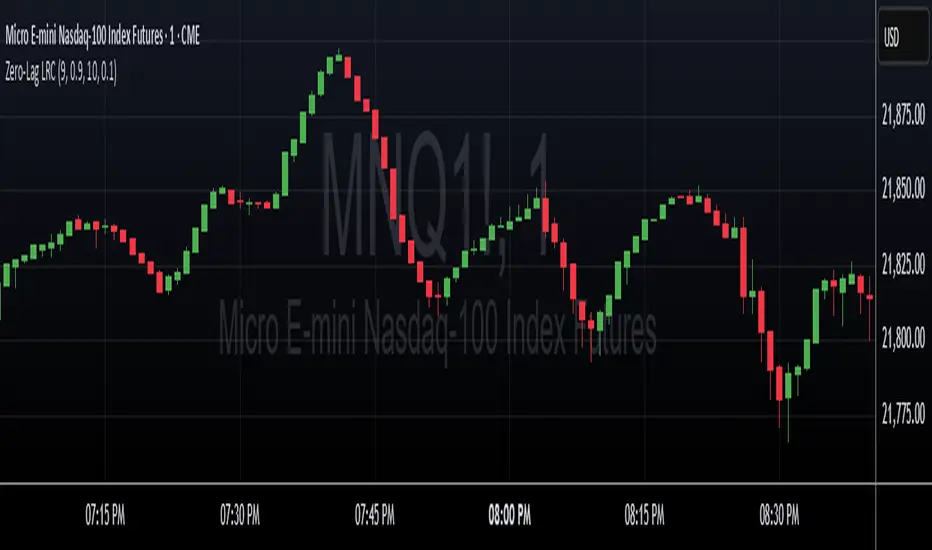
Zero-Lag Linear Regression Candles🚀 Zero-Lag Linear Regression Candles
📊 What It Does
The Zero-Lag Linear Regression Candles change traditional candlestick analysis by creating smoothed, predictive candles that eliminate the lag inherent in standard linear regression methods. Instead of waiting for price confirmation, this indicator anticipates market movements using advanced mathematical modeling.
🎯 Key Features
Tri-Layer Super Responsive System
Layer 1: Weighted Linear Regression with exponential decay weighting
Layer 2: Zero-lag correction algorithm that projects future price direction
Layer 3: Adaptive intelligence that adjusts to current market volatility and momentum
Smart Market Adaptation
Automatically adjusts sensitivity based on market volatility (ATR)
Responds to momentum changes in real-time
Filters out market noise while preserving important signals
Customizable
Regression Length: Fine-tune responsiveness (2-50 periods)
Weight Decay Factor: Control how much emphasis to place on recent vs. historical data
Zero-Lag Periods: Adjust the aggressiveness of lag elimination
Adaptive Factor: Set market adaptation strength
🛠️ Usage Instructions
1. Add to Chart: Apply the indicator to any timeframe
2. Configure Settings: Adjust regression length and sensitivity to match your trading style
3. Interpret Signals:
- Green Candles: Bullish linear regression trend
- Red Candles: Bearish linear regression trend
Created by B3AR_Trades
Candle Breakout Oscillator [LuxAlgo]The Candle Breakout Oscillator tool allows traders to identify the strength and weakness of the three main market states: bullish, bearish, and choppy.
Know who controls the market at any given moment with an oscillator display with values ranging from 0 to 100 for the three main plots and upper and lower thresholds of 80 and 20 by default.
🔶 USAGE
The Candle Breakout Oscillator represents the three main market states, with values ranging from 0 to 100. By default, the upper and lower thresholds are set at 80 and 20, and when a value exceeds these thresholds, a colored area is displayed for the trader's convenience.
This tool is based on pure price action breakouts. In this context, we understand a breakout as a close above the last candle's high or low, which is representative of market strength. All other close positions in relation to the last candle's limits are considered weakness.
So, when the bullish plot (in green) is at the top of the oscillator (values above 80), it means that the bullish breakouts (close below the last candle low) are at their maximum value over the calculation window, indicating an uptrend. The same interpretation can be made for the bearish plot (in red), indicating a downtrend when high.
On the other hand, weakness is indicated when values are below the lower threshold (20), indicating that breakouts are at their minimum over the last 100 candles. Below are some examples of the possible main interpretations:
There are three main things to look for in this oscillator:
Value reaches extreme
Value leaves extreme
Bullish/Bearish crossovers
As we can see on the chart, before the first crossover happens the bears come out of strength (top) and the bulls come out of weakness (bottom), then after the crossover the bulls reach strength (top) and the bears weakness (bottom), this process is repeated in reverse for the second crossover.
The other main feature of the oscillator is its ability to identify periods of sideways trends when the sideways values have upper readings above 80, and trending behavior when the sideways values have lower readings below 20. As we just saw in the case of bullish vs. bearish, sideways values signal a change in behavior when reaching or leaving the extremes of the oscillator.
🔶 DETAILS
🔹 Data Smoothing
The tool offers up to 10 different smoothing methods. In the chart above, we can see the raw data (smoothing: None) and the RMA, TEMA, or Hull moving averages.
🔹 Data Weighting
Users can add different weighting methods to the data. As we can see in the image above, users can choose between None, Volume, or Price (as in Price Delta for each breakout).
🔶 SETTINGS
Window: Execution window, 100 candles by default
🔹 Data
Smoothing Method: Choose between none or ten moving averages
Smoothing Length: Length for the moving average
Weighting Method: Choose between None, Volume, or Price
🔹 Thresholds
Top: 80 by default
Bottom: 20 by default

Vacuum Candles [XrayAlgo]The Vacuum Candles indicator helps traders identify inefficient price movements—where the price moves significantly but lacks sufficient volume to support it. These inefficiencies may signal weak trends, potential reversals, or false breakouts/breakdowns.
Inefficient candles are visually marked with a darker / black body to indicate when the price movement is disproportionate to the volume.
1. Spotting Potential Reversals
When the indicator marks an inefficient candle, it signals that the price movement may be unsustainable.
In an uptrend: A inefficient bullish candle suggests that the uptrend is losing momentum, potentially leading to a downward reversal.
In a downtrend: A inefficient bearish candle signals that the downtrend may be weakening, with a potential bullish reversal.
2. Identifying Breakout and Breakdown Failures
This indicator is useful for recognizing false breakouts or false breakdowns.
If price breaks resistance but the candle is inefficient, the breakout may be weak and could fail quickly.
If price breaks support with an inefficient bearish candle, the breakdown could be a false signal, with price reverting back above support.
3. Recognizing Weak Trends
Inefficient candles help you spot when a trend is losing strength and could soon reverse or consolidate.
In an uptrend: A series of dark body bullish candles suggests that the uptrend may be weakening, signaling a potential correction or trend reversal.
In a downtrend: A series of dark body bearish candles suggests that the selling pressure is weakening, indicating a potential bullish reversal.
4. Fine-Tuning Entries and Exits
Inefficient candles offer an opportunity to fine-tune your entries and exits based on weak price moves.
Entering a trade: An inefficient candle near key support or resistance can indicate a reversal, making it a good entry point for a counter-trend position.
Exiting a trade: If you're already in a trend, and an inefficient candle appears, it suggests the trend is losing strength, indicating it may be a good time to exit before a potential reversal.
5. Fine-Tuning with Inputs
The Vacuum Candles indicator includes two key inputs:
Length: The number of candles used to calculate the average price movement and volume. A longer length (e.g., 20-30) smooths out the inefficiencies, while a shorter length (e.g., 10-15) makes the indicator more sensitive to recent price moves.
Multiplier: Controls the threshold for what is considered an inefficient candle:
A higher Multiplier (e.g., 1.5–3) filters out smaller inefficiencies and focuses on large discrepancies.
A lower Multiplier (e.g., 0.1–0.9) captures even smaller inefficiencies in highly efficient markets.

No wick candlesОпис коду:
Цей скрипт для Pine Script v6 аналізує свічки на графіку і визначає свічки, що не мають фітіля знизу або згори. Він позначає їх відповідними маркерами та змінює колір свічок на помаранчевий для покращення видимості. Цей індикатор допомагає трейдерам ідентифікувати важливі зони на графіку, де свічки мають специфічні риси (без фітіля), і використовується для виявлення потенційних точок для подальших торгівельних рішень.
Що робить цей індикатор:
Зелені свічки без фітіля знизу: Це свічки, у яких ціна відкриття дорівнює мінімуму свічки. Вони позначаються зеленими стрілками під свічкою.
Червоні свічки без фітіля згори: Це свічки, у яких ціна відкриття дорівнює максимуму свічки. Вони позначаються червоними стрілками над свічкою.
Зміна кольору свічок: Свічки, що відповідають умовам (без фітіля знизу або згори), змінюють свій колір на помаранчевий для підвищення видимості та чіткого виділення важливих зон.
Як використовувати:
Цей індикатор допомагає вам ідентифікувати зони, де ціна не має фітіля знизу (для зелених свічок) або згори (для червоних свічок). Ці свічки можуть бути важливими для трейдерів, оскільки вони часто сигналізують про сильні рівні підтримки або опору, де ймовірно відбудеться ретест.
Важливо:
Чекати ретест зони: Після появи таких свічок (особливо у зонах підтримки або опору) можна очікувати, що ці рівні будуть перевірені ще раз. Якщо ціни повертаються до цих зон, це може бути сигналом для входу в ринок.
Торгівля на ретестах: Якщо ціна після першого відскоку знову наближається до цієї зони (де була свічка без фітіля), можна очікувати відскок або продовження тренду, що створює можливість для вхідної позиції.
_______________________________
Description:
This Pine Script v6 indicator analyzes the candles on the chart and identifies those that have no lower or upper wicks. It marks these candles with appropriate markers and changes the candle colors to orange for better visibility. This indicator helps traders identify important zones on the chart where candles exhibit specific characteristics (no wicks), which can be used to spot potential trading opportunities.
What this indicator does:
Green candles with no lower wick: These are candles where the opening price equals the low of the candle. They are marked with a green arrow below the candle.
Red candles with no upper wick: These are candles where the opening price equals the high of the candle. They are marked with a red arrow above the candle.
Candle color change: Candles that meet the conditions (no lower or upper wick) change their color to orange for better visibility and to clearly highlight important zones.
How to use:
This indicator helps you identify zones where prices have no lower wick (for green candles) or no upper wick (for red candles). These candles may be important for traders, as they often indicate strong support or resistance levels where a retest is likely to occur.
Important:
Wait for a zone retest: After these candles appear (especially at support or resistance zones), you can expect these levels to be tested again. If the price returns to these zones, it could signal an opportunity to enter the market.
Trading on retests: If the price approaches the zone (where a wickless candle occurred) again, it may indicate a bounce or trend continuation, which provides a potential entry point.

Multi-Timeframe Candle Analysis [by Oberlunar]Multi-Timeframe Candle Analysis
Scalping often requires traders to make rapid decisions based on price movements within a short timeframe. However, a key challenge is understanding the broader trend and market pressure across higher timeframes without cluttering the workspace with multiple charts. This can lead to a lack of clarity, missed opportunities, or poorly timed trades.
The Multi-Timeframe Candle Analysis script addresses this challenge by providing a consolidated view of essential information across multiple timeframes in a single interface. This script calculates and displays the volatility, strength, and type (bullish or bearish) of candles for up to six customizable timeframes. With this data presented in a neat table, traders can quickly assess market conditions without the need to open multiple charts.
How It Works
The script analyzes six user-defined timeframes, ranging from intraday intervals (e.g., 15 or 30 minutes) to daily or even weekly periods. It extracts critical data such as open, high, low, and close prices for the current and previous candles. From this data, the script computes:
Candle Type: Identifies whether the candle is bullish or bearish based on the close relative to the open.
Volatility Percentage Change: Measures the percentage change in candle volatility compared to the previous candle.
Candle Strength: Evaluates the strength of price movements within the candle relative to the previous one.
These metrics are organized into an easy-to-read table that updates dynamically as the market moves. The table color codes bullish and bearish candles for quick visual recognition, enhancing decision-making speed.

Buy&Sell Hollow CandlesThe Hollow Candles Script is a type of candlestick analysis script designed to highlight the following:
Purpose of the Script: This script provides the user with buy and sell signals based on candlesticks that show an upward or downward reversal.
Mechanism of the Script: When a hollow (unfilled) red candle appears, it signals a potential entry, provided that this candle is at a low point, following a series of red candles with higher volume than previous days. Similarly, it gives a sell signal when a green candle appears at a peak with high sell volume surpassing that of prior days. However, the appearance of these candles alone should not prompt an immediate buy or sell; you should wait for a confirming candle to validate the signal.
Sideways Movement Caution: If these signals appear during a sideways or flat trend, it is not advisable to proceed with buying or selling.
Chart Insights: The chart demonstrates certain buy and sell operations along with some non-ideal signals where decision-making should be based on fundamental analytical experience.

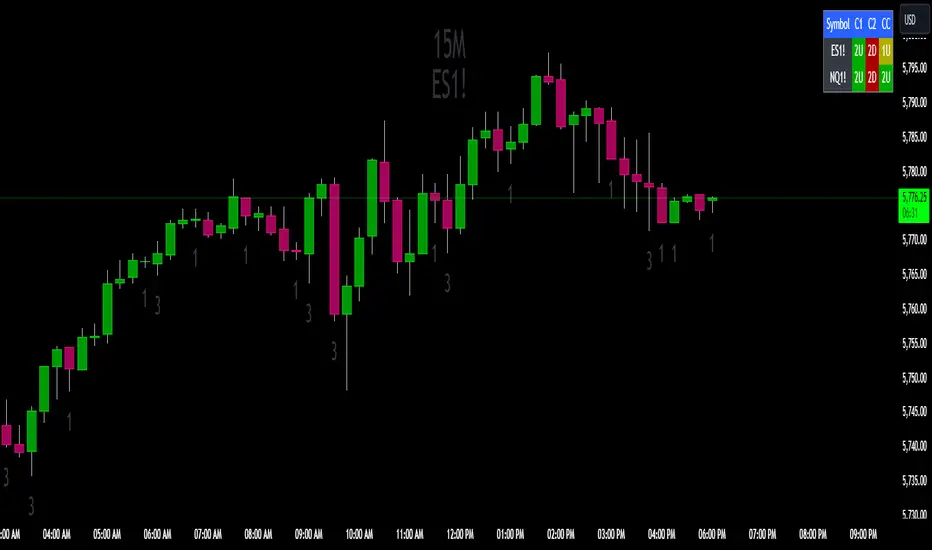
The Strat Candle State Table (Two Symbols)The Strat Candle State Table (Two Symbols) – Multi-Timeframe Analysis
This advanced indicator is designed for traders who follow The Strat methodology, providing a quick, clear, and actionable view of candle states across two selected symbols and a chosen timeframe. It allows you to seamlessly integrate multi-symbol analysis into your trading, offering real-time insights into price action and market momentum based on **The Strat’s** powerful principles.
What It Does:
For each selected symbol, the indicator retrieves and analyzes the price data for three candles:
- Candle 1 (C1): The third candle from the current one.
- Candle 2 (C2): The candle directly before the current one (previous candle).
- Current Candle (CC): The live candle, which is still forming.
Using this information, it plots the Scenario 1 (Inside Bar), Scenario 2 (Directional), and **Scenario 3 (Outside Bar)** states for each candle, color-coding them to help you quickly assess market conditions and price action.
Strat Candle States:
- Scenario 1 (Inside Bar): The candle stays within the high and low of the previous candle (indicating consolidation or indecision).
- Scenario 2 (Directional)* The candle breaks either the high (2-up) or low (2-down) of the previous candle, indicating potential continuation in that direction.
- Scenario 3 (Outside Bar): The candle breaks both the high and low of the previous candle, signaling increased volatility and a potential reversal.
Customizable Color Scheme:
The default colors follow these settings (but can be changed to your preference):
- 1U (Inside and Up): Yellow (indicating an inside bar that closed higher).
- 1D (Inside and Down): Orange (indicating an inside bar that closed lower).
- 2U (Two Up): Green if the candle closes higher, Red if the candle closes lower (conflict).
- 2D (Two Down): Red if the candle closes lower, Green if the candle closes higher (conflict).
- 3U (Three Up): Lighter Purple.
- 3D (Three Down): Darker Purple/Magenta.
Each state is dynamically updated based on the actual price action and whether the candle closes above or below the open. Conflict candles (like a 2-up closing red or 2-down closing green) are highlighted, making it easier to spot potential reversals or weakness in the trend.
Timeframe Flexibility:
You can overlay this indicator on any chart regardless of the timeframe. The key is to select the timeframe you want the indicator to plot for when setting up. Whether you're working on a 5-minute chart, daily, or even weekly, the indicator will analyze the candles according to the selected timeframe, giving you the versatility to adapt it to various trading strategies.
Powerful Use Cases:
1. Multi-Symbol Analysis in Real-Time: The Strat Candle State Table displays the candle states for two symbols at once, helping you track multiple instruments without switching charts. This is extremely useful when monitoring correlated assets like SPY and QQQ, or sector-related pairs such as DIA and IWM
2. Seamless Top-Down View: By analyzing the three most recent candles (C1, C2, and the current candle), the indicator allows you to maintain a top-down perspective on price action, spotting setups early and tracking candle state changes across different symbols and timeframes.
3. Enhanced Conflict Detection: The background shading automatically adjusts for conflict candles, such as a 2-up that closes red or a 2-down that closes green. This provides a quick visual cue to warn you when the current trend may be weakening or reversing.
4. Trade Execution Precision: With this table providing constant feedback on price action and candle state, traders can more easily time their entries and exits, whether they are looking for reversals or continuations
5. Focus on Timeframe Continuity: Use this indicator to stay in alignment with The Strat's Timeframe Continuity, ensuring you are trading in the direction of the most aligned candles, across both symbols. This allows for more precise trade management and higher-probability setups.
6. Customizable to Your Strategy: Change the color coding and candle states to match your personal preferences or trading strategy, making this indicator adaptable to your specific needs.
Most Powerful Use Case – Simultaneous Break Detection:
The Strat Candle State Table shines in setups where simultaneous breaks are being monitored across multiple symbols. For example, if both symbols trigger a 2-up or 3-up at the same time, this confirms that momentum is flowing in the same direction for multiple instruments, giving you stronger trade conviction.
By seeing real-time data for two key symbols, you can ensure that you're catching simultaneous breaks, where multiple instruments are signaling the same move. This can be especially effective in index-based trading, where the strength or weakness of multiple sectors or assets must align for a higher probability of success
Control Candle Range [UkutaLabs]Control Candle Range
█ OVERVIEW
The Control Candle Range is a powerful trading tool that automatically identifies control candles in real time. The versatile ranges drawn by this indicator can be used in a variety of trading strategies because they can be used as ranges as well as areas of support and resistance.
The purpose of this script is to simplify the trading experience of users by automatically identifying and displaying Control Candle Ranges.
█ USAGE
A Control Candle is a candle that is followed by two consecutive inside candles. When this pattern is detected, this indicator will automatically identify it and draw a range in real time. This range will continue to extend as long as candles continue to close within the range of the Control Candle. It is important to note that a Control Candle is still valid if the price action exits its range as long as it closes within its range.
This script also supports higher time frame mapping, allowing you to draw Control Candle Ranges from higher timeframes onto lower timeframe charts. This is a powerful feature that allows users to see multiple timeframes worth of information at a glance on one single chart.
Each Control Candle Range will also be displayed with a label to allow users to understand at a glance which timeframe the range is being drawn from. These labels can be turned off in the settings.
The user also has the ability to adjust the color of each timeframe’s ranges.
█ SETTINGS
Configuration
• Show Labels: Determines whether or not identifying labels are displayed on ranges.
• Label Size: Determines the size of labels.
• Text Alignment: Determines where labels are drawn on ranges.
• Max Display: Determines the maximum number of ranges that can be drawn from each timeframe.
Current Timeframe
• Display (On/Off): Determines whether or not ranges from the current timeframe will be drawn on the chart.
• Color: Determines the color of ranges drawn from the current timeframe.
5 Minute (Higher Timeframe)
• Display (On/Off): Determines whether or not ranges from the 5 minute timeframe will be drawn on the chart.
• Color: Determines the color of ranges drawn from the 5 minute timeframe.
15 Minute (Higher Timeframe)
• Display (On/Off): Determines whether or not ranges from the 15 minute timeframe will be drawn on the chart.
• Color: Determines the color of ranges drawn from the 15 minute timeframe.
30 Minute (Higher Timeframe)
• Display (On/Off): Determines whether or not ranges from the 30 minute timeframe will be drawn on the chart.
• Color: Determines the color of ranges drawn from the 30 minute timeframe.
60 Minute (Higher Timeframe)
• Display (On/Off): Determines whether or not ranges from the 60 minute timeframe will be drawn on the chart.
• Color: Determines the color of ranges drawn from the 60 minute timeframe.
240 Minute (Higher Timeframe)
• Display (On/Off): Determines whether or not ranges from the 240 minute timeframe will be drawn on the chart.
• Color: Determines the color of ranges drawn from the 240 minute timeframe.
Daily (Higher Timeframe)
• Display (On/Off): Determines whether or not ranges from the daily timeframe will be drawn on the chart.
• Color: Determines the color of ranges drawn from the daily timeframe.

Williams %R OB/OS Candle Coloring### Description for TradingView Publication
**Title:** Williams %R OB/OS Candle Coloring
**Description:**
This Pine Script indicator enhances the visibility of market conditions by changing the color of the candlesticks based on the Williams %R values. It helps traders quickly identify overbought and oversold conditions without the need to display the Williams %R line or any additional bands.
**How It Works:**
- The script calculates the Williams %R value using a specified lookback period (default is 14 days).
- It then compares the Williams %R value against predefined overbought and oversold levels.
- **Overbought Condition:** When the Williams %R value is greater than the upper band level (-20 by default), the candlestick color changes to blue.
- **Oversold Condition:** When the Williams %R value is less than the lower band level (-80 by default), the candlestick color changes to yellow.
**How to Use:**
1. **Input Parameters:**
- **Length:** The lookback period for calculating Williams %R (default is 14).
- **Upper Band Level:** The threshold for overbought conditions (default is -20).
- **Lower Band Level:** The threshold for oversold conditions (default is -80).
2. **Candlestick Coloring:**
- Blue candles indicate potential overbought conditions.
- Yellow candles indicate potential oversold conditions.
This indicator is designed to provide a visual cue directly on the price chart, making it easier for traders to spot extreme market conditions at a glance.
**Concepts Underlying the Calculation:**
Williams %R, developed by Larry Williams, is a momentum indicator that measures overbought and oversold levels. It compares the current closing price to the highest high and lowest low over a specified period. By using color-coded candles, traders can quickly assess market conditions and make informed decisions without the need to interpret an additional indicator line.
This script is particularly useful for traders who prefer a clean chart but still want to leverage the insights provided by the Williams %R indicator.
---
### ภาษาไทย:
**คำอธิบาย:**
สคริปต์ Pine Script ตัวนี้ช่วยเพิ่มการมองเห็นสภาวะตลาดโดยการเปลี่ยนสีของแท่งเทียนตามค่าของ Williams %R ช่วยให้เทรดเดอร์สามารถระบุสภาวะการซื้อเกินและขายเกินได้อย่างรวดเร็วโดยไม่ต้องแสดงเส้น Williams %R หรือเส้นระดับเพิ่มเติมใดๆ
**วิธีการทำงาน:**
- สคริปต์คำนวณค่าของ Williams %R โดยใช้ช่วงเวลาที่กำหนด (เริ่มต้นที่ 14 วัน)
- จากนั้นเปรียบเทียบค่าของ Williams %R กับระดับการซื้อเกินและขายเกินที่กำหนดไว้
- **สภาวะการซื้อเกิน:** เมื่อค่าของ Williams %R มากกว่าระดับ Upper Band (-20 เริ่มต้น) สีของแท่งเทียนจะเปลี่ยนเป็นสีน้ำเงิน
- **สภาวะการขายเกิน:** เมื่อค่าของ Williams %R น้อยกว่าระดับ Lower Band (-80 เริ่มต้น) สีของแท่งเทียนจะเปลี่ยนเป็นสีเหลือง
**วิธีการใช้งาน:**
1. **ค่าพารามิเตอร์:**
- **Length:** ช่วงเวลาที่ใช้คำนวณ Williams %R (เริ่มต้นที่ 14)
- **Upper Band Level:** ระดับการซื้อเกิน (เริ่มต้นที่ -20)
- **Lower Band Level:** ระดับการขายเกิน (เริ่มต้นที่ -80)
2. **การเปลี่ยนสีแท่งเทียน:**
- แท่งเทียนสีน้ำเงินระบุถึงสภาวะการซื้อเกิน
- แท่งเทียนสีเหลืองระบุถึงสภาวะการขายเกิน
อินดิเคเตอร์นี้ถูกออกแบบมาเพื่อให้สัญญาณภาพตรงบนกราฟราคาช่วยให้เทรดเดอร์สามารถมองเห็นสภาวะตลาดได้อย่างชัดเจนและทำการตัดสินใจได้ง่ายขึ้น
**แนวคิดที่อยู่เบื้องหลังการคำนวณ:**
Williams %R ที่พัฒนาโดย Larry Williams เป็นอินดิเคเตอร์โมเมนตัมที่วัดระดับการซื้อเกินและขายเกิน มันเปรียบเทียบราคาปิดปัจจุบันกับราคาสูงสุดและต่ำสุดในช่วงเวลาที่กำหนด โดยใช้แท่งเทียนที่มีการเปลี่ยนสี เทรดเดอร์สามารถประเมินสภาวะตลาดและทำการตัดสินใจได้อย่างรวดเร็วโดยไม่ต้องตีความเส้นอินดิเคเตอร์เพิ่มเติม
สคริปต์นี้มีประโยชน์โดยเฉพาะสำหรับเทรดเดอร์ที่ต้องการกราฟที่สะอาดแต่ยังต้องการใช้ข้อมูลเชิงลึกจากอินดิเคเตอร์ Williams %R

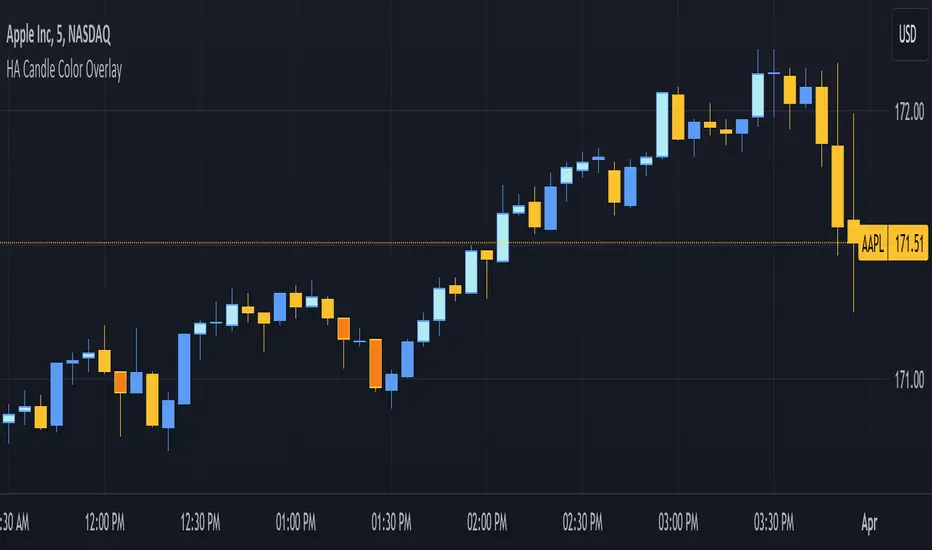
3. [Pufferman] - HA Candle Color OverlayThis indicator is designed for traders who utilize Heikin-Ashi (HA) candles to determine market trend direction and strength but prefer not to clutter their charts with multiple candlestick overlays or constantly switch between chart types. It aims to enhance chart readability by marking significant HA candles directly on the price chart, leveraging the unique characteristics of HA candles to signal trend direction and momentum.
Key Features:
1. Trend Identification through HA Candles: Automatically calculates Heikin-Ashi candles based on standard price data, highlighting significant HA candles that exhibit flat tops or bottoms. These characteristics are indicators of strong trend presence and direction. Highlights are in darker or lighter shade (darker - bearish or light - bullish colors) than the standard candles for easy read.
2. Cleaner Chart Presentation: Offers a streamlined alternative to overlaying HA candles on traditional candlestick charts or toggling between different chart views, keeping the user's interface uncluttered.
3. Selective Highlighting Based on Agreement: Marks traditional candles only when there's a concurrence between the HA candle's trend (bullish or bearish) and the traditional candle's trend. This feature ensures that only the most relevant signals are highlighted for the trader's attention.
Operational Mechanism: The script identifies HA candles with open equal to high (for flat tops) and open equal to low (for flat bottoms), which typically indicate strong trend movements. By marking these on the regular price chart, it provides immediate visual cues about trend strength and direction without needing to switch between HA and traditional candlestick views.
This tool is particularly useful for traders looking for a clean and efficient way to incorporate the insights of Heikin-Ashi candles into their technical analysis without the visual complexity of full HA candlestick overlays.
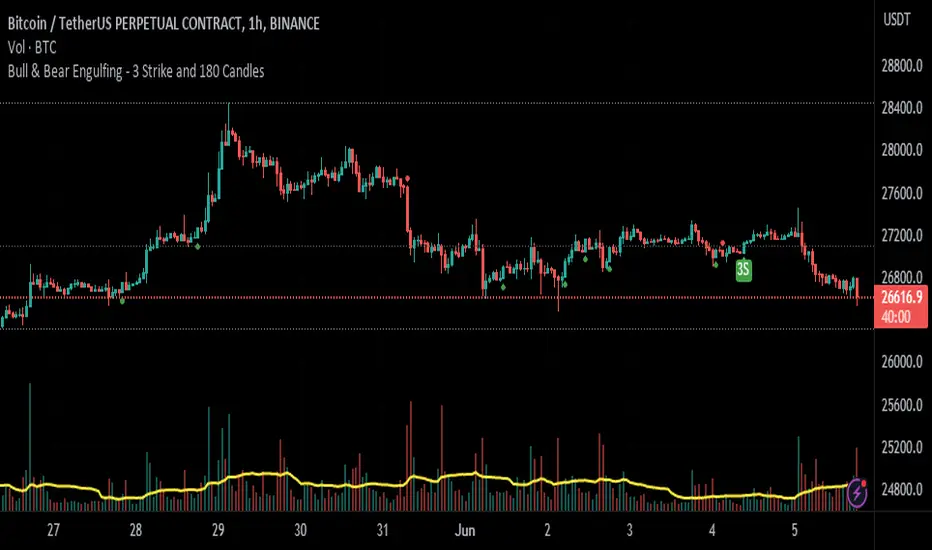
Bull & Bear Engulfing - 3 Strike and 180 CandlesHello, SenatorVonShaft here.
This indicator shows 3 differend candlestick formations:
1- Bullish & Bearish Engulfing Candle
2- Bullish & Bearish 3 Strike Candle
3- Bullish & Bearish 180 Degree Candle
It has 3 variables
1- Bar Fullness - Differs from %50 - %100 showing 1 candle's fullness
2- Avg. Backwds Candls - Gets the average weight of the backward candles
3- Avg. Bar Height Multiplier - This variable is multiplied by above value to determine engulfing candles.
Plots:
- Green & Red Arrows Only : Shows Bullish & Bearish engulfing candles
- Green & Red 180 : Shows a bullish or bearish engulfing candle taken over by a bigger opposite candle
- Green & Red 3S : Shows bullish & bearish 3 strike candle formation
Please feel free to comment your thoughts below.
See you.
Inside candle (Inside Bar) Strategy- by smartanuThe Inside Candle strategy is a popular price action trading strategy that can be used to trade in a variety of markets. Here's how you can trade the Inside Candle strategy using the Pine script code provided:
1. Identify an Inside Candle: Look for a candlestick pattern where the current candle is completely engulfed within the previous candle's high and low. This is known as an Inside Candle.
2. Enter a Long Position: If an Inside Candle is identified, enter a long position at the open of the next candle using the Pine script code provided.
3. Set Stop Loss and Take Profit: Set a stop loss at a reasonable level to limit your potential losses if the trade goes against you. Set a take profit at a reasonable level to take profit when the price reaches the desired level.
4. Manage the Trade: Monitor the trade closely and adjust the stop loss and take profit levels if necessary. You can use the Pine script code to automatically exit the trade when the stop loss or take profit level is hit.
5. Exit the Trade: Exit the trade when the price reaches the take profit level or the stop loss level is hit.
It's important to note that the Inside Candle strategy is just one of many strategies that traders use to trade the markets. It's important to perform your own analysis and use additional indicators before making any trades. Additionally, it's important to practice proper risk management techniques and never risk more than you can afford to lose.

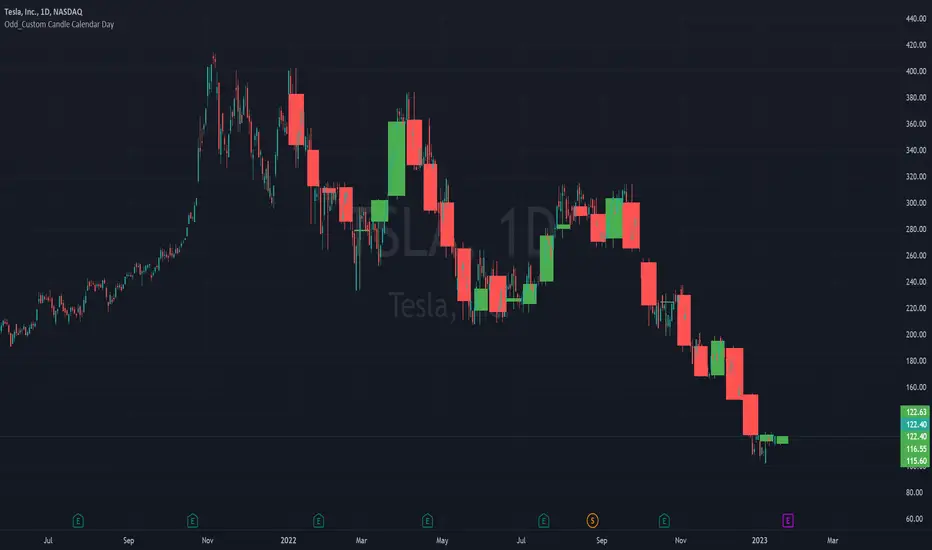
Odd_Custom Candle Calendar DayEver wonder how candles would look on a chart if they were tracked by calendar day instead of market days?
Option(s)-
📅Custom start date for candle formation
✖️Candle multiplier
🌈Up / Down Colors
Features-
📋Displays candle data with invisible plots
Use Move to Existing Pane to Overlay on chart.
Can only display a max of 500 candles!
Session candles & reversals / quantifytools— Overview
Like traditional candles, session based candles are a visualization of open, high, low and close values, but based on session time periods instead of typical timeframes such as daily or weekly. Session candles are formed by fetching price at session start (open), highest price during session (high), lowest price during session (low) and price at session end (close). On top of candles, session based moving average is formed and session reversals detected. Session reversals are also backtested, using win rate and magnitude metrics to better understand what to expect from session reversals and which ones have historically performed the best.
By default, following session time periods are used:
Session #1: London (08:00 - 17:00, UTC)
Session #2: New York (13:00 - 22:00, UTC)
Session #3: Sydney (21:00 - 06:00, UTC)
Session #4: Tokyo (00:00 - 09:00, UTC)
Session time periods can be changed via input menu.
— Reversals
Session reversals are patterns that show a rapid change in direction during session. These formations are more familiarly known as wicks or engulfing candles. Following criteria must be met to qualify as a session reversal:
Wick up:
Lower high, lower low, close >= 65% of session range (0% being the very low, 100% being the very high) and open >= 40% of session range.
Wick down:
Higher high, higher low, close <= 35% of session range and open <= 60% of session range.
Engulfing up:
Higher high, lower low, close >= 65% of session range.
Engulfing down:
Higher high, lower low, close <= 35% of session range.
Session reversals are always based on prior corresponding session , e.g. to qualify as a NY session engulfing up, NY session must have a higher high and lower low relative to prior NY session , not just any session that has taken place in between. Session reversals should be viewed the same way wicks/engulfing formations are viewed on traditional timeframe based candles. Essentially, wick reversals (light green/red labels) tell you most of the motion during session was reversed. Engulfing reversals (dark green/red labels) on the other hand tell you all of the motion was reversed and new direction set.
— Backtesting
Session reversals are backtested using win rate and magnitude metrics. A session reversal is considered successful when next corresponding session closes higher/lower than session reversal close . Win rate is formed by dividing successful session reversal count with total reversal count, e.g. 5 successful reversals up / 10 reversals up total = 50% win rate. Win rate tells us what are the odds (historically) of session reversal producing a clean supporting move that was persistent enough to close that way too.
When a session reversal is successful, its magnitude is measured using percentage increase/decrease from session reversal close to next corresponding session high/low . If NY session closes higher than prior NY session that was a reversal up, the percentage increase from prior session close (reversal close) to current session high is measured. If NY session closes lower than prior NY session that was a reversal down, the percentage decrease from prior session close to current session low is measured.
Average magnitude is formed by dividing all percentage increases/decreases with total reversal count, e.g. 10 total reversals up with 1% increase each -> 10% net increase from all reversals -> 10% total increase / 10 total reversals up = 1% average magnitude. Magnitude metric supports win rate by indicating the depth of successful session reversal moves.
To better understand the backtesting calculations and more importantly to verify their validity, backtesting visuals for each session can be plotted on the chart:
All backtesting results are shown in the backtesting panel on top right corner, with highest win rates and magnitude metrics for both reversals up and down marked separately. Note that past performance is not a guarantee of future performance and session reversals as they are should not be viewed as a complete strategy for long/short plays. Always make sure reversal count is sufficient to draw reliable conclusions of performance.
— Session moving average
Users can form a session based moving average with their preferred smoothing method (SMA , EMA , HMA , WMA , RMA) and length, as well as choose which sessions to include in the moving average. For example, a moving average based on New York and Tokyo sessions can be formed, leaving London and Sydney completely out of the calculation.
— Visuals
By default, script hides your candles/bars, although in the case of candles borders will still be visible. Switching to bars/line will make your regular chart visuals 100% hidden. This setting can be turned off via input menu. As some sessions overlap, each session candle can be separately offsetted forward, clearing the overlaps. Users can also choose which session candles to show/hide.
Session periods can be highlighted on the chart as a background color, applicable to only session candles that are activated. By default, session reversals are referred to as L (London), N (New York), S (Sydney) and T (Tokyo) in both reversal labels and backtesting table. By toggling on "Numerize sessions", these will be replaced with 1, 2, 3 and 4. This will be helpful when using a custom session that isn't any of the above.
Visual settings example:
Session candles are plotted in two formats, using boxes and lines as well as plotcandle() function. Session candles constructed using boxes and lines will be clear and much easier on the eyes, but will apply only to first 500 bars due to Tradingview related limitations. Rest of the session candles go back indefinitely, but won't be as clean:
All colors can be customized via input menu.
— Timeframe & session time period considerations
As a rule of thumb, session candles should be used on timeframes at or below 1H, as higher timeframes might not match with session period start/end, leading to incorrect plots. Using 1 hour timeframe will bring optimal results as greatest amount historical data is available without sacrificing accuracy of OHLC values. If you are using a custom session that is not based on hourly period (e.g. 08:00 - 15:00 vs. 08.00 - 15.15) make sure you are using a timeframe that allows correct plots.
Session time periods applied by default are rough estimates and might be out of bounds on some charts, like NYSE listed equities. This is rarely a problem on assets that have extensive trading hours, like futures or cryptocurrency. If a session is out of bounds (asset isn't traded during the set session time period) the script won't plot given session candle and its backtesting metrics will be NA. This can be fixed by changing the session time periods to match with given asset trading hours, although you will have to consider whether or not this defeats the purpose of having candles based on sessions.
— Practical guide
Whether based on traditional timeframes or sessions, reversals should always be considered as only one piece of evidence of price turning. Never react to them without considering other factors that might support the thesis, such as levels and multi-timeframe analysis. In short, same basic charting principles apply with session candles that apply with normal candles. Use discretion.
Example #1 : Focusing efforts on session reversals at distinct support/resistance levels
A reversal against a level holds more value than a reversal by itself, as you know it's a placement where liquidity can be expected. A reversal serves as a confirming reaction for this expectation.
Example #2 : Focusing efforts on highest performing reversals and avoiding poorly performing ones
As you have data backed evidence of session reversal performance, it makes sense to focus your efforts on the ones that perform best. If some session reversal is clearly performing poorly, you would want to avoid it, since there's nothing backing up its validity.
Example #3 : Reversal clusters
Two is better than one, three is better than two and so on. If there are rapid changes in direction within multiple sessions consecutively, there's heavier evidence of a dynamic shift in price. In such case, it makes sense to hold more confidence in price halting/turning.

Pro Trading Art - Candlestick Patterns with alertAll candlestick pattern based on "Japanese candlestick charting techniques".
Currently Supported List of Candlestick Patterns :
Hammer
Hanging Man
Inverted Hammer
Shooting Star
Morning Star
Evening Star
Bullish Engulfing
Bearish Engulfing
Important Points:
1. You can create alert for all patterns.
2. You can modify multiplier(Length Of Shadow) for Hammer, Hanging Man, Inverted Hammer and Shooting Star
3. You can modify EMA length for upward and downward validation of any pattern.

NSDT Bearish-Bullish CandlesThis is another interesting take on candlesticks . These Bearish-Bullish Candles do not show the wicks. Instead, the upper wick is made into a Red body and the lower wick is made into a Green body. If you match the candle body color in the chart settings (or turn off the candles completely), you get a unique way of seeing how Bearish or how Bullish a candle is because the wick will now match the body size and color.
This indicator is very similar to our NSDT Special High-Low Candles.
