Function To Candles - Another way to see indicatorsIntroduction
There are different and better way's to see price data, a candlestick chart is one of the best way to see the price since you have access to the open/high/low/close information, this is really efficient and can allow for naked non parametric trading strategies (candlesticks patterns) . But what about making candles out of indicators ? There are tons of studies about candlesticks patterns in price data but none (?) about candlestick patterns using indicator data, therefore i made this script in order to show candles from various indicators, i also made an heikin-ashi mode.
Rsi To Candles
All the indicators are use the open/high/low/close price as input in order to return candles. length control the indicator period.
Stochastic To Candles
The stochastic oscillator is restrained in a range of 0/100, therefore when equal to 0 or 100 the candles can be flat.
Rate Of Change To Candles
The rate of change don't distort price as heavily as other indicators since its based on differencing.
Center Of Gravity To Candles
The center of gravity (cog) is defined from tradingview as "an indicator based on statistics and the Fibonacci golden ratio", its not an indicator i'am familiar with and i don't know if its the same proposed by Elhers. The candles are smooth, high length can flatten the candles heavily making them hard to see.
Correlation Oscillator
In a range of -1/1 this indicator is quite smooth and can also flatten candles.
Patterns And Heikin-Ashi
There are tons of patterns that can be generated from candlesticks, they can be applied to this indicator as well.
The indicator can show an heikin-ashi mode, heikin-ashi candlestick use averaging to plot candles, this is why they appear smoother, some signals generated from heikin-ashi candles are :
Bullish body with no lower shadows = Strong Uptrend
Bearish body with no higher shadows = Strong Downtrend
High range and small body = Indecision/Risk of reversal
Conclusion
I made an indicator able to draw candles from other indicators, those candles contain various information that can generate decision from patterns. I hope you find a use to it, if its the case share your findings with me, maybe that you will even be able find a new candlestick pattern :)
Thanks for reading !
"candle" için komut dosyalarını ara

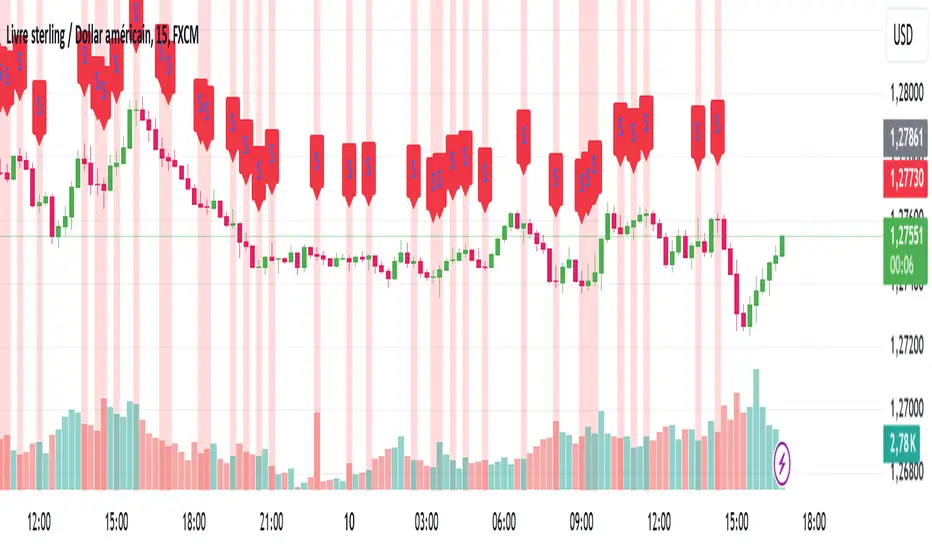
Big Candle Trend█ OVERVIEW
The "Big Candle Trend" indicator is a technical analysis tool written in Pine Script® v6 that identifies large signal candles on the chart and determines the trend direction based on the analysis of all candles within a specified period. Designed for traders seeking a simple yet effective tool to identify key market movements and trends, the indicator provides clarity and precision through flexible settings, trend line visualization, and retracement lines on signal candles.
█ CONCEPTS
The goal of the "Big Candle Trend" indicator was to create a tool based solely on the size of candle bodies and their relative positions, making it universal and effective across all markets (stocks, forex, cryptocurrencies) and timeframes. Unlike traditional indicators that often rely on complex formulas or external data (e.g., volume), this indicator uses simple yet powerful price action logic. Large signal candles are identified by comparing their body size to the average body size over a selected period, and the trend is determined by analyzing price changes over a longer period relative to the average candle body size. Additionally, the indicator draws horizontal lines on signal candles, aiding in setting Stop Loss levels or delayed entries.
█ FEATURES
Large Signal Candle Detection: Identifies candles with a body larger than the average body multiplied by a user-defined multiplier, aligned with the trend (if the trend filter is enabled). Signals are displayed as triangles (green for bullish, red for bearish).
Trend Analysis: Determines the trend (uptrend, downtrend, or neutral) by comparing the price change over a selected period (trend_length) to the average candle body size multiplied by a trend strength multiplier. The trend starts when:
Uptrend: The price change (difference between the current close and the close from an earlier period) is positive and exceeds the average candle body size multiplied by the trend strength multiplier (avg_body_trend * trend_mult).
Downtrend: The price change is negative and exceeds, in absolute value, the average candle body size multiplied by the trend strength multiplier.
Neutral Trend: The price change is below the required threshold, indicating no clear market direction.The trend ends when the price change no longer meets the conditions for an uptrend or downtrend, transitioning to a neutral state or switching to the opposite trend when the price change reverses and meets the conditions for the new trend. This approach differs from standard methods as it focuses on price dynamics in the context of candle body size, offering a more intuitive and direct way to gauge trend strength.
Smoothed Trend Line: Displays a trend line based on the average price (HL2, i.e., the average of the high and low of a candle), smoothed using a user-defined smoothing parameter. The trend line reflects the market direction but is not tied to breakouts, unlike many other trend indicators, allowing for more flexible interpretation.
Retracement Lines: Draws horizontal lines on signal candles at a user-defined level (e.g., 0.618). The lines are displayed to the right of the candle, with a width of one candle. For bullish candles, the line is measured from the top of the body (close) downward, and for bearish candles, from the bottom of the body (close) upward, aiding in setting Stop Loss or delayed entries.
Trend Option: Option to enable a trend filter that limits large candle signals to those aligned with the current trend, enhancing signal precision.
Customizable Visualization: Allows customization of colors for uptrend, downtrend, and neutral states, trend line style, and shadow fill between the trend line and price.
Alerts: Built-in alerts for large signal candles (bullish and bearish) and trend changes (start of uptrend, downtrend, or neutral trend).
█ HOW TO USE
Add to Chart: Apply the indicator to your TradingView chart via the Pine Editor or Indicators menu.
Configure Settings:
Candle Settings:
Average Period (Candles): Sets the period for calculating the average candle body size.
Large Candle Multiplier: Multiplier determining how large a candle’s body must be to be considered "large".
Trend Settings:
Trend Period: Period for analyzing price changes to determine the trend.
Trend Strength Multiplier: Multiplier setting the minimum price change required to identify a significant trend.
Trend Line Smoothing: Degree of smoothing for the trend line.
Show Trend Line: Enables/disables the display of the trend line.
Apply Trend Filter: Limits large candle signals to those aligned with the current trend.
Trend Colors:
Customize colors for uptrend (green), downtrend (red), and neutral (gray) states, and enable/disable shadow fill.
Retracement Settings:
Retracement Level (0.0-1.0): Sets the level for lines on signal candles (e.g., 0.618).
Line Width: Sets the thickness of retracement lines.
Interpreting Signals:
Bullish Signal: A green triangle below the candle indicates a large bullish candle aligned with an uptrend (if the trend filter is enabled). A horizontal line is drawn to the right of the candle at the retracement level, measured from the top of the body downward.
Bearish Signal: A red triangle above the candle indicates a large bearish candle aligned with a downtrend (if the trend filter is enabled). A horizontal line is drawn to the right of the candle at the retracement level, measured from the bottom of the body upward.
rend Line: Shows the market direction (green for uptrend, red for downtrend, gray for neutral). Unlike many indicators, the trend line’s color is not tied to its breakout, allowing for more flexible interpretation of market dynamics.
Alerts: Set up alerts in TradingView for large signal candles or trend changes to receive real-time notifications.
Combining with Other Tools: Use the indicator alongside other technical analysis tools, such as support/resistance levels, RSI, moving averages, or Fair Value Gaps (FVG), to confirm signals.
█ APPLICATIONS
Price Action Trading: Large signal candles can indicate key market moments, such as breakouts of support/resistance levels or strong price rejections. Use signal candles in conjunction with support/resistance levels or FVG to identify entry opportunities. Retracement lines help set Stop Loss levels (e.g., below the line for bullish candles, above for bearish) or delayed entries after price returns to the retracement level and confirms trend continuation. Note that large candles often generate Fair Value Gaps (FVG), which should be considered when setting Stop Loss levels.
Trend Strategies: Enable the trend filter to limit signals to those aligned with the dominant market direction. For example, in an uptrend, look for large bullish candles as continuation signals. The indicator can also be used for position pyramiding, adding positions as subsequent large candles confirm trend continuation.
Practical Approach:
Large candles with high volume may indicate strong market participation, increasing signal reliability.
The trend line helps visually assess market direction and confirm large candle signals.
Retracement lines on signal candles aid in identifying key levels for Stop Loss or delayed entries.
█ NOTES
The indicator works across all markets and timeframes due to its universal logic based on candle body size and relative positioning.
Adjust settings (e.g., trend period, large candle multiplier, retracement level) to suit your trading style and timeframe.
Test the indicator on various markets (stocks, forex, cryptocurrencies) and timeframes to optimize its performance.
Use in conjunction with other technical analysis tools to enhance signal accuracy.

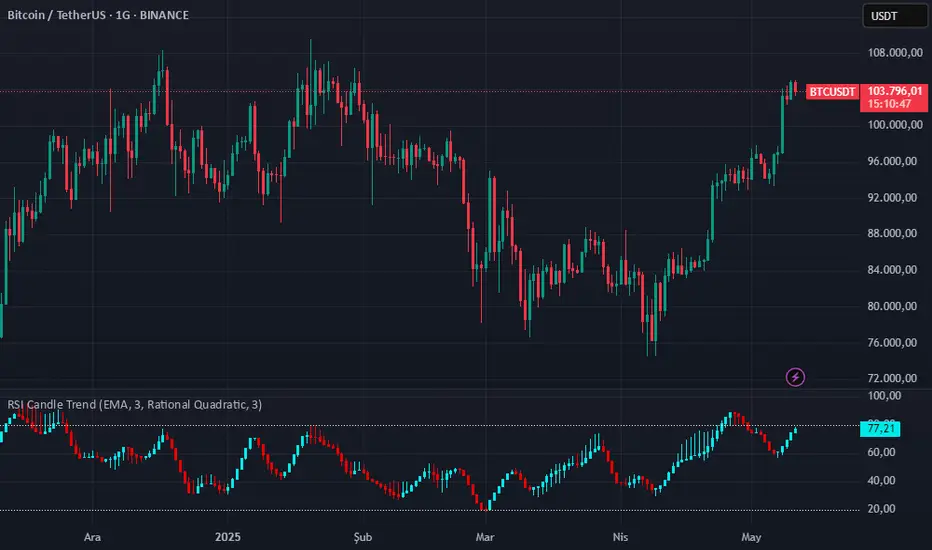
RSI Candle Trend🎯 Purpose:
This TradingView script is designed to visualize trend strength using RSI values as candle data, instead of traditional price candles. It transforms RSI data into custom candles using various smoothing and filtering methods (like Heikin-Ashi, Linear Regression, Rational Quadratic Filter, or McGinley Dynamic). It allows traders to:
📌Track RSI-based momentum using visual candle representation
📌Apply advanced smoothing/filters to the RSI to reduce noise
📌Highlight candle trend strength using dynamic coloring
📌Identify overbought/oversold zones using reference lines (RSI 80 and 20)
🧩 How It Works:
It calculates RSI values for open, high, low, close prices.
These RSI values are then optionally smoothed with user-selected moving averages (EMA, SMA, etc.).
Depending on the selected mode (Normal, Heikin-Ashi, Linear, Rational Quadratic), the RSI values are transformed into synthetic candles.
Candles are colored cyan (uptrend) or red (downtrend) based on RSI movement.
⚙️ Key Inputs:
Method: Type of moving average to smooth the RSI (e.g. EMA, SMA, VWMA, etc.)
Length: Length for RSI and smoothing filters
Candle: Type of candle transformation (Normal, Heikin-Ashi, Linear, Rational Quadratic)
Rational Quadratic: Parameter for the Rational Quadratic smoothing method
📊 Outputs:
Custom candles plotted using RSI-transformed values
Candle colors based on RSI strength:
Cyan for strong bullish RSI movement
Red for strong bearish RSI movement
Horizontal lines at RSI levels 80 and 20 (overbought/oversold)
🧠 Why Use This Indicator?
Unlike traditional RSI indicators that show a line, this tool:
Converts RSI into candle-style visualization
Helps traders visually interpret trend strength, reversals, or continuation patterns
Offers more refined control over RSI behavior and filtering
Provides a unique blend of momentum and candle analysis
❗Important Note:
This script is provided for educational purposes and does not constitute financial advice. Traders and investors should conduct their research and analysis before making any trading decisions.
HTF CandlesHTF Candles, Plot of a Higher/Lower Timeframe Candles on any chart.
This HTF / LTF candle plot displays the previous 3 daily candles with the current update of the price with reference to a lower time frame.
Candles includes 3 Candles of HTF
last HTF candle includes 4 previous candles from LTF
Candle High Low Open Close are plotted.
these OHLC values act as Support and Resistance With reference to current Price.
very useful in making HTF and LTF analysis with reference to current timeframe.

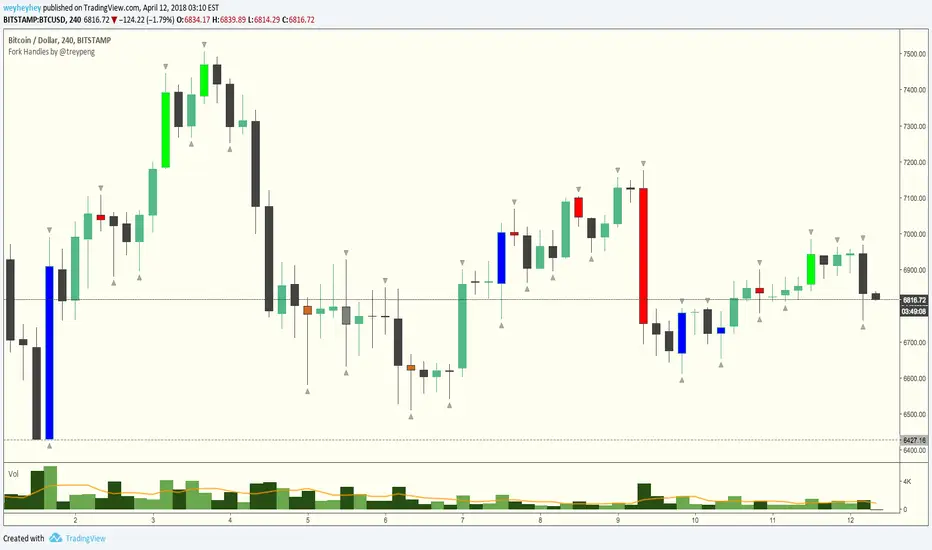
Fork Handles by @treypeng
Candle based indicator that shows swing highs and lows (pivots).
It draws an up or down arrow for simple three candle 'single' swings.
For stronger five candle 'double' swings, it colours the candle. Good for highlighting stronger reversals.
Both of these stylings can be toggled on/off individually.
Default colours
Swing HIGH on an UP candle: bright green
Swing HIGH on an DOWN candle: bright red
Swing LOW on an UP candle: blue
Swing LOW on an DOWN candle: brown
Double swings are grey or white.
Regular candles are just kept to your own default colours as specified in the chart settings.
👏 for anyone who gets the 'fork handles' joke reference.
Big Candle Touches Bollinger BandWhat It Does:
This indicator helps you spot important trading signals by combining Bollinger Bands with big candles.
Key Features:
Bollinger Bands: These bands show the average price (middle band) and the range of price movement (upper and lower bands) over a set period. The bands widen when prices are more volatile and narrow when they are less volatile.
Big Candle Detection: A "big candle" is a candle that has a larger body compared to the average price movement over a period. This is determined using the Average True Range (ATR), which measures market volatility.
How It Works:
Detects Big Candles: It checks if a candle’s body (the difference between its open and close prices) is bigger than usual, based on a multiplier of the ATR.
Touching Bollinger Bands: It looks for candles that touch or cross the upper or lower Bollinger Bands.
Highlights Important Signals:
Sell Signal: When a big candle touches the upper Bollinger Band, it marks it as a "Sell" signal with a red label.
Buy Signal: When a big candle touches the lower Bollinger Band, it marks it as a "Buy" signal with a green label.
Alerts:
You'll get alerts when a big candle touches the upper or lower Bollinger Bands, so you don’t miss these potential trading opportunities.
Visuals:
Bollinger Bands: Shown as three lines on the chart — the upper band (red), the lower band (green), and the middle band (blue).
Labels: Red labels for sell signals and green labels for buy signals when a big candle touches the bands.
This indicator helps you identify potential trading opportunities by focusing on significant price movements and how they interact with the Bollinger Bands.

High volume candles.
High Volume Candles Indicator:
This is a simple tool that shows you when there's a lot of action in the market. It highlights the candles with the highest trading volume on your chart.
What It Does:
Picks the Busiest Candle: It points out the candle with the most trading in your set time.
Shows Buying and Selling: Green for lots of buying, red for lots of selling.
You Choose the Time Frame: Whether it's a few candles or many, it's up to you.
Best Part - Alerts:
Get Notified: The cool thing? It'll alert you when these big volume candles happen. You won't miss the important moments.
Use this to keep track of when things are really moving in the market, without having to watch your screen all the time.

Adjustable Bull Bear Candle Indicator (V1.2)Indicator Description: Adjustable Bull Bear Candle Indicator
This indicator, named "Adjustable Bull Bear Candle Indicator ," is designed to assist traders in identifying potential bullish and bearish signals within price charts. It combines candlestick pattern analysis, moving average crossovers, and RSI (Relative Strength Index) conditions to offer insights into potential trading opportunities.
Disclaimer:
Trading involves substantial risk and is not suitable for every investor. This indicator is a tool designed to aid in technical analysis, but it does not guarantee successful trades. Always exercise your own judgment and seek professional advice before making any trading decisions.
Key Features:
Preceding Candles Analysis:
The indicator examines the behavior of the previous 'n' candles to identify specific patterns that indicate bearish or bullish momentum.
Candlestick Pattern and Momentum:
It considers the relationship between the opening and closing prices of the current candle to determine if it's bullish or bearish. The indicator then assesses the absolute price difference and compares it to the cumulative absolute differences of preceding candles.
Moving Averages:
The indicator calculates two Simple Moving Averages (SMAs) – Close SMA and Far SMA – to help identify trends and crossovers in price movement.
Relative Strength Index (RSI):
RSI is used as an additional measure to gauge momentum. It analyzes the current price's magnitude of recent gains and losses and compares it to past data.
Time Constraint:
If enabled, the indicator operates within a specific time window defined by the user. This feature can help traders focus on specific market hours.
Customizable Alerts:
The indicator includes an alert system that can be enabled or disabled. You can also adjust the specific alert conditions to align with your trading strategy.
How to Use:
This indicator generates buy signals when specific conditions are met, including a bullish candlestick pattern, positive price difference, closing price above the SMAs, RSI above a threshold, preceding bearish candles, and optionally within a specified time window. Conversely, short signals are generated under conditions opposite to those of the buy signal.
Disclosure and Risk Warning:
Educational Tool: This indicator is meant for educational purposes and to aid traders in their technical analysis. It's not a trading strategy in itself.
Risk of Loss: Trading carries inherent risks, including the potential for substantial loss. Always manage risk and consider using proper risk management techniques.
Diversification: Do not rely solely on this indicator. A well-rounded trading approach includes fundamental analysis, risk management, and proper diversification.
Consultation: It's strongly advised to consult with a financial professional before making any trading decisions.
Conclusion:
The "Bullish Candle after Bearish Candles with Momentum Indicator" can be a valuable tool in your technical analysis toolkit. However, successful trading requires a deep understanding of market dynamics, risk management, and continual learning. Use this indicator in conjunction with other tools and strategies to enhance your trading decisions.
Remember that past performance is not indicative of future results. Always be cautious and informed when participating in the financial markets.

FVG Maxing - Fair Value Gaps, Equilibrium, and Candle Patterns
What this script does
This open-source indicator highlights 3-candle fair value gaps (FVGs) on the active chart timeframe, draws their midpoint ("equilibrium") line, tracks when each gap is mitigated, and optionally marks simple candle patterns (engulfing and doji) for confluence. It is intended as an educational tool to study how price interacts with imbalances.
3-candle bullish and bearish FVG zones drawn as forward-extending boxes.
Equilibrium line at 50% of each gap.
Different styling for mitigated vs unmitigated gaps.
Compact statistics panel showing how many gaps are currently active and filled.
Optional overlays for bullish/bearish engulfing patterns and doji candles.
1. FVG logic (3-candle gaps)
The script focuses on a strict 3-candle definition of a fair value gap:
Three consecutive candles with the same body direction.
The wick of candle 3 is separated from the wick of candle 1 (no overlap).
A bullish gap is created when price moves up fast enough to leave a gap between candle 1 and 3. A bearish gap is the mirror case to the downside.
In Pine, the core detection looks like this:
// Three candles with the same body direction
bull_seq = close > open and close > open and close > open
bear_seq = close < open and close < open and close < open
// Wick gap between candle 1 and candle 3
bull_gap = bull_seq and low > high
bear_gap = bear_seq and high < low
// Final FVG flags
is_bull_fvg = bull_gap
is_bear_fvg = bear_gap
For each detected FVG:
Bullish FVG range: from high up to low (gap below current price).
Bearish FVG range: from low down to high (gap above current price).
Each zone is stored in a custom FVGData structure so it can be updated when price later trades back inside it.
2. Equilibrium line (0.5 of the gap)
Every FVG box gets an optional equilibrium line plotted at the midpoint between its top and bottom:
eq_level = (top + bottom) / 2.0
right_index = extend_boxes ? bar_index + extend_length_bars : bar_index
bx = box.new(bar_index - 2, top, right_index, bottom)
eq_ln = line.new(bar_index - 2, eq_level, right_index, eq_level)
line.set_style(eq_ln, line.style_dashed)
line.set_color(eq_ln, eq_color)
You can use this line as a neutral “fair value” reference inside the zone, or as a simple way to think in terms of premium/discount within each gap.
3. Mitigation rules and styling
Each FVG stays active until price trades back into the gap:
Bullish FVG is considered mitigated when the low touches or moves below the top of the gap.
Bearish FVG is considered mitigated when the high touches or moves above the bottom of the gap.
When that happens, the script:
Marks the internal FVGData entry as mitigated.
Softens the box fill and border colors.
Optionally updates the label text from "BULL EQ / BEAR EQ" to "BULL FILLED / BEAR FILLED".
Can hide mitigated zones almost completely if you only want to see unfilled imbalances.
This allows you to distinguish between current areas of interest and zones that have already been traded through.
4. Candle pattern overlays (engulfing and doji)
For additional confluence, the script can mark simple candle patterns on top of the FVG view:
Bullish engulfing — current candle body fully wraps the previous bearish body and is larger in size.
Bearish engulfing — current candle body fully wraps the previous bullish body and is larger in size.
Doji — candles where the real body is small relative to the full range (high–low).
The detection is based on basic body and range geometry:
curr_body = math.abs(close - open)
prev_body = math.abs(close - open )
curr_range = high - low
body_ratio = curr_range > 0 ? curr_body / curr_range : 1.0
bull_engulfing = close > open and close < open and open <= close and close >= open and curr_body > prev_body
bear_engulfing = close < open and close > open and open >= close and close <= open and curr_body > prev_body
is_doji = curr_range > 0 and body_ratio <= doji_body_ratio
On the chart, they appear as:
Small triangle markers below bullish engulfing candles.
Small triangle markers above bearish engulfing candles.
Small circles above doji candles.
All three overlays are optional and can be turned on or off and recolored in the CANDLE PATTERNS group of inputs.
5. Inputs overview
The script organizes settings into clear groups:
DISPLAY SETTINGS : Show bullish/bearish FVGs, show/hide mitigated zones, box extension length, box border width, and maximum number of boxes.
EQUILIBRIUM : Toggle equilibrium lines, color, and line width.
LABELS : Enable labels, choose whether to label unmitigated and/or mitigated zones, and select label size.
BULLISH COLORS / BEARISH COLORS : Separate fill and border colors for bullish and bearish gaps.
MITIGATED STYLE : Opacity used when a gap is marked as mitigated.
STATISTICS : Toggle the on-chart FVG statistics panel.
CANDLE PATTERNS : Show engulfing patterns, show dojis, colors, and the body-to-range threshold that defines a doji.
6. Statistics panel
An optional table in the corner of the chart summarizes the current state of all tracked gaps:
Total number of FVGs still being tracked.
Number of bullish vs bearish FVGs.
Number of unfilled vs mitigated FVGs.
Simple fill rate: percentage of tracked FVGs that have been marked as mitigated.
This can help you study how a particular market tends to treat gaps over time.
7. How you might use it (examples)
These are usage ideas only, not recommendations:
Study how often your symbol mitigates gaps and where inside the zone price tends to react.
Use higher-timeframe context and then refine entries near the equilibrium line on your trading timeframe.
Combine FVG zones with basic candle patterns (engulfing/doji) as an extra visual anchor, if that fits your process.
Hope you enjoy, give your feedback in the comments!
- officialjackofalltrades

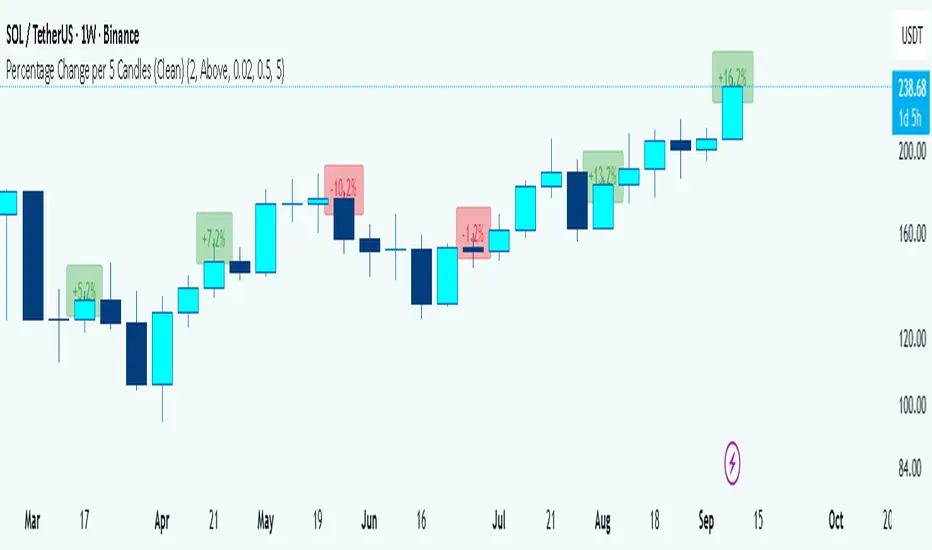
Percentage Change per 5 Candles
🔎 What this indicator does
This indicator calculates and displays the percentage change of each candlestick directly on the chart.
• If a candle closed higher than it opened (bullish candle), it shows a positive % change (green).
• If a candle closed lower than it opened (bearish candle), it shows a negative % change (red).
• Small moves below your chosen threshold (e.g., 0.1%) are ignored to avoid clutter.
• The labels are placed above, below, or in the center of the candle (you choose).
So essentially, every candle “tells you in numbers” exactly how much it changed relative to its opening price.
________________________________________
⚙️ How it operates (the logic inside)
1. Calculate the change
o Formula:
\text{% Change} = \frac{(\text{Close} - \text{Open})}{\text{Open}} \times 100
o Example: If a candle opens at 100 and closes at 105, that’s a +5% change.
2. Round it nicely
o You can control decimals (e.g., show 2 decimals → +5.23%).
3. Filter out noise
o If a candle barely moved (say 0.02%), the label won’t appear unless you reduce the threshold.
4. Style the labels
o Bullish = green text, slightly transparent green background.
o Bearish = red text, slightly transparent red background.
o Neutral (0%) = gray.
5. Place the labels
o Options: above the candle, below the candle, or centered.
o Small vertical offset is applied so labels don’t overlap the candle itself.
________________________________________
📊 How this helps traders
This indicator turns visual candles into quantifiable numbers at a glance. Instead of guessing whether a move was “big” or “small,” you see it clearly.
Key Benefits:
1. Quick volatility analysis
o You can instantly see if candles are making big % swings or just small moves.
o This is especially useful on higher timeframes (daily/weekly) where moves can be large.
2. Pattern confirmation
o For example, you might spot a strong bullish engulfing candle — the % change label helps confirm whether it was truly significant (e.g., +4.5%) or just modest (+0.7%).
3. Noise filtering
o By setting a minimum % threshold, you only see labels when moves are meaningful (say > 0.5%). This keeps focus on important candles.
4. Backtesting & comparison
o You can compare moves across time:
“How strong was this breakout candle compared to the last one?”
“Are today’s bearish candles weaker or stronger than yesterday’s bullish candles?”
5. Better decision-making
o If you’re trading breakouts, reversals, or trend-following, knowing the % size of each candle helps confirm if the move has enough momentum.
________________________________________
✅ In short:
This indicator quantifies price action. Instead of just seeing “green” or “red” candles, you now know exactly how much the price changed in percentage terms, directly on the chart, in real time. It helps you distinguish between strong and weak moves and makes your analysis more precise.
________________________________________
squeeze candles with volume Function :
This indicator was designed to detect specific candles called “squeeze”. These candles are characterized by a relatively small body (the difference between the opening and closing price) and long shadows (the distance between the high and low prices), accompanied by significant volume. They often indicate a period of increased volatility or a potential trend reversal.
Use :
Visual detection:
Candles identified as "squeeze" are highlighted in red on the chart.
An “S” icon appears above each detected squeeze candle.
Alerts:
The indicator emits an audible and visual alert when a squeeze candle with high volume is detected (if alerts are enabled).
Market analysis:
This indicator is particularly useful for identifying trading opportunities during periods when the market is showing signs of compression or impending volatility.
Customizable settings:
Minimum volume: Defines the threshold at which the volume is considered high.
Maximum body/shadow ratio: Allows you to adjust the sensitivity to detect squeeze candles (the lower the ratio, the smaller the detected candles will have in relation to their shadows).
Benefits :
Provides accurate alerts on key market candles.
Helps anticipate large movements through analysis of volume and candle characteristics.
Adaptable to different strategies thanks to adjustable parameters.
Ideal for:
Traders who want to identify areas of potential volatility or reversal signals in the market, regardless of the asset or time frame used.
Capitulation Candle for Bitcoin and Crypto V1.0 [ADRIDEM]Overview
The Capitulation Candle for Bitcoin and Crypto script identifies potential capitulation events in the cryptocurrency market. Capitulation candles indicate a significant sell-off, often marking a potential market bottom. This script highlights such candles by analyzing volume, price action, and other technical conditions. Below is a detailed presentation of the script and its unique features.
Unique Features of the New Script
Volume-Based Analysis : Uses a volume multiplier to detect unusually high trading volumes, which are characteristic of capitulation events. The default multiplier is 5.0, but it can be adjusted to suit different market conditions.
Support Level Detection : Looks back over a customizable period (default is 150 bars) to find support levels, helping to identify significant price breaks.
ATR-Based Range Condition : Ensures that the price range of a capitulation candle is a multiple of the Average True Range (ATR), confirming significant price movement. The default ATR multiplier is 10.0.
Dynamic Dot Sizes : Plots dots of different sizes below capitulation candles based on volume thresholds, providing a visual indication of the volume's significance.
Visual Indicators : Highlights capitulation candles and plots support levels, offering clear visual cues for potential market bottoms.
Originality and Usefulness
This script uniquely combines volume analysis, support level detection, and ATR-based range conditions to identify capitulation candles. The dynamic dot sizes and clear visual indicators make it an effective tool for traders looking to spot potential reversal points in the cryptocurrency market.
Signal Description
The script includes several features that highlight potential capitulation events:
High Volume Detection : Identifies candles with unusually high trading volumes using a customizable volume multiplier.
Support Level Breaks : Detects candles breaking significant support levels over a customizable lookback period.
ATR Range Condition : Ensures the candle's range is significant compared to the ATR, confirming substantial price movement.
Dynamic Dot Sizes : Plots small, normal, and large dots below candles based on different volume thresholds.
These features assist in identifying potential capitulation events and provide visual cues for traders.
Detailed Description
Input Variables
Volume Multiplier (`volMultiplier`) : Detects high-volume candles using this multiplier. Default is 5.0.
Support Lookback Period (`supportLookback`) : The period over which support levels are calculated. Default is 150.
ATR Multiplier (`atrMultiplier`) : Ensures the candle's range is a multiple of the ATR. Default is 10.0.
Small Volume Multiplier Threshold (`smallThreshold`) : Threshold for small dots. Default is 5.
Normal Volume Multiplier Threshold (`normalThreshold`) : Threshold for normal dots. Default is 10.
Large Volume Multiplier Threshold (`largeThreshold`) : Threshold for large dots. Default is 15.
Functionality
High Volume Detection : The script calculates the simple moving average (SMA) of the volume and checks if the current volume exceeds the SMA by a specified multiplier.
```pine
smaVolume = ta.sma(volume, supportLookback)
isHighVolume = volume > smaVolume * volMultiplier
```
Support Level Detection : Determines the lowest low over the lookback period to identify significant support levels.
```pine
supportLevel = ta.lowest(low , supportLookback)
isLowestLow = low == supportLevel
```
ATR Range Condition : Calculates the ATR and ensures the candle's range is significant compared to the ATR.
```pine
atr = ta.atr(supportLookback)
highestHigh = ta.highest(high, supportLookback)
rangeCondition = (highestHigh - low ) >= (atr * atrMultiplier)
```
Combining Conditions : Combines various conditions to identify capitulation candles.
```pine
isHigherVolumeThanNext = volume > volume
isHigherVolumeThanPrevious = volume > volume
bodySize = math.abs(close - open )
candleRange = high - low
rangeBiggerThanPreviousBody = candleRange > bodySize
isCapitulationCandle = isHighVolume and isHigherVolumeThanPrevious and isHigherVolumeThanNext and isLowestLow and rangeCondition and rangeBiggerThanPreviousBody
```
Dynamic Dot Sizes : Determines dot sizes based on volume thresholds and plots them below the identified capitulation candles.
```pine
isSmall = volume > smaVolume * smallThreshold and volume <= smaVolume * normalThreshold
isNormal = volume > smaVolume * normalThreshold and volume <= smaVolume * largeThreshold
isLarge = volume > smaVolume * largeThreshold
plotshape(series=isCapitulationCandle and isSmall, location=location.belowbar, offset=-1, color=color.rgb(255, 82, 82, 40), style=shape.triangleup, size=size.small)
plotshape(series=isCapitulationCandle and isNormal, location=location.belowbar, offset=-1, color=color.rgb(255, 82, 82, 30), style=shape.triangleup, size=size.normal)
plotshape(series=isCapitulationCandle and isLarge, location=location.belowbar, offset=-1, color=color.rgb(255, 82, 82, 20), style=shape.triangleup, size=size.large)
```
Plotting : The script plots support levels and highlights capitulation candles with different sizes based on volume significance.
```pine
plot(supportLevel, title="Support Level", color=color.rgb(255, 82, 82, 50), linewidth=1, style=plot.style_line)
```
How to Use
Configuring Inputs : Adjust the volume multiplier, support lookback period, ATR multiplier, and volume thresholds as needed.
Interpreting the Indicator : Use the plotted support levels and highlighted capitulation candles to identify potential market bottoms and reversal points.
Signal Confirmation : Look for capitulation candles with high volumes breaking significant support levels and meeting the ATR range condition. The dynamic arrow sizes help to assess the volume's significance.
This script provides a detailed and visual method to identify potential capitulation events in the cryptocurrency market, aiding traders in spotting possible reversal points and making informed trading decisions.

Bullish Candlestick Patterns With Filters [TradeDots]The "Bullish Candlestick Patterns With Filters" is a trading indicator that identifies 6 core bullish candlestick patterns. This is further enhanced by applying channel indicator as filters, designed to further increase the accuracy of the recognized patterns.
6 CANDLESTICK PATTERNS
Hammer
Inverted Hammer
Bullish Engulfing
The Piercing Line
The Morning Star
The 3 White Soldiers
SIGNAL FILTERING
The indicator incorporates with 2 primary methodologies aimed at filtering out lower accuracy signals.
Firstly, it comes with a "Lowest period" parameter that examines whether the trough of the bullish candlestick configuration signifies the lowest point within a specified retrospective bar length. The longer the period, the higher the probability that the price will rebound.
Secondly, the channel indicators, the Keltner Channels or Bollinger Bands. This indicator examines whether the lowest point of the bullish candlestick pattern breaches the lower band, indicating an oversold signal. Users have the flexibility to modify the length and band multiplier, enabling them to custom-tune signal sensitivity.
Without Filtering:
With Filtering
RISK DISCLAIMER
Trading entails substantial risk, and most day traders incur losses. All content, tools, scripts, articles, and education provided by TradeDots serve purely informational and educational purposes. Past performances are not definitive predictors of future results.

Three Candle Rolling Pivot Range**Strategy Description: Three Previous Candle Rolling Pivot Range**
**Introduction:**
This trading strategy is based on the concept of the rolling pivot range calculated from the high, low, and close prices of the three previous candles. The rolling pivot range serves as a dynamic support and resistance level, and this strategy aims to capture potential trading opportunities based on the price relationship with this range.
**Strategy Components:**
**1. Rolling Pivot Range Calculation:**
- **Rolling Pivot:** Calculate the rolling pivot by averaging the high, low, and close prices of the three previous candles.
- **Second Number:** Find the midpoint between the high and low of the three previous candles.
- **Pivot Differential:** Measure the difference between the rolling pivot and the second number.
- **Rolling Pivot Range High:** Set as rolling pivot + pivot differential.
- **Rolling Pivot Range Low:** Set as rolling pivot - pivot differential.
**2. Entry Rules:**
- **Long Entry:**
- Initiate a long entry when the current close is above both the rolling pivot range high and the rolling pivot.
- Continue the long entry as long as both the rolling pivot range high and low are higher than the corresponding values of the previous candle.
- **Short Entry:**
- Start a short entry when the current close is below both the rolling pivot range high and the rolling pivot.
- Continue the short entry as long as both the rolling pivot range high and low are lower than the corresponding values of the previous candle.
**Visualization:**
- **Plotting:**
- The rolling pivot range high, rolling pivot, and rolling pivot range low are plotted on the chart for visual reference.
- Long entry points are marked with a green triangle below the corresponding candle.
- Short entry points are marked with a red triangle above the corresponding candle.
**Conclusion:**
This strategy leverages the rolling pivot range to identify potential reversal points in the market. By considering the relative position of the current price compared to the dynamic support and resistance levels, the strategy aims to capture favorable trading opportunities. However, like all trading strategies, it should be used cautiously and backtested thoroughly on historical data to ensure its effectiveness before implementation in a live trading environment. Additionally, risk management techniques should always be applied to safeguard trading capital.

Candle Microstructure ClassifierCandle Microstructure Classifier
Public Description
The Candle Microstructure Classifier is a visual study designed to highlight meaningful single-candle behaviors based purely on price geometry. It classifies candles according to body size and wick structure, helping traders visually identify moments of aggression, commitment, failed pushes, and rejection directly on the price chart.
This script is a study only. It does not generate trade signals, entries, exits, or forecasts. Its purpose is to provide structural context that can be combined with other tools such as trend, volume, or volatility analysis.
Quantitative Description
Each candle is decomposed into its geometric components relative to its total range (high − low). All classifications are based on normalized fractions to remain scale‑independent across instruments and timeframes.
Definitions:
1. Candle Range (R):
R = High − Low
2. Body Size (B):
B = |Close − Open|
Body Fraction = B / R
3. Upper Wick (UW):
UW = High − max(Open, Close)
Upper Wick Fraction = UW / R
4. Lower Wick (LW):
LW = min(Open, Close) − Low
Lower Wick Fraction = LW / R
Candle Classifications:
• Commitment Candle:
Body Fraction ≥ Large Body Threshold
Upper Wick Fraction ≤ Tiny Wick Threshold
Lower Wick Fraction ≤ Tiny Wick Threshold
Interpretation: Strong directional acceptance with minimal intrabar rejection.
• Marubozu (Aggression):
Body Fraction ≥ Large Body Threshold
One wick effectively absent (near zero)
Interpretation: Pure directional aggression with no meaningful counter‑pressure.
• Trend Attempt Failure:
Body Fraction ≥ Large Body Threshold
One wick large, opposite wick small
Interpretation: Strong push followed by immediate rejection on one side.
• Rejection Candle:
Body Fraction ≤ Small Body Threshold
Upper Wick Fraction ≥ Large Wick Threshold
Lower Wick Fraction ≥ Large Wick Threshold
Interpretation: Two‑sided rejection indicating price discovery or balance.
• Pin Rejection (optional):
Body Fraction ≤ Small Body Threshold
Only one wick large
Interpretation: One‑sided rejection often occurring near support or resistance.
Notes and Context
This classifier intentionally avoids pattern names tied to prediction. Each classification describes observed auction behavior inside a single bar, not an expectation of future movement.
Sources and Further Reading
Candle structure and wick interpretation:
• Investopedia – Candlestick Patterns and Anatomy
www.investopedia.com
Volume and volatility context examples:
• Wyckoff Method – Effort vs Result (Volume + Price Structure)
school.stockcharts.com
• CME Group – Using Volume and Volatility Together
www.cmegroup.com
Example Applications:
1. A commitment candle occurring simultaneously with a volume spike may indicate institutional participation and acceptance at that price level.
2. A rejection candle forming during elevated volatility (ATR expansion) may signal failed price discovery and potential mean reversion zones.

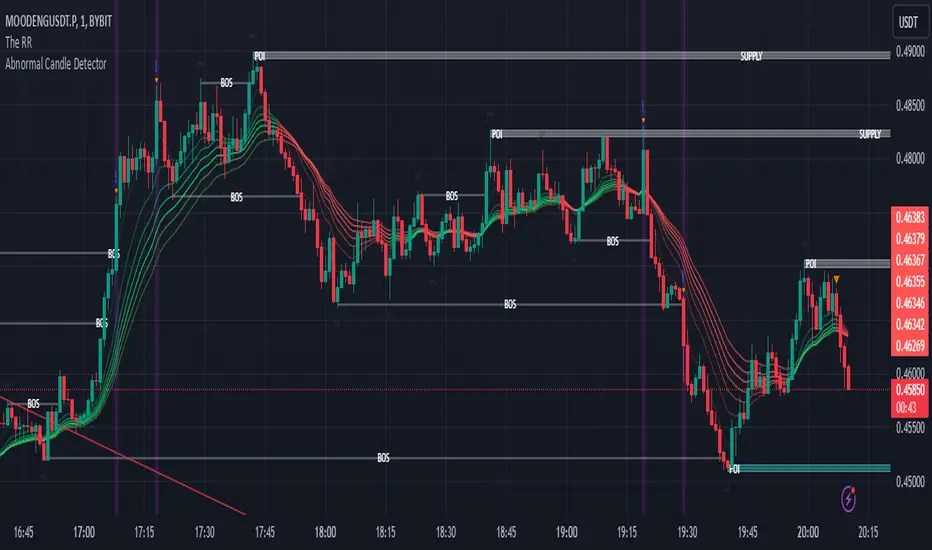
Abnormal Candle DetectorAbnormal Candle Detector
The Abnormal Candle Detector identifies sudden and unusual price movements by comparing the current candle's size and volume to recent averages. It highlights candles that deviate significantly from normal market behavior, helping traders spot breakouts, reversals, or high-impact events.
Features:
1. Abnormal Size Detection: Flags candles where the range (high-low) exceeds a user-defined multiplier of the average range.
2. Volume Confirmation: Optionally ensures abnormal movements are backed by higher-than-average volume.
3. Visual Markers:
Green triangles for bullish abnormal candles.
Red triangles for bearish abnormal candles.
Background highlights for better visibility.
4. Alerts: Real-time notifications when abnormal candles are detected.
Why Use It?
Spot early breakouts or trend reversals.
Identify high-impact events driven by news or institutional activity.
Filter noise and focus on significant market movements.
Customizable for any market or timeframe, the Abnormal Candle Detector is perfect for traders who want to stay ahead of major price action.
Incomplete Session Candle - Incomplete Timeframe Candle Marker The "Incomplete Session Candle - Incomplete Timeframe Candle Marker" is an advanced tool tailored for technical analysts who understand the importance of accurate timeframes in their charting. While the indicator is not limited to the Indian market, its genesis is rooted in the nuances of trading sessions like those in India, which span 375 minutes from 9:15 AM to 3:30 PM.
Key Features:
Detects if the current timeframe is intraday (minutes or hours).
Calculates the expected duration of the candle for the chosen timeframe.
Highlights candles that don't achieve their expected session duration by placing a cross shape above the bar.
Compatible across various intraday timeframes, aiding traders in spotting discrepancies promptly.
Why We Made This: Not Just for India:
While we looked at the Indian market, this indicator works everywhere. Regular timeframes like 30 minutes, 1 hour, and 2 hours often end with incomplete candles, especially at the end of the trading day. For example:
A 30-minute timeframe makes 13 candles, but the last one is only 15 minutes long.
A 1-hour timeframe shows 7 candles, but the last one is just the last 15 minutes.
By switching to different timeframes like 25 minutes, 75 minutes, and 125 minutes, you get more complete information for better trading decisions. Learn more about this in our article: "Power of 25, 75, and 125-Minute Timeframes in the Indian Market", recognized by Trading View's Editors' Pick.
Benefits:
The indicator extends its benefits even to users without access to certain timeframes. It accommodates traders using a 1-hour timeframe (pertaining to Indian traders). By employing this indicator, traders consistently remain mindful of incomplete candles within their chosen timeframe
For those who utilize concepts like RBR, RBD, DBR, and DBD, this indicator is paramount. An incomplete candle can skew analysis, leading to potential misinterpretations of base or leg candles.
Final thoughts:
In markets like the Indian stock market, adopting such a tool is not just beneficial, but necessary. Whether you have access to unconventional timeframes or are using traditional ones, recognizing and accounting for the limitations of incomplete candles is critical & it's important to know if your candles fit the timeframe properly. This indicator gives you a better view of the market, which helps you make smarter trades.
Lastly, Thank you for your support! Your likes & comments. If you want to give any feedback then you can give in comment section.
Let's conquer the markets together!

Price Action Candles R2.0 by JustUncleLThis is an updated version of my previous script, I have added a few extra Patterns and some patterns specs have chnaged over those specified by "Price Action Battle Station by theforexguy".
Because this script has diverted from the original specification of "theforexguy", I have decided to release it as a new version. Improvements have been made to some of the pattern finding calculations, for example Hammer and Shooting Stars are now special Pin Bars, they now must have preceding and succeeding confirm bars, so they do not occur very often.
NOTE: All the identification of PA candles is disabled by default.
Changes made in Version 2.0 :
Added Forex Morning and Evening Stars (the centre small candle is not a specific color).
Abbreviated text names for less cluttered look.
Change minimum/maximum bar sizes to be a % of current ATR, rather than pips, this makes relative sizing independent on Time Frame, and make the script work better with non-currency assets like stocks and commodities.
Change definition of Hammer and shooting Star so the the previous candle is part of a trend and is followed by a confirm candle.
Added some precendence test to reduce multiple action labels.

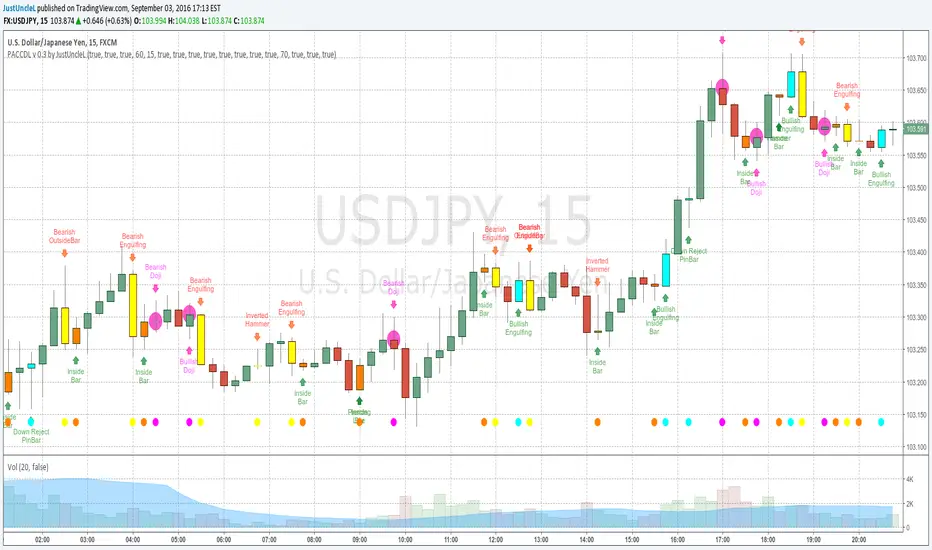
Price Action Candles v0.3 by JustUncleLThis requested release includes an Alert condition, so an alarm can be created on selected Price Action bars. Also this version modifies the Doji calculation to be similar to an Harami, so now the description of the Doji's are:
- Bearish Doji (aka Bearish Harami) (Fuchsia Highlight above Bar):
A large body Bull (green) candle followed by a small or no body candle
with wicks top and bottom that are at least 60% of candle.
- Bullish Doji (aka Bullish Harami) (Fuchsia Highlight below Bar):
A large body Bear (red) candle followed by a small or no body candle
with wicks top and bottom that are at least 60% of candle.
The % wick size (default 60%) of the Doji and the size of previous candle (default 15 pips) can be modified in the script Format parameters.
This modified Doji is particularly useful when combined with Heikin Ashi candles.
When Alerts are selected, an alert dot is also displayed along the bottom of the chart.
3SPC Three Candle Price Action Setup3SPC (Three Candle Price Action Setup) is an open-source indicator designed to detect
a simple and clearly defined three-candle price action pattern.
The logic is based on the following structure:
• The first two candles move in the same direction (bullish or bearish).
• The third candle interacts with the real bodies of both previous candles,
which may indicate a short-term liquidity sweep or price reaction.
• A bullish setup is confirmed when price holds above the open of the first candle.
• A bearish setup is confirmed when price holds below the open of the first candle.
This script does not use oscillators or lagging indicators.
It is intended as a visual aid for discretionary traders and should be used
together with market context, risk management and higher timeframe analysis.
The script is published as open-source for educational and transparency purposes.
UI Labels Translation:
- نمایش ستاپ صعودی: Show bullish setups
- نمایش ستاپ نزولی: Show bearish setups

ArithmaReg Candles [NeuraAlgo]ArithmaReg Candles
ArimaReg Candles provide a quantitative approach toward the visualization of price by rebuilding each candle using an adaptive regression model. This indicator eliminates much of the noise and micro-spikes and consolidates irregular volatility of raw OHLC data, which typically characterizes candles, into a much cleaner and more stable representation that better reflects the true directional intent of the market.
The algorithm applies a dynamic state-space filter to track the equilibrium price, truePrice, while suppressing high-frequency fluctuations. Noise in the price is extracted by comparing the raw close to the filtered state and removed from the candle body and wick structure through controlled adjustment logic. Finally, a volatility-based spread model rebuilds the candle's range to maintain realistic price geometry.
The direction of trends is given by comparing the truePrice against a smoothing baseline, permitting ArithmaReg Candles to underline the bullish and bearish phases with more clarity and much-reduced distortion. This yields a chart where transitions within trends, pullbacks, and momentum shifts are much easier to comprehend than their representation via traditional candles.
ArithmaReg Candles are designed for traders who require consistent, noise-filtered price structure-ideal for trend analysis, breakout validation, and precision entries. The indicator itself does not generate any signals; it only refines the visual environment so that your existing tools and decision models become more reliable.
How It Works
Micro-Price Extraction
A weighted micro-price is calculated to represent the bar's internal structure and reduce intrabar irregularities.
Adaptive Regression Filter
The state-based regression engine continuously updates price equilibrium, adjusting its confidence level. This gives the filter the ability to remain responsive during strong movements yet be stable during noisy periods.
Noise Removal & Candle Reconstruction
The difference between raw price and truePrice is considered noise. This noise is subtracted from OHLC values, and a volatility-scaled spread restores realistic wick and body proportions. What results is a candle that depicts true directional flow.
Trend Classification
A smoothed trend baseline is computed from the filtered price, and candle color is determined by whether the market is positioned above or below this equilibrium trend.
How to Use It
Identify True Trend Direction
Candles follow the cleaned price path so that you can differentiate valid trend shifts from temporary spikes or wick-driven traps.
Improve Existing Strategies
These candles will complement your existing indicators, be they Supertrend, moving averages, volume tools, or momentum oscillators, by giving you a more sound price basis.
Spot Clean Breakouts & Pullbacks
Reduced noise makes breakout structure, swing highs/lows, and retracements significantly clearer. This is particularly useful in fast markets like crypto and Forex.
Improve Entry & Exit Timing
By highlighting the underlying flow of price, ArithmaReg Candles help traders avoid false signals and pinpoint spots where the price momentum is actually changing.
Adaptable to All Timeframes & Assets
The filter is self-adjusting, so it performs consistently on scalping timeframes, intraday charts, swing setups, and all asset classes. Summary ArithmaReg Candles create a mathematically refined view of market structure by removing noise and reconstructing candles through adaptive regression. The result is a more refined, stable price representation that improves trend recognition and decision-making and enables professional-grade technical analysis.

HTF Candle Breakout Fibonacci LevelsThis indicator automatically plots Fibonacci retracement levels on a lower timeframe (LTF) after detecting a breakout candle on a selected higher timeframe (HTF).
🔍 How It Works
When a candle on your selected HTF closes beyond the high or low of the previous candle, the indicator automatically draws Fibonacci levels on the LTF.
These levels remain visible until the next HTF candle is formed — allowing you to trade retracements with contextual precision.
⸻
⚙️ Customization Options
From the indicator settings, you can modify:
• The HTF candle timeframe (default is 1D)
• Fibonacci levels and colors
• Enable or disable “Show Only the Latest Levels” — ideal for live trading to keep the chart clean and focused.
⸻
🟪 HTF Candles Preview
After applying the indicator, you’ll see 3 vertical bars on the right edge of your LTF chart. These represent a live preview of the last three HTF candles and update in real-time.
If you prefer a cleaner chart, disable this feature via the “Show HTF Candles” toggle in the settings.
⸻
Feel free to reach out if you have any questions.

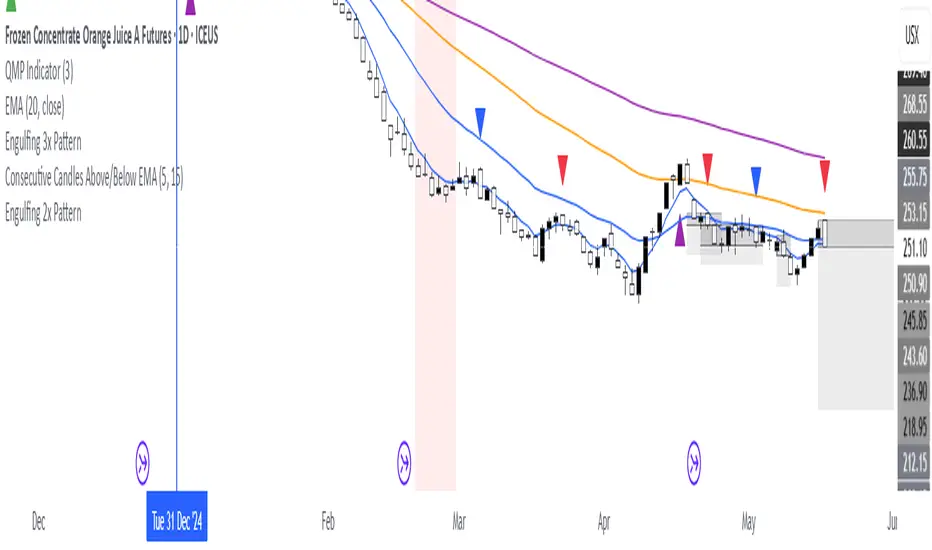
Consecutive Candles Above/Below EMADescription:
This indicator identifies and highlights periods where the price remains consistently above or below an Exponential Moving Average (EMA) for a user-defined number of consecutive candles. It visually marks these sustained trends with background colors and labels, helping traders spot strong bullish or bearish market conditions. Ideal for trend-following strategies or identifying potential trend exhaustion points, this tool provides clear visual cues for price behavior relative to the EMA.
How It Works:
EMA Calculation: The indicator calculates an EMA based on the user-specified period (default: 100). The EMA is plotted as a blue line on the chart for reference.
Consecutive Candle Tracking: It counts how many consecutive candles close above or below the EMA:
If a candle closes below the EMA, the "below" counter increments; any candle closing above resets it to zero.
If a candle closes above the EMA, the "above" counter increments; any candle closing below resets it to zero.
Highlighting Trends: When the number of consecutive candles above or below the EMA meets or exceeds the user-defined threshold (default: 200 candles):
A translucent red background highlights periods where the price has been below the EMA.
A translucent green background highlights periods where the price has been above the EMA.
Labeling: When the required number of consecutive candles is first reached:
A red downward arrow label with the text "↓ Below" appears for below-EMA streaks.
A green upward arrow label with the text "↑ Above" appears for above-EMA streaks.
Usage:
Trend Confirmation: Use the highlights and labels to confirm strong trends. For example, 200 candles above the EMA may indicate a robust uptrend.
Reversal Signals: Prolonged streaks (e.g., 200+ candles) might suggest overextension, potentially signaling reversals.
Customization: Adjust the EMA period to make it faster or slower, and modify the candle count to make the indicator more or less sensitive to trends.
Settings:
EMA Length: Set the period for the EMA calculation (default: 100).
Candles Count: Define the minimum number of consecutive candles required to trigger highlights and labels (default: 200).
Visuals:
Blue EMA line for tracking the moving average.
Red background for sustained below-EMA periods.
Green background for sustained above-EMA periods.
Labeled arrows to mark when the streak threshold is met.
This indicator is a powerful tool for traders looking to visualize and capitalize on persistent price trends relative to the EMA, with clear, customizable signals for market analysis.
Explain EMA calculation
Other trend indicators
Make description shorter