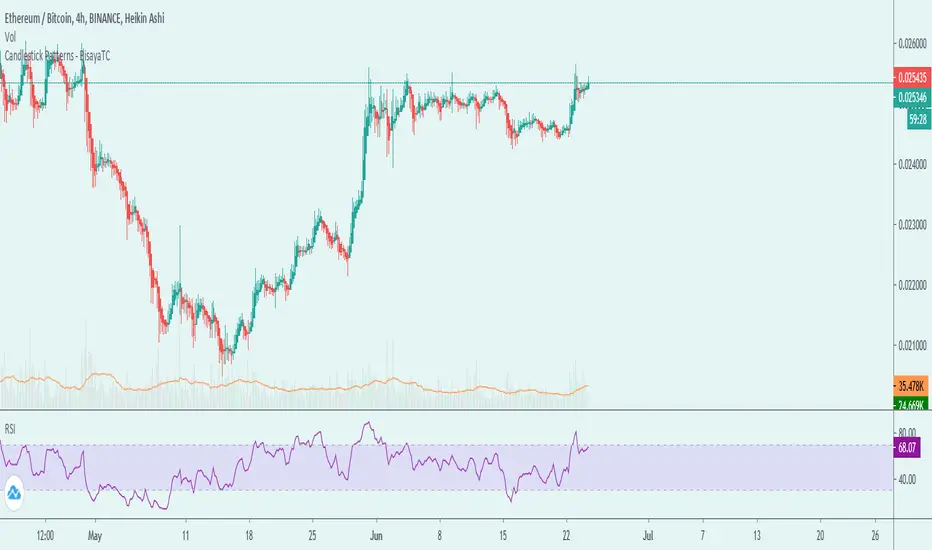
Candlestick Patterns - BisayaTCThe script displays a label when a candle stick pattern is detected based on Trends. This is related to the latest Candlestick patterns released in TradingView. I've created this to have all candlestick patterns in one indicator.
Candlestick Patterns can be one of confirmation of a trend you're following or a reversal.
DISCLAIMER: For educational purposes only. Nothing in this content should be interpreted as financial advice or a recommendation to buy or sell any sort of security or investment including all types of crypto. DYOR
"candle" için komut dosyalarını ara
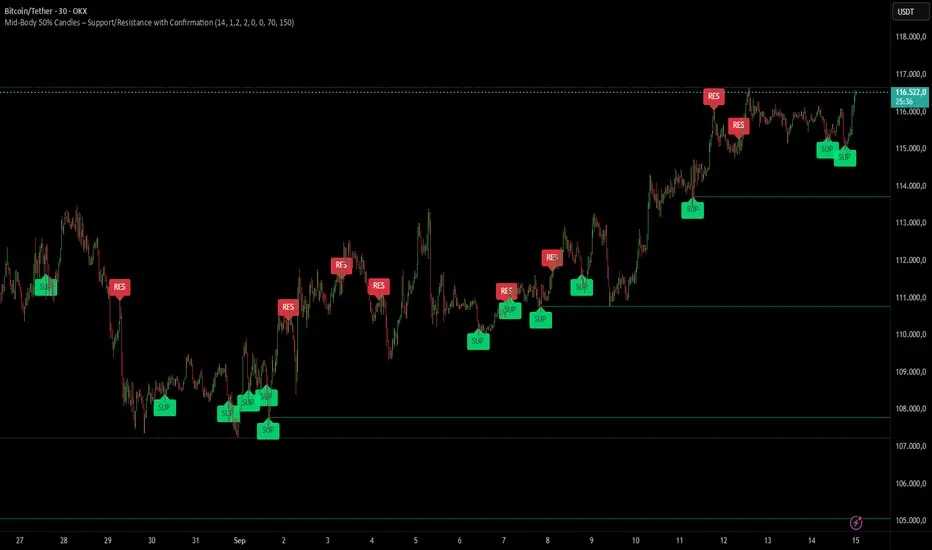
Mid-Body 50% Candles – Support/Resistance with ConfirmationHow it works:
– Calculates the mid-body (open+close)/2 of the previous candle.
– Bullish candle → potential SUP level.
– Bearish candle → potential RES level.
– Optional next-bar confirmation (close above/below the mid-body).
– Filters available: ATR size, swing detection, upper/lower wick %.
– Lines extend until broken or removed.
– Alerts available for: level creation, touch and break.
Use cases:
– Confirm candle rejections (pin bars).
– Filter false breakouts.
– Refine entries/exits for scalping or swing trading.
What makes it unique:
Unlike generic Fibonacci or candle tools, this script focuses exclusively on the 50% body level with confirmations and multiple filters, making it more precise for price action decision points.
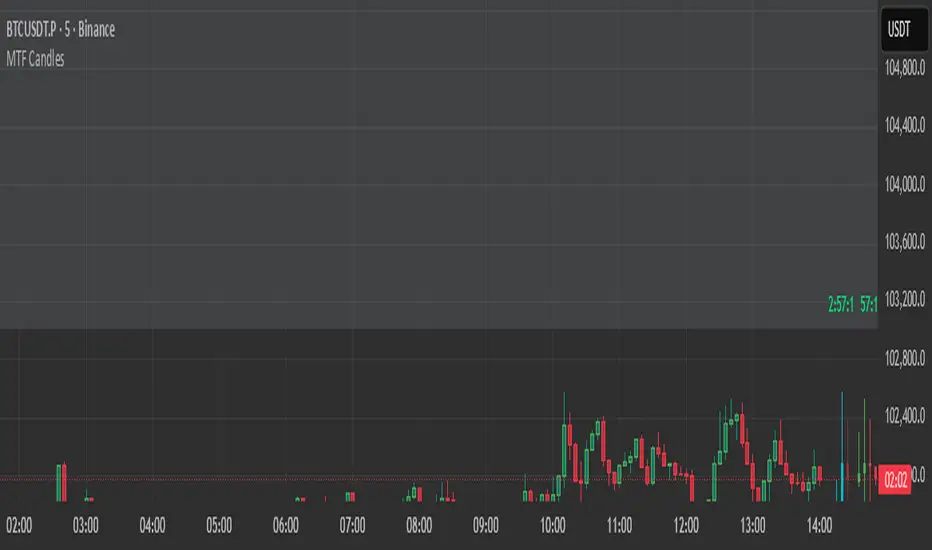
HTF Candles HTF Candles
Features
• 1-minute, 5-minute, 1-hour, 4-hour, and previous-day daily candles
• Visualizes the remaining time and number of candles from the lower timeframe that form the next higher-timeframe candle.”
•
Cumulative Volume Delta Candles Aggregated (Lite)Cumulative Volume Delta Candles Aggregated (Lite)
Multi-Exchange CVD Visualization in Candle Format
This indicator provides an aggregated Cumulative Volume Delta (CVD) view across multiple major perpetual futures exchanges in one chart. It is designed for traders who want a broader perspective on buying and selling pressure without switching between multiple charts or relying on a single exchange feed.
What It Does
Combines volume delta data from Binance, Bybit, OKX, Bitget, and Coinbase into a unified representation.
Displays CVD as candlesticks, where each candle reflects the open, high, low, and close of cumulative delta for the selected period.
Offers a clear visual of how buying and selling pressure evolves across markets in a structured, familiar candle format.
Key Features
✔ Exchange Aggregation: Incorporates data from several top futures markets available on TradingView.
✔ Anchor Reset: Allows you to set an anchor timeframe (e.g., daily) to reset cumulative values for better readability and analysis.
✔ Unit Normalization: Since exchanges report volumes in different units, the indicator normalizes all data and outputs values denominated in the base currency (coins) for consistency.
✔ Hidden OHLC Outputs: Provides open, high, low, and close values as hidden plots for use with other indicators or strategies.
✔ Lightweight Design: Optimized for efficiency while handling multiple real-time data requests.
Why It’s Different
Unlike standard single-exchange CVD tools, this indicator aggregates the majority of perpetual volume data available on TradingView, offering a more representative view of market sentiment. The candle-based representation of CVD introduces an additional layer of structure, helping traders identify shifts in momentum and pressure with more context than a simple cumulative line.
Use Cases
- Spotting aggregated buy/sell pressure trends across multiple exchanges.
- Confirming breakout or reversal signals with broader volume delta context.
- Serving as a custom data source for other indicators or algorithmic strategies.

High Volume CandlesInspired by Key bars from Option Stalker Pro.
This one is meant to be used on charts where the interval is <1D.
Highlights candles in chart with Volume > 1.4 * last 30 candles average volume.
Helps to not accidentally miss that a candle move happened on high volume (or that it did not happen on high volume...), like potential reversals or resistance/support breaks.
Make sure to move this indicator above the ticker in the Object Tree, so that it is drawn on top of the ticker's candles.
More infos: www.reddit.com

High/Low last 1-3 candlesHere you can display the high and low of the last 1, 2 or 3 candles. The whole thing is updated with every new candle. you can also switch the lines on or off as you wish and adjust the colour of the lines. have fun with it

Consecutive Candle CounterConsecutive Condition Counter is a versatile indicator that tracks and visualizes consecutive candles based on user-defined market conditions. It helps traders quickly identify streaks of bullish or bearish signals by counting how many bars in a row satisfy the selected condition.
🔍 Features:
Three selectable conditions via a dropdown:
Up & Down Days: Counts consecutive up or down candles. Each up candle adds +1, each down candle subtracts -1. The counter resets when direction changes.
RSI Signal: Counts how many consecutive bars RSI remains above 70 (+1 per bar) or below 30 (-1 per bar). Resets when RSI moves back to the neutral zone.
SMA Positioning: Counts consecutive bars where price stays above (+1) or below (-1) a Simple Moving Average (SMA). SMA period is user-defined.
📊 Visualization:
Positive streaks are shown in green, negative streaks in red, and neutral values in gray.
Displayed as a histogram below the chart for quick pattern recognition.
⚙️ Inputs:
Choose condition logic from the dropdown.
Configure the RSI period and SMA period as needed.
This tool can be helpful for identifying momentum streaks, overbought/oversold trends, or trend-following behavior in a visually intuitive way.

Rollover Candles 23:00-00:00 UTC+1This indicator highlights the Forex Market Rollover candles during which the spreads get very high and some 'fake price action' occurs. By marking them orange you always know you are dealing with a rollover candle and these wicks/candles usually get taken out later on because there are no orders in these candles.
Optimal settings: The rollover takes only 1 hour, so put the visibility of the indicator on the 1 hour time frame and below (or just the 1h).
IBD Style Candles [tradeviZion]IBD Style Candles - Visualize Price Bars Like the Pros
Transform your chart with institutional-grade IBD-style bars and customizable moving averages for both daily and weekly timeframes. This indicator helps you visualize price action the way professionals at Investors Business Daily do.
What This Indicator Offers:
IBD-style bar visualization (clean, professional appearance)
Customizable coloring based on price movement or previous close
Automatic timeframe detection for appropriate moving averages
Four customizable moving averages for daily timeframes (10, 21, 50, 200)
Four customizable moving averages for weekly timeframes (10, 20, 30, 40)
Options to use SMAs or EMAs with adjustable colors and line widths
"The IBD-style bars provide a cleaner view of price action, allowing you to focus on market structure without the visual noise of traditional candles."
How to Apply the IBD-Style Bars:
On your TradingView chart, select "Bars" as the chart type from the main chart type selection menu (next to the time interval options).
Right-click on the chart and select "Settings".
Go to the "Symbol" tab.
Uncheck the "Thin Bars" option to display thicker bars.
Set the "Up Color" and "Down Color" opacity to 0 for a clean IBD-style appearance.
Enable "IBD-style Candles" from the script's settings.
To revert to the original chart style, repeat the above steps and restore the default settings.
Moving Average Configuration:
The indicator automatically detects your timeframe and displays the appropriate moving averages:
Daily Timeframe Moving Averages:
10-day moving average (SMA/EMA)
21-day moving average (SMA/EMA)
50-day moving average (SMA/EMA)
200-day moving average (SMA/EMA)
Weekly Timeframe Moving Averages:
10-week moving average (SMA/EMA)
20-week moving average (SMA/EMA)
30-week moving average (SMA/EMA)
40-week moving average (SMA/EMA)
Usage Tips:
Enable "Color bars based on previous close" to identify momentum shifts based on prior candle closes
Customize colors to match your chart theme or preference
Enable only the moving averages relevant to your trading strategy
For cleaner charts, reduce the number of visible moving averages
For stock trading, the 10/21/50/200 daily and 10/40 weekly MAs are most commonly used by institutions
// Example configuration for different timeframes
if timeframe.isweekly
// Weekly configuration
showSMA1_Weekly = true // 10-week MA
showSMA4_Weekly = true // 40-week MA
else
// Daily configuration
showMA2_Daily = true // 21-day MA
showMA3_Daily = true // 50-day MA
showMA4_Daily = true // 200-day MA
While the IBD style provides clarity, remember that no visualization method guarantees trading success. Always combine with proper analysis and risk management.
If you found this indicator helpful, please consider leaving a comment or suggestion for future improvements. Happy trading!

Relative Volume CandlesVisualizes candlesticks with transparency based on volume relative to a moving average. Higher-than-average volume makes candles more opaque, while lower volume increases transparency—helping you spot significant price movements at a glance!
Features:
Customizable up/down candle colors (default: green/red)
Adjustable lookback period for volume averaging (default: 21)
Fine-tune transparency with base transparency (default: 80) and scale (default: 2.0)
Overlay directly on your chart for seamless analysis

HTF Candle Range Box (Fixed to HTF Bars)### **Higher Timeframe Candle Range Box (HTF Box Indicator)**
This indicator visually highlights the price range of the most recently closed higher-timeframe (HTF) candle, directly on a lower-timeframe chart. It dynamically adjusts based on the user-selected HTF setting (e.g., 15-minute, 1-hour) and ensures that the box is displayed only on the bars that correspond to that specific HTF candle’s duration.
For instance, if a trader is on a **1-minute chart** with the **HTF set to 15 minutes**, the indicator will draw a box spanning exactly 15 one-minute candles, corresponding to the previous 15-minute HTF candle. The box updates only when a new HTF candle completes, ensuring that it does not change mid-formation.
---
### **How It Works:**
1. **Retrieves Higher Timeframe Data**
The script uses TradingView’s `request.security` function to pull **high, low, open, and close** values from the **previously completed HTF candle** (using ` ` to avoid repainting). It also fetches the **high and low of the candle before that** (using ` `) for comparison.
2. **Determines Breakout Behavior**
It compares the **last closed HTF candle** to the **one before it** to determine whether:
- It **broke above** the previous high.
- It **broke below** the previous low.
- It **broke both** the high and low.
- It **stayed within the previous candle’s range** (no breakout).
3. **Classifies the Candle & Assigns Color**
- **Green (Bullish)**
- Closes above the previous candle’s high.
- Breaks below the previous candle’s low but closes back inside the previous range **if it opened above** the previous high.
- **Red (Bearish)**
- Closes below the previous candle’s low.
- Breaks above the previous candle’s high but closes back inside the previous range **if it opened below** the previous low.
- **Orange (Neutral/Indecisive)**
- Stays within the previous candle’s range.
- Breaks both the high and low but closes inside the previous range without a clear bias.
4. **Box Placement on the Lower Timeframe**
- The script tracks the **bar index** where each HTF candle starts on the lower timeframe (e.g., every 15 bars on a 1-minute chart if HTF = 15 minutes).
- It **only displays the box on those bars**, ensuring that the range is accurately reflected for that time period.
- The box **resets and updates** only when a new HTF candle completes.
---
### **Key Features & Advantages:**
✅ **Clear Higher Timeframe Context:**
- The indicator provides a structured way to analyze HTF price action while trading in a lower timeframe.
- It helps traders identify **HTF support and resistance zones**, potential **breakouts**, and **failed breakouts**.
✅ **Fixed Box Display (No Mid-Candle Repainting):**
- The box is drawn **only after the HTF candle closes**, avoiding misleading fluctuations.
- Unlike other indicators that update live, this one ensures the trader is looking at **confirmed data** only.
✅ **Flexible Timeframe Selection:**
- The user can set **any HTF resolution** (e.g., 5min, 15min, 1hr, 4hr), making it adaptable for different strategies.
✅ **Dynamic Color Coding for Quick Analysis:**
- The **color of the box reflects the market sentiment**, making it easier to spot trends, reversals, and fake-outs.
✅ **No Clutter – Only Applies to the Relevant Bars:**
- Instead of spanning across the whole chart, the range box is **only visible on the bars belonging to the last HTF period**, keeping the chart clean and focused.
---
### **Example Use Case:**
💡 Imagine a trader is scalping on the **1-minute chart** but wants to factor in **HTF 15-minute structure** to avoid getting caught in bad trades. With this indicator:
- They can see whether the last **15-minute candle** was bullish, bearish, or indecisive.
- If it was **bullish (green)**, they may look for **buying opportunities** at lower timeframes.
- If it was **bearish (red)**, they might anticipate **a potential pullback or continuation down**.
- If the **HTF candle failed to break out**, they know the market is **ranging**, avoiding unnecessary trades.
---
### **Final Thoughts:**
This indicator is a **powerful addition for traders who combine multiple timeframes** in their analysis. It provides a **clean and structured way to track HTF price movements** without cluttering the chart or requiring constant manual switching between timeframes. Whether used for **intraday trading, swing trading, or scalping**, it adds an extra layer of confirmation for trade entries and exits.
🔹 **Best for traders who:**
- Want **HTF structure awareness while trading lower timeframes**.
- Need **confirmation of breakouts, failed breakouts, or indecision zones**.
- Prefer a **non-repainting tool that only updates after confirmed HTF closes**.
Let me know if you want any adjustments or additional features! 🚀

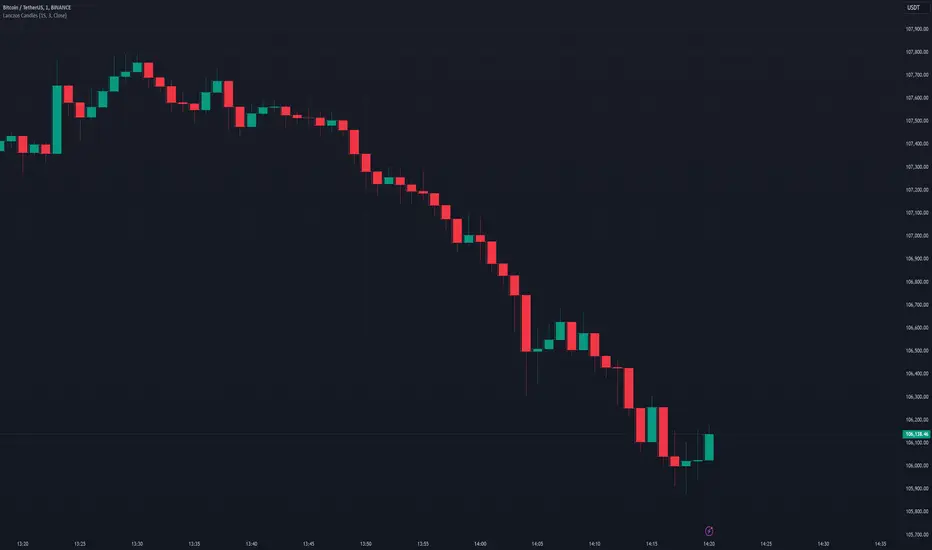
Lanczos CandlesThis indicator reconstructs price action using Lanczos resampling, incorporating lower timeframe data to create a more detailed representation of market movements. Traditional candle aggregation on higher timeframes tends to lose some price action detail - this indicator attempts to preserve more of that information through mathematical resampling.
The indicator samples price data from a lower timeframe and uses the Lanczos algorithm, a mathematical method commonly used in signal processing and image resampling, to reconstruct the price series at the chart's timeframe. The process helps maintain price movements that might otherwise be smoothed out in regular candle aggregation.
The main settings allow you to select the source timeframe for sampling, adjust the Lanczos filter width to balance smoothness versus detail preservation, and optionally enable Heikin Ashi calculation. The filter width parameter (default: 3) affects how aggressive the smoothing is - higher values produce smoother results while lower values retain more of the original variation.
This approach can be useful for technical analysis when you want to work with higher timeframes while maintaining awareness of significant price movements that occurred within those candles. The optional Heikin Ashi mode can help visualize trends in the resampled data.
The indicator works best when there's a clear ratio between your chart timeframe and the source timeframe (for example, using 1-minute data to build 5-minute candles).
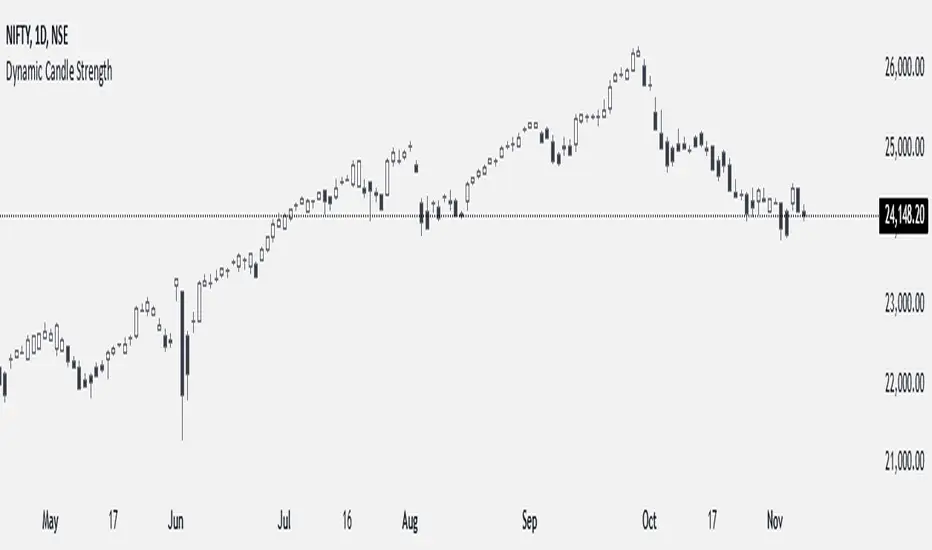
Dynamic Candle StrengthHow It Works
Initialization of Dynamic Levels:
The first candle's high and low are taken as the initial dynamic high and dynamic low levels.
If the next candle's close price is above the dynamic high, the candle is colored green, indicating bullish conditions.
If the next candle's close price is below the dynamic low, the candle is colored black, indicating bearish conditions.
If a candle's high and low crossed both the dynamic high and dynamic low, the dynamic high and low levels are updated to the high and low of that candle, but the candle color will continue with the same color as the previous candle.
Maintaining and Updating Dynamic Levels:
The dynamic high and low are only updated if a candle's close is above the current dynamic high or below the current dynamic low.
If the candle does not close above or below these levels, the dynamic high and low remain unchanged.
Visual Signals:
Green Bars: Indicate that the candle's close is above the dynamic high, suggesting bullish conditions.
Black Bars: Indicate that the candle's close is below the dynamic low, suggesting bearish conditions.
This method ensures that the dynamic high and low levels are adjusted in real-time based on the most recent significant price movements, providing a reliable measure of market sentiment.
Indecisive and Explosive CandlesThe Explosive & Base Candle with Gaps Identifier is an indicator designed to enhance your market analysis by identifying critical candle types and gaps in price action. This tool aids traders in pinpointing zones of significant buyer-seller interaction and potential institutional activity, providing valuable insights for strategic trading decisions.
Main Features:
Base Candle Identification: This feature detects Base candles, also known as indecisive candles, within the price action. A Base candle is characterized by a body (the difference between the close and open prices) that is less than or equal to 50% of its total range (the difference between the high and low prices). These candles mark zones where buyers and sellers are evenly matched, highlighting areas of potential support and resistance.
Explosive Candle Identification: The indicator identifies Explosive candles, which are indicative of strong market moves often driven by institutional activity. An Explosive candle is defined by a body that is greater than 70% of its total range. Recognizing these candles helps traders spot significant momentum and potential breakout points.
Supply and Demand Zone Identification: Both Base and Explosive candles are essential for identifying supply and demand zones within the price action. These zones are crucial for traders to place their trades based on the likelihood of price reversals or continuations.
Gap Detection: The indicator also detects gaps, defined as the difference between the close price of one candle and the open price of the next. Gaps are significant because prices often return to these levels to "fill the gap," providing opportunities for traders to predict price movements and place strategic trades.
Visual Markings and Alerts: The indicator visually marks Base and Explosive candles as well as gaps directly on the chart, making them easily identifiable at a glance. Traders can also set customizable alerts to notify them when these key candle types and gaps appear, ensuring they never miss an important trading opportunity.
Customizable Settings: Tailor the indicator’s settings to match your trading style and preferences. Adjust the criteria for Base and Explosive candles, as well as how gaps are detected and displayed, to suit your specific analysis needs.
How to Use:
Add the Indicator: Apply the Explosive & Base Candle with Gaps Identifier to your TradingView chart.
Analyze Identified Zones: Observe the marked Base and Explosive candles and gaps to identify key areas of support, resistance, and potential price reversals or continuations.
Set Alerts: Customize and set alerts for the detection of Base candles, Explosive candles, and gaps to stay informed of critical market movements in real-time.
Integrate with Your Strategy: Use the insights provided by the indicator to enhance your existing trading strategy, improving your entry and exit points based on the identified supply and demand zones.
The Explosive & Base Candle with Gaps Identifier is an invaluable tool for traders aiming to refine their market analysis and make more informed trading decisions. By identifying critical areas of price action, this indicator supports traders in navigating the complexities of the financial markets with greater precision and confidence.
FVG Breakaway/3rd Candle (Arjo) [MK]Simple script to identify FVGs (Fair Value Gaps) on the current chart timeframe. The script differs from other FVG indicators on the Tradingview platform by using Arjos 3rd candle rule to identify which gaps are 'Breakway Gaps' and which Gaps are likely to be returned to.
NOTE: As with all 'trading rules' this theory is not 100% accurate.
default settings:
Breakaway Gaps = YELLOW
Gaps that price may return to = GREEN
Mitigated Gaps = 100% TRANSPARENT
What is a FVG:
A FVG is a price area defined by a 3 candle pattern. For a bullish FVG, the low of the 3rd candle must be higher than the high of the 1st candle. This then leaves an area that is drawn as in the example below:
A bearish FVG is defined by the high of the 3rd candle being lower than the low of the 1st candle, as shown in the example below:
FVGs can act like magnets where price will either retrace to or reach for, therefore they can be used as entry points and also for take profit target levels.
If for example, a trader would like to use an FVG for an entry, it would be useful to know which FVGs are more likely for price to re-enter and which FVG will be left un-touched. FVGs that are likely to be left un-touched by price are called 'Breakaway Gaps'.
How do we define a 'Breakaway Gap':
First we identify FVGs using the rules stated above, then we look to see where the 3rd candle closed in relation to the 2nd candle. For a bullish 'Breakaway Gap' we want to see the 3rd candle close above the high of the 2nd candle. An example of a bullish Breakaway Gap is shown in the example below:
A bearish 'Breakaway Gap' is defined by the close of the 3rd candle being lower than the low of the 2nd candle. An example is shown below:
How do we define an FVG that price may return to:
Any gap that does not meet the above rules for a 'Breakway Gap' is therefore considered an FVG that price may return to. So for a bullish FVG that price may return to we would look to see if the close of the 3rd candle is above the high of the 2nd candle. If it is not above the high of the 2nd candle then it more likely that price will retrace into the FVG before continuing higher. An example is shown below:
A bearish gap that price may return to is defined by the close of the 3rd candle not being lower than the low of the 2nd candle. An example is shown below:
The indicator is based on the teachings of 'Arjo'. Note: breakaway gaps will only remain 'breakaway' until a liquidity level is reached. Breakaways therefore do not remain 'breakaway' forever. Users of the indicators must fully comprehend this theory before using the indicator with live markets.
Users of the script should be fully aware of this concept and also have conducted thorough backtesting using a large data set before using this indicator with live accounts.

Doji Candle _ ThaerAbusalahIdentify doji candles in heikin ashi .
the indicator will search for a doji candles that are same in upper and lower wick by 50% and more .

Extended Hour CandleThe Extended Hour Candle shows extended hour candle formations on the Daily chart. This indicator can be useful for those who want to analyse price movements during extended trading sessions without switching to intraday charts with "Extended trading hours" enabled.
How to Use:
Add the Extended Hour Candle indicator to a TradingView chart.
Adjust the color settings according to personal preferences, using the options to set the desired colors for up and down candles.
See the Candle during extended trading hours on the Daily chart

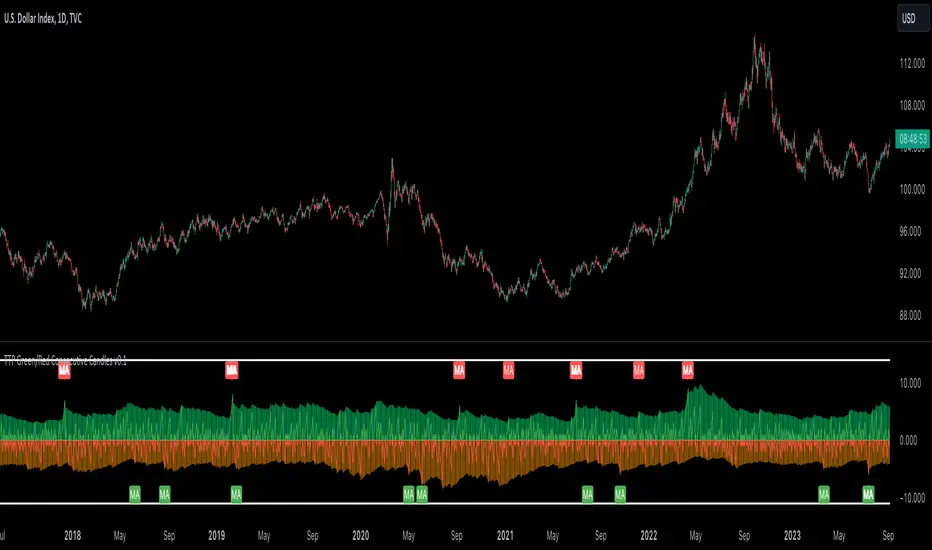
TTP Green/Red Consecutive CandlesThis indicator counts consecutive green/red candles offering some basic statistics and signals/alerts.
Features
- Counts consecutive green/red candles in an oscillator chart
- Moving average of the counting helps spotting when the consecutive candles are away from the mean. MA length and multiplier to adjust the signal sensitivity.
- Thresholds can be set to backtest and send alerts on any number of arbitrary consecutive candles of the same color.
- All time highs: the indicator keeps track of when the maximum has been reached
- Distribution data: the number of times each number of consecutive color candles has been reached is offered
Signals
- Threshold signal triggers when the number of candles of the same color is above the specified threshold.
- MA cross signal triggers when the number of candles of the same color is above the MA.
Boring Candles by BitcoinBailyBoring candlestick is a candlestick whose body is less than 50% of its total candlestick range, this candle is usually small in size.
This indicates that the price range between the open and close of this candle was relatively small, and that there was not a lot of volatility during that time period.

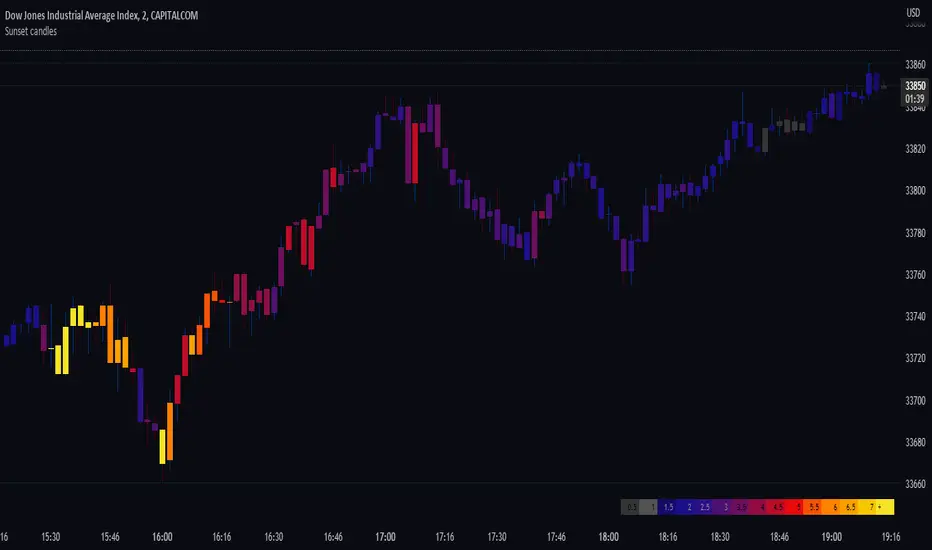
Sunset candlesDisplays the volume behind each candle with colors, to visualise their evolution over time, directly in the chart.
This indicator is best suited for dark mode (Suggested background color: #0a0c12).
The more intense is the color, the bigger is the volume.
The unit is a 400 periods moving average of the volume, considered as 1 volume.
Each color represents half of this volume. For ex: Grays indicate under (or equal) to the 400 MA (low volumes). Bright yellow represents above 7 times the 400 MA (very high volumes).
When there's no available volume datas, the candles turn bright green by default.
The wicks' colors stay the same, and can still indicate the direction of the candle.
In the settings, you can show/hide the gradient of the volume. By moving your chart over this gradient, it is possible to compare the candles to the colors, and read the corresponding volume number.
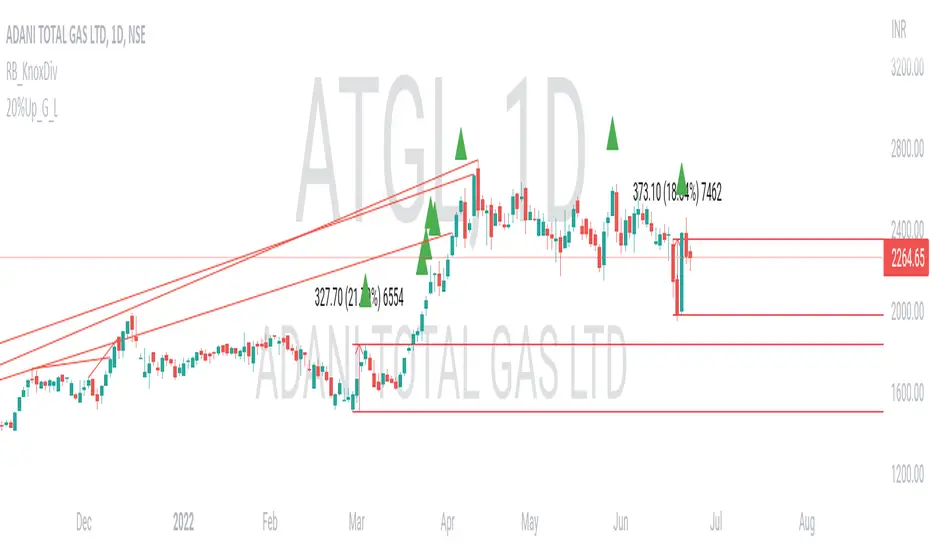
20% up with all continuously green candle: Lovevanshi It can be used to get the indication for 20% up movement among all continuously green candles formed in past. It is suitable for Indian company stock for short term trading plans.
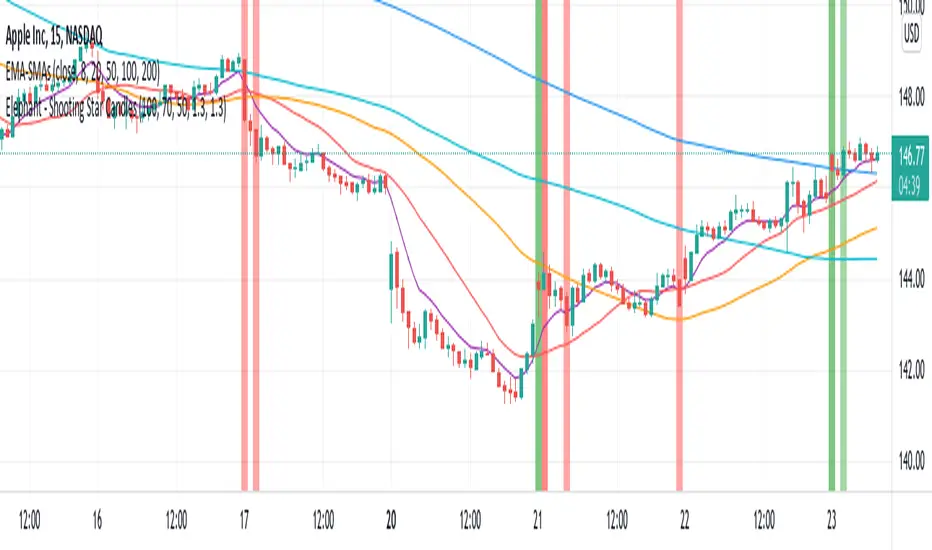
Elephant - Shooting Star CandlesThis script aims to show elephant and shootingstar candles. Body for elephant are at least 70% of the whole candle. Shootingstar have a body of 35% times the lenht of the full candle. Both are searched with 1.3 Standard Deviations as noise within 100 bars. Colors are ploted if closes above/below 200 SMA
[LixxChartz] Engulfing Candle Auto FinderProbably the most complicated script you have seen...
The Engulfing Candle Script that ACCTUALLY finds the engulfing candles.
This indicator is a part of my new script I am creating and I will be realising soon. Hope it helps.
I really don't understand why other people were making it so complicate LOL
